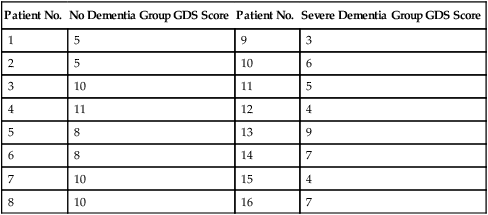
Parametric statistics are always associated with a certain set of assumptions that the data must meet; this is because the formulas of parametric statistics yield valid results only when the properties of the data are within the confines of these assumptions (Munro, 2005). If the data do not meet the parametric assumptions, there are nonparametric alternatives that do not require those assumptions to be met, usually because nonparametric statistical procedures convert the original data to rank-ordered or ordinal level data. Many statistical tests can assist the researcher in determining whether his or her data meet the assumptions for a given parametric test. The most common assumption (that accompanies all parametric tests) is the assumption that the data are normally distributed. The K2 test and the Shapiro-Wilk test are formal tests of normality that assess whether distribution of a variable is non-normal—that is, skewed or kurtotic (see Chapter 21) (D’Agostino, Belanger, & D’Agostino, 1990). The Shapiro-Wilk test is used with samples with less than 1000 subjects. When the sample is larger, the Kolmogorov-Smirnov D test is more appropriate. All of these statistics are found in mainstream statistical software packages and are accompanied by a p value. Significant normality tests with p ≤ 0.05 indicate that the distribution being tested is significantly different from the normal curve, violating the normality assumption. The nonparametric statistical alternative is listed in each section in the event that the data do not meet the assumptions of each parametric test illustrated in this chapter. 1. Sample means from the population are normally distributed. 2. The dependent or outcome variable is measured at the interval/ratio level. 3. The two samples have equal variance. The formula for the t-test is: Using an example from a study examining the levels of depression among 16 elderly long-term care residents, differences between residents with and without dementia were investigated (Cipher & Clifford, 2004). A subset of data for these patients was selected for this example so that the computation would be small and manageable (Table 25-1). In actuality, studies involving t-tests need to be adequately powered to identify significant differences between groups accurately (Aberson 2010; Cohen & Cohen, 1983). All data presented in this chapter are actual, unmodified clinical data for a small number of study participants. TABLE 25-1 Depression Scores by Dementia Level among Elderly Long-Term Care Residents The independent variable in this example was level of dementia and included two levels—a “no dementia” group and a “severe dementia” group. The level of dementia was based on clinical ratings of neuropsychologists using the Functional Assessment Staging Tool (Reisberg, Ferris, Deleon, & Crook, 1982). The dependent variable was the score of the long-term care resident on the Geriatric Depression Scale (GDS) (Yesavage, Brink, & Rose, 1983). The GDS assesses the level of depression in elderly adults, with higher numbers indicative of more depressive symptoms. The null hypothesis is: There are no significant differences between elderly adults with dementia and elderly adults without dementia on depression scores. The computations for the t-test are as follows: Step 1: Compute means for both groups, which involves the sum of scores for each group divided by the number in the group. Step 2: Compute the numerator of the t-test: Step 3: Compute the standard error of the difference. a. Compute the variances for each group: b. Plug into the standard error of the difference formula: Step 5: Compute degrees of freedom (df): Step 6: Locate the critical t value in the t distribution table in Appendix B at the back of your textbook and compare the critical t value with the obtained t value. Our obtained t is 2.55, exceeding the critical value, which means that our t-test is significant and represents a real difference between the two groups. We can reject the null hypothesis and state: An independent samples t-test computed on GDS scores revealed long-term residents with no dementia had significantly higher depression scores than long-term residents who had severe dementia, t (14) = 2.55, p < 0.05; If the data do not meet the assumptions involving normality or equal variances for an independent samples t-test, the nonparametric alternative is the Mann-Whitney U test. Mann-Whitney U calculations involve converting the data to ranks, discarding any variance or normality issues associated with the original values. In some studies, the data collected are ordinal level, and the Mann-Whitney U test is appropriate for analysis of the data. The Mann-Whitney U test is 95% as powerful as the t-test in determining differences between two groups. For a more detailed description of the Mann-Whitney U test, see the statistical textbooks by Daniel (2000) and Munro (2005). The statistical workbook for healthcare research by Grove (2007) has exercises for expanding your understanding of t-tests and Mann-Whitney U results from published studies. When samples are related, the formula used to calculate the t statistic is different from the formula previously described for independent groups. One type of paired samples refers to a research design that repeatedly assesses the same group of people, a design commonly referred to as a repeated measures design. Another research design for which a paired samples t-test is appropriate is the case-control research design. Case-control designs involve a matching procedure whereby a control subject is matched to each case, in which the cases and controls are different people but matched demographically (Gordis, 2008). Paired or dependent samples t-tests can also be applied to a crossover study design, in which subjects receive one kind of treatment and subsequently receive a comparison treatment (Gordis, 2008). However, similar to the independent samples t-test, this t-test requires that differences between the paired scores be independent and normally or approximately normally distributed.
Using Statistics to Determine Differences
 http://evolve.elsevier.com/Grove/practice/
Choosing Parametric versus Nonparametric Statistics to Determine Differences
t-tests
t-test for Independent Samples
Calculation

Patient No.
No Dementia Group GDS Score
Patient No.
Severe Dementia Group GDS Score
1
5
9
3
2
5
10
6
3
10
11
5
4
11
12
4
5
8
13
9
6
8
14
7
7
10
15
4
8
10
16
7
Interpretation of Results
 = 8.4 versus 5.6. Prior research suggests that elderly residents with dementia do not experience less depression, but rather they have difficulty communicating their distress (Ott & Fogel, 2004; Scherder et al., 2005). With additional research in this area, this knowledge might be used to facilitate improvements in methods used by healthcare professionals to assess emotional distress accurately among elderly adults with dementia (Cipher, Clifford, & Roper, 2006; Thakur & Blazer, 2008).
Nonparametric Alternative
t-tests for Paired Samples
Using Statistics to Determine Differences
 = mean of group 1
 = mean of group 2
 = to the standard error of the difference between the two groups.
 = 8.38
 = 5.63
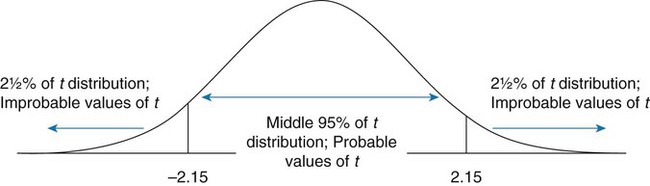


Get Clinical Tree app for offline access
