The interpretation of research outcomes is usually the final chapter of theses or dissertations and the final section of research articles, which is often entitled “Discussion.” Presentations of studies often conclude with an interpretation of the research outcomes. This chapter focuses on the interpretation of research outcomes from quantitative, outcomes, and intervention research. The interpretations of research outcomes for qualitative research are presented in Chapter 12. The process of interpreting research outcomes for quantitative, outcomes, and intervention studies includes the following: (1) examining study evidence, (2) determining findings, (3) forming conclusions, (4) identifying limitations, (5) generalizing the findings, (6) considering implications for practice, and (7) suggesting further studies. Each of these activities is discussed in this chapter with examples from a quantitative descriptive, predictive correlational study by Rutkowski and Connelly (2011). The first step in interpretation involves considering the evidence available that supports or contradicts the validity of study results related to the research purpose and objectives, questions, or hypotheses. The process is similar to conducting a critical appraisal of your own study. Your temptation is to ignore flaws—certainly not to point them out. However, an honest completion of this process is essential to build a body of knowledge. It is not a time for confession, remorse, and apology but rather for thoughtful reflection. You need to identify the limitations of your study and consider how these might affect the study findings and conclusions (Fawcett & Garity, 2009). One assumption often made in interpreting study results is that the study variables were adequately measured. This adequacy is determined by examining the fit of operational definitions with the framework and through validity and reliability information. Although you should determine the reliability and validity of measurement strategies before using them in your study, you need to reexamine the measures at this point to determine the strength of evidence available from the results (Fawcett & Garity, 2009; Waltz, Strickland, & Lenz, 2010). For example, did the scale used to measure anxiety truly reflect the anxiety experienced in the study population? What was the effect size? Were the validity and reliability of instruments examined in the present study? Can this information be used to interpret the results? The validity and reliability of measurement methods are critical to the validity of results A descriptive, predictive correlational study by Rutkowski and Connelly (2011) is presented as an example throughout this chapter. The purpose of this study was “to examine the relationships between parent physical activity, parent-adolescent obesity risk knowledge, and adolescent physical activity” (Rutkowski & Connelly, 2011, p. 52). These researchers based their study on the significant problem of childhood obesity in the United States and the need to determine knowledge of adolescents and their parents of obesity risk and their physical activity. The study included three measurement methods, Obesity Risk Knowledge Scale (ORK-10) (Swift, Glazebrook, & Mcdonald, 2006), International Physical Activity Questionnaire (IPAQ, 2001), and Patient Centered Assessments and Counseling for Exercise Plus Nutrition + Moderate Vigorous Physical Activity (PACE+ MVPA) (Prochaska, Sallis, & Long, 2001). The researchers clearly linked the study variables (obesity risk knowledge, physical activity of adults, and physical activity of adolescents) to the three measurement methods in Table 26-1. The measurement methods, validity, and reliability were addressed in the following study excerpt. TABLE 26-1 Summary of Study Measures and Scoring MET, Metabolic equivalent of the task. Rutkowski, E. M., & Connelly, C. D. (2011). Obesity risk knowledge and physical activity in families of adolescents. Journal of Pediatric Nursing, 26(1), 53. Rutkowski and Connelly (2011) provided a detailed description of their measurement methods and how they were scored (see Table 26-1). The validity and reliability of the IPAQ are very strong because the scale has been used internationally in several countries and had strong reliability in this study (r = 0.80). The PACE+ MVPA is recognized to have test-retest reliability and concurrent validity, but no specific information was provided. The ORK-10 has evidence of strong internal consistency reliability with adults in previous studies but has not been used with adolescents and had low internal reliability alpha coefficients in this study (r = 0.053 for adolescents and r = 0.59 for parents). The discussion of the measurement methods would have been strengthened by an expanded description of the ORK-10 scale validity and the reliability and validity for the PACE+ MVPA. The reliability of the ORK-10 is a study limitation that might have influenced the study findings. The researchers recognized the limitation of the ORK-10 scale reliability for both adolescents and adults, which is discussed later in this chapter. Many activities that occur during data collection affect the meaning of study results. Did the study have a high refusal rate for subject participation, or was the attrition high? Was the sample size sufficient (Aberson, 2010; Fawcett & Garity, 2009; Thompson, 2002)? Did strategies for acquiring a sample eliminate important groups whose data would have influenced the results? Did the research team achieve intervention fidelity when the treatment was implemented (Stein, Sargent, & Rafaels, 2007)? Did unforeseen events occur during the study that might have changed or had an impact on the data? Were measurement techniques consistent? What impact do inconsistencies have on interpreting results? Sometimes data collection does not proceed as planned. Unforeseen situations alter the collection of data. What were these variations in the study? What impact do they have on interpreting the results? Sometimes someone other than the subject completes data collection forms. Also, variations may occur when scales are administered. For example, an anxiety scale may be given to one subject immediately before a painful procedure and to another subject on awakening in the morning. Values on these measures cannot be considered comparable. Data integrity also depends on the responses of the research participants, which could be compromised by anxiety, time constraints, denial, or other factors not in the direct control of the researcher. The researcher must be on the alert for these subject factors that could compromise the integrity of the data. Values on these measures cannot be considered comparable. These types of differences are seldom reported and sometimes not even recorded. To some extent, only the researcher knows how consistently the measurements were taken. Reporting of this information depends on the integrity of the researcher (Fawcett & Garity, 2009; Kerlinger & Lee, 2000; Pyrczak & Bruce, 2005; Stein et al., 2007). Rutkowski and Connelly (2011) clearly identified their sampling method as purposive, convenience and noted appropriate inclusion sampling criteria. A power analysis was conducted to determine that the sample size of 94 adolescent/parent dyads was adequate for this study. There was no sample attrition noted in the study, but it would have been helpful if the researchers had discussed the refusal rate of potential participants. The procedures for collecting data in this study were clearly described as indicated in the following excerpt. However, the researchers might have provided a little more detail about the self-administration of the scales by the adults and adolescents. The process of data analysis is an important factor in evaluating the meaning of results. One important part of this examination is to summarize the study weaknesses related to the data analysis process. Ask yourself these questions concerning the meaning of your results: Were the data checked to ensure that limited or no errors occurred during data entry into the computer? How many subjects have missing data, and how was missing data managed to decrease the effects on the study results? Were the analyses accurately implemented and calculated? Were statistical assumptions violated? Were the statistics used appropriate for the data? It is best to address these issues initially before analyses are performed and again when completing the analyses and preparing the final report. Researchers should consult with a biostatistician during the planning of a study and during data analysis to ensure the appropriateness of the statistical tests selected. The biostatistician could also be helpful in interpreting the results. Before submitting a study for publication, we recommend rechecking each analysis reported in the paper. We also encourage reexamining the analysis statements in the article for accuracy and clarity. Are you correctly interpreting the results of the analysis? Documentation on each statistical value or analysis statement reported in the paper is filed with a copy of the article. The documentation includes the date of the analysis, the page number of the computer printout showing the results (the printout is stored in a file by date of analysis), the sample size for the analysis, and the number of missing values (Corty, 2007; Grove, 2007; Fawcett & Garity, 2009). Rutkowski and Connelly (2011) identified their data analysis with a separate heading that is presented in the following excerpt. The data analysis section clearly addressed the sample size of the study, analysis software package used, and the types of analyses conducted. This section would have been strengthened by including a power analysis that discussed the effect size for relationships because the study examined both differences between the adolescents and their parents and relationships of obesity risk knowledge with physical activities for adolescents and adults (Aberson, 2010). This section mentioned the inferential statistic conducted for group differences, the two-tailed t-test, but did not mention that relationships were examined with the Pearson product-moment correlation and regression analysis techniques. The outcomes of data analysis are the most direct evidence of the results. The researcher has intimate knowledge of the research and needs to evaluate its strengths and limitations carefully when judging the validity of the results. In descriptive and correlational studies, the validity of the results depends on how accurately the variables were measured in selected samples and settings. Interpretation of results from quasi-experimental and experimental studies is often based on decision theory, with five possible results: (1) significant results that are in keeping with the results predicted by the researcher, (2) nonsignificant results, (3) significant results that oppose the results predicted by the researcher, (4) mixed results, and (5) unexpected results (Shadish, Cook, & Campbell, 2002). Significant results that coincide with the researcher’s predictions are the easiest to explain and, unless weaknesses are present, validate the proposed logical links among the elements of the study. These results support the logical links developed by the researcher among the purpose, framework, questions, variables, and measurement methods (Shadish et al., 2002). This outcome is very satisfying to the researcher. However, the researcher needs to consider alternative explanations for the positive findings. What other elements could possibly have led to the significant results?
Interpreting Research Outcomes
 http://evolve.elsevier.com/Grove/practice/
Examining Evidence
Evidence from Measurement
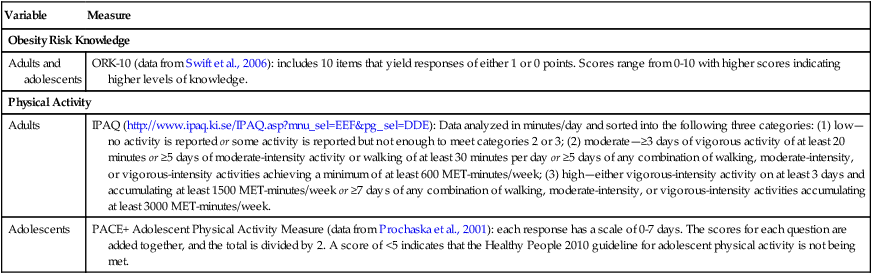
Variable
Measure
Obesity Risk Knowledge
Adults and adolescents
ORK-10 (data from Swift et al., 2006): includes 10 items that yield responses of either 1 or 0 points. Scores range from 0-10 with higher scores indicating higher levels of knowledge.
Physical Activity
Adults
IPAQ (http://www.ipaq.ki.se/IPAQ.asp?mnu_sel=EEF&pg_sel=DDE): Data analyzed in minutes/day and sorted into the following three categories: (1) low—no activity is reported or some activity is reported but not enough to meet categories 2 or 3; (2) moderate—≥3 days of vigorous activity of at least 20 minutes or ≥5 days of moderate-intensity activity or walking of at least 30 minutes per day or ≥5 days of any combination of walking, moderate-intensity, or vigorous-intensity activities achieving a minimum of at least 600 MET-minutes/week; (3) high—either vigorous-intensity activity on at least 3 days and accumulating at least 1500 MET-minutes/week or ≥7 days of any combination of walking, moderate-intensity, or vigorous-intensity activities accumulating at least 3000 MET-minutes/week.
Adolescents
PACE+ Adolescent Physical Activity Measure (data from Prochaska et al., 2001): each response has a scale of 0-7 days. The scores for each question are added together, and the total is divided by 2. A score of <5 indicates that the Healthy People 2010 guideline for adolescent physical activity is not being met.
Evidence from the Data Collection Process
Evidence from the Data Analysis Process
Evidence from Data Analysis Results
Significant and Predicted Results
![]()
Stay updated, free articles. Join our Telegram channel

Full access? Get Clinical Tree


Interpreting Research Outcomes
Get Clinical Tree app for offline access
