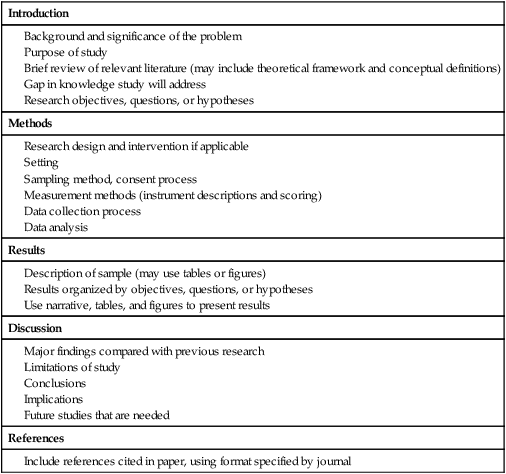
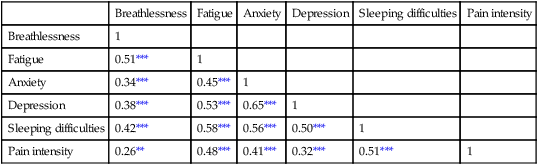
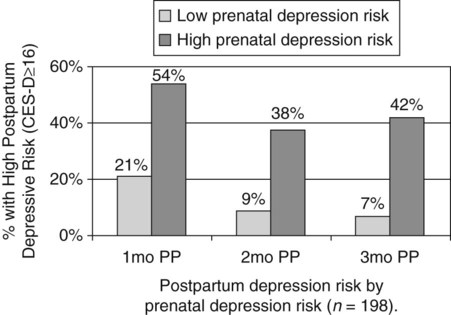
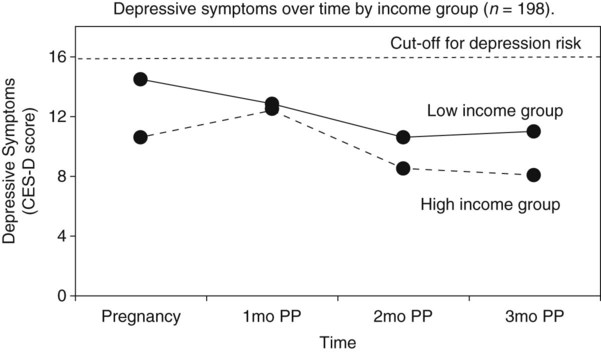
Communicating research findings, the final step in the research process, involves developing a research report and disseminating it through presentations and publications to audiences of nurses, healthcare professionals, policy makers, and healthcare consumers. Disseminating study findings provides many advantages for the researcher, the nursing profession, and the consumer of nursing services. By presenting and publishing findings, researchers advance the knowledge of a discipline, which is essential for providing evidence-based practice. For individual researchers, communicating study findings often leads to professional advancement, personal recognition, and other psychological and financial compensations. These rewards are extremely important for the continuation of research in a discipline. By communicating research findings, the researcher also promotes the critical analysis of previous studies, encourages the replication of studies, and identifies additional research problems. Over time, the findings from many studies are synthesized with the ultimate goal of providing evidence-based health care to patients, families, and communities (Craig & Smyth, 2012; Melnyk & Fineout-Overholt, 2010). Both quantitative and qualitative research reports include four major sections or content areas: (1) introduction, (2) methods, (3) results, and (4) discussion of the findings (Pyrczak & Bruce, 2007). The type and depth of information included in these sections depend on the study, the intended audiences, and the mechanisms for disseminating the report. For example, theses and dissertations are research reports, written to demonstrate the student’s depth in understanding of the research problem and process to faculty members. Research reports developed for publication in journals are written to communicate study findings efficiently and effectively to nurses and other healthcare professionals. Some journals limit the introduction to two or three brief paragraphs that include a statement about the theoretical framework for the study, a sufficient review of the literature to state what the gap in knowledge is, and the clear purpose of the study. The methods, results, and discussion sections of qualitative studies are usually more detailed than those sections of quantitative studies because of the complex data collection and analysis procedures. Finally, the discussion section briefly acknowledges the limitations of the study, presents the findings in relation to other literature, and discusses the implications of the findings for the intended journal audience. This section provides direction to novice researchers writing their first quantitative research report. To begin, the title of your research report needs to indicate what you have studied and attract the attention of interested readers. The title should be concise and consistent with the study purpose and the research objectives, questions, or hypotheses. Often a title includes the major study variables and population and indicates the type of study conducted, but it should not include the results or conclusions of a study (Pyrczak & Bruce, 2007). Heo, Moser, Lennie, Zambroski, and Chung (2007, p. 16) provided the following title for their study: “A Comparison of Health-Related Quality of Life between Older Adults with Heart Failure and Healthy Older Adults.” This title is concise, states the focus of the study (comparative descriptive), identifies a key study variable (health-related quality of life [HRQOL]), and includes the populations studied (older adults with heart failure and healthy older adults). However, this study is also predictive, and this is not indicated in the study title. The researchers studied additional independent variables (health perception, functional status, physical symptom status, emotional symptom status, and social support) to predict the dependent variable HRQOL in older adults with and without heart failure. An alternative title would be “Predictors of Health-Related Quality of Life in Older Adults with and without Heart Failure.” Some journals limit the length for titles of manuscripts, whereas other journals discourage use of colons. Most research reports also include an abstract that summarizes the key aspects of the study. An abstract is usually about 200 to 300 words and describes the problem, purpose, framework, methods, sample size, key results, and conclusions (Pyrczak & Bruce, 2007). We provide details for developing an abstract of a study later in this chapter. Heo et al. (2007) included the following abstract for their study. Heo et al. (2007) concisely organized their abstract with headings and clearly indicated the problem (background), sample size (90 older adults with heart failure and 116 healthy older adults), results, and conclusions. The purpose of the study was clearly stated under the heading “Objective” as required in the journal’s instructions. The “Methods” section was less clear on the type of study design, variables studied, measurement methods, and data collection process. This abstract is a strong abstract but could have been improved if the authors had been allowed to expand the “Methods” section. Following the abstract are the four major sections of a research report: introduction, methods, results, and discussion. Table 27-1 provides an outline of the content covered in each of these sections for a quantitative research report. The research report by Heo et al. (2007) is used as an example when discussing these sections. The complete research article can be accessed through the Cumulative Index to Nursing and Allied Health Literature (CINAHL). Also, because Heo et al. (2007) received funding from the National Institutes of Health to conduct the study, the publication is also available at no cost from PubMed Central (http://www.ncbi.nlm.nih.gov/pmc/articles/). TABLE 27-1 Outline for a Quantitative Research Report The introduction of a research report discusses the background and significance of the problem; identifies the problem statement and purpose, reviews the relevant empirical and theoretical literature, describes the study framework, and identifies the research purpose (aims, objectives, questions, or hypotheses if applicable). You will have developed this content for the research proposal; you summarize it in the final report. Depending on the type of research report, the review of literature and framework might be separate sections or separate chapters as in a thesis or dissertation. Key content from the introduction of the study by Heo et al. (2007) is presented as an example. The review of literature section of a research report documents the current knowledge of the problem investigated. The sources included in the literature review are the sources that you used to develop your study and interpret the findings. A review of literature can be two or three paragraphs or several pages long. In journal articles, the review of literature is concise and usually includes 15 to 20 sources. Theses and dissertations frequently include an extensive literature review to document the student’s knowledge of the research problem. The summary of the literature review clearly identifies what is known, what is not known or the gap in knowledge, and the contribution of this study to the current knowledge base. The objectives, questions, or hypotheses that were used to direct the study often are stated at the end of the literature review. Heo et al. (2007) provided a brief summary of the relevant literature and included what is known and not known about the effects of heart failure on HRQOL. See Chapter 6 for more information on writing a review of the literature. A research report needs to include an explicitly identified framework. In this section, you identify and define the major concepts in the framework and describe the relationships among the concepts (see Chapter 7). You can develop a schematic map or model to clarify the logic within the framework. If a particular proposition or relationship is being tested, that proposition should be clearly stated. Developing a framework and identifying the proposition or propositions examined in a study connect the framework and the research purpose to the objectives, questions, or hypotheses. The concepts in the framework need to be linked to the study variables and are used to define the variables conceptually. Heo et al. (2007, p. 17) clearly identified the framework of their study as the Wilson and Cleary (1995) HRQOL model (see Figure 27-1). The variables were conceptually and operationally defined and presented in a table that is included later in this chapter. If the journal allowed more space, the researchers might have expanded the literature review section based on this framework to include effects of age, health perception, functional status, physical symptom status, emotional symptom status, and social support on HRQOL in individuals with and without heart failure. The methods section of a research report describes how the study was conducted. This section needs to be concise yet provide sufficient detail for nurses to appraise critically or replicate the study procedures. In this section you will describe the study design, sample, setting, methods of measurement, data collection process, and plan for data analysis. If the research project included a pilot study, the planning, implementation, and results obtained from the pilot study are briefly described. You will also describe any changes made in the research project based on the pilot study (Pyrczak & Bruce, 2007). The study design should be explicitly stated. Heo et al. (2007) implied a descriptive comparison study by indicating that their purpose was to compare two groups, and this was reinforced with their first aim—to “compare physical, psychologic, and social variables in older adults with heart failure with those in healthy older adults” (Heo et al., 2007, p. 17). The design should match with the stated purpose and link to the planned analysis. For example, it is clear that one group is older adults with heart failure and they will be compared with a group of older adults who are healthy. The two groups will be compared on three types of variables (physical, psychologic, and social). However, the abstract also includes HRQOL as a variable. The second aim—to “determine the best model predicting HRQOL in each group from among the physical, psychologic, and social variables” (Heo et al., 2007, p. 17)—is actually a different study design. It is still a descriptive design rather than an intervention or experiment. However, the word “predictive” assumes a longitudinal design with predictor variables measured at an initial point in time and an outcome variable measured at a later point in time. The type of design is most accurately described as a longitudinal descriptive correlational study. From the way in which the second aim is written, the reader can expect to see two predictive models tested—one for the healthy group and one for the group with heart failure. If your design includes an intervention or treatment, your report needs to describe the treatment, including the protocol for implementing the treatment, training of people (interventionalists) to implement the protocol, and a discussion of the consistency of administration of the treatment (Santacroce, Maccarelli, & Grey, 2004). The reliable and competent implementation of an experimental treatment is referred to as intervention fidelity. As discussed in Chapter 14, intervention fidelity includes two core components: (1) adherence to the delivery of the prescribed treatment behaviors, session, or course and (2) competence of the researcher or interventionalist in delivering the intervention (Stein, Sargent, & Rafaels, 2007). Santacroce et al. (2004) and Stein et al. (2007) provide detailed directions to promote intervention fidelity in various quasi-experimental studies and clinical trials. Heo et al. (2007, p. 17) implemented a combined comparative descriptive and predictive design to accomplish the two aims of their study. A more complex study design, such as a randomized clinical trial, might be presented in a table or figure, such as the examples provided in Chapter 11. Most journals require that these more complex studies be depicted in a flow chart using the CONSORT guidelines (Bennett, 2006) as discussed in Chapter 20. This section of the research report should describe the sampling method, criteria for selecting the sample, sample size, and sample characteristics. When a clinical trial or experiment is involved, the report must also address the statistical power analysis used to determine how many subjects per group would be needed to find a statistically significant difference if significance is set at α ≤ 0.05 or another alpha level. If fewer subjects enroll or complete the study than what was indicated in the original power analysis, the difference may not be statistically significant even if the same group difference is clinically relevant. This is known as a Type 2 statistical error if the researchers conclude that there was no difference between the two groups when the same difference would be statistically significant if the sample had been larger (see Chapter 15). Details about subject recruitment, including refusal or acceptance rates, should be reported. The number of subjects completing the study should be provided if it differs from the initial sample size, and attrition or retention rate needs to be addressed. If your subjects were divided into groups (experimental and comparison or control groups), identify the method for assigning subjects to groups and the number of subjects in each group. The protection of subjects’ rights and the process of informed consent should be explicitly stated. In a published study, the setting is often described in one or two sentences, and agencies are not identified by name unless permission has been obtained. Researchers can present the sample characteristics in narrative format; however, most researchers present the characteristics of their sample in a table (see Chapter 8). Although some researchers report the subject characteristics in this section, these are often presented in the first part of the results section. Heo et al. (2007) used the heading “Sample and Setting” to introduce the following description of their sampling process. This section of the report describes the measurement methods, which is how variables were operationalized and measured in the study. Details about the measures or instruments used in the data collection process are crucial if nurses are to appraise critically and replicate a study. The details include the measure’s scaling and range of scores and the frequency with which the instrument was used; any reliability and validity information previously published on the instrument should also be provided. In addition, the report needs to include the instrument’s reliability in the current study and any further support of validity for the current study’s sample. If you have used physiological measures, be sure to address their accuracy, precision, selectivity, sensitivity, and sources of error (Pyrczak & Bruce, 2007). In a section titled “Measures,” Heo et al. (2007, pp. 17-19) described all of their measures in detail. Each variable was clearly identified, conceptually defined and linked to the framework, and operationally defined to indicate how it was measured. The conceptual and operational definitions (instruments used) were clearly presented in a table (Table 27-2). These researchers provided an excellent link between the framework and the methodology of their study. TABLE 27-2 SF-36, 36-item short-form health survey. From Heo, S., Moser, D. K., Lennie, T. A., Zambroski, C. H., & Chung, M. L. (2007). A comparison of health-related quality of life between older adults with heart failure and healthy older adults. Heart & Lung, 36(1), 18. The description of the data collection process in the research report details who collected the data, the procedure for collecting data, and the type and frequency of measurements obtained. In describing who collected the data, your report needs to specify the experience of the data collector and any training provided. If more than one person collected data, describe the precautions taken to ensure consistency and interrater reliability (Pyrczak & Bruce, 2007). Heo et al. (2007) detailed their data collection process in a section of their report titled “Procedure,” which is presented in the following excerpt. The data collection process was clear and concise, institutional review board approval was indicated, subjects’ informed consent was described, use of trained data collectors was addressed, and timing and setting were discussed. The results section reveals what was learned from the study and includes the results generated from your statistical analyses. The results section is best organized by the research objectives, questions, or hypotheses that are linked to the conceptual framework. Heo et al. (2007) organized their results by characteristics of the sample and the two research aims. Research results can be presented in narrative format and organized into figures and tables. Table 1 is typically the descriptive characteristics of the sample. Because Aim 1 was to compare the healthy group with the heart failure group, the reader would expect to see sample demographic and clinical characteristics described in two columns (healthy group and heart failure group samples). The reader would also expect to see the statistics showing any group differences in these characteristics. The presentation of results depends on the end product of the data analysis and your own preference and any journal instructions. Generally, what is presented in a table is not restated in the text of the narrative. When reporting results in a narrative format, the value of the calculated statistic (t, F, r, or χ2), the degrees of freedom (df), and probability (p value) should be included. When reporting any nonsignificant results, it is important to include the effect size and power level for that analysis so that readers would be able to evaluate the risk of a Type II error (see Chapter 15). Students often have difficulty putting all of these Greek-letter statistical findings back into words for the text of the results section. Pallant (2007) provides useful and specific examples of how to translate the Greek symbol results back into English for the text of your report. The Publication Manual of the American Psychological Association (American Psychological Association [APA], 2010) provides direction for how to present various statistical results in a research report. The format for reporting chi-square results is a symbol χ2 with degrees of freedom and sample size in parentheses followed by the χ2 statistic value and p value. For example, when APA format is required, a chi-square value should be presented in the following format in the text of a research report: χ2 (4, N = 90) = 11.14, p = 0.025. Statistical values need to be reported with two decimal digits of accuracy. Although a computer output of data may include results reported to several decimal places, this is unnecessary for the report. For example, reporting the χ2 value as 11.14 is sufficient even if the computer output says 11.13965 (APA, 2010). The p value should be reported as the exact value, but when the computer output says p = 0.0000, it should be reported as p < 0.001 because the computer calculates the value only out so far before it rounds off to zero. Heo et al. (2007) presented their results in narrative and table formats. Some of these results are represented in the next section as example tables. Because journals have space limitations, results are best depicted in tables and should not duplicate what is in the text. Figures and tables are used to present a large amount of detailed information concisely and clearly. Researchers use figures and tables to demonstrate relationships, document change over time, and reduce the number of words in the text of the report (APA, 2010; Saver, 2006). However, figures and tables are useful only if they are appropriate for the results you have generated and if they are well constructed (Saver, 2006). Table 27-3 provides guidelines for developing accurate and clear figures and tables for a research report. More extensive guidelines and examples for developing tables and figures for research reports can be found in the Publication Manual of the American Psychological Association (APA, 2010). For meta-analysis reports that synthesize the results of many studies, particular figures, called forest plots, are very important in the presentation of results (Floyd, Galvin, Roop, Oermann, & Nordstom, 2010). TABLE 27-3 Guidelines for Developing Tables and Figures in Research Reports Compiled from APA, 2010; Pallant, 2007; and Pyrczak & Bruce, 2007. Figures are diagrams or pictures that illustrate the results. Researchers often use computer programs to generate sophisticated black-and-white or color figures. Common figures included in nursing research reports are bar graphs and line graphs. Journals often require high-resolution images for reproduction. The APA manual (APA, 2010, p. 167) has a figure checklist for you to review when deciding whether or not to include a figure. Generally, figures require specific formatting and may have less detail than readers want, so potential authors should carefully check with the journal guidelines (Saver, 2006). Bar graphs typically have horizontal or vertical bars that represent the size or amount of the group or variable studied. The bar graph is also a means of comparing one group with another. Goyal, Gay, and Lee (2010) conducted a study to describe how socioeconomic status influences the risk of postpartum depressive symptoms in first-time mothers. As part of a larger study, the researchers asked women to complete a depression measure, the 20-item Center for Epidemiologic Studies–Depression [CES-D] scale, (see Chapter 17) during their third month of pregnancy and again at 1 month, 2 months, and 3 months postpartum. The researchers compared groups based on prenatal depression risk and presented their results in a vertical bar graph (see Figure 27-2). This figure indicates that the women with high prenatal risk scores (CES-D ≥16) were more likely to have high postpartum scores at all three time points. The text indicates that this was significant (χ2 [1] = 19.9 to 32.5; all p < 0.001). A line graph is developed by joining a series of points with a line and shows how a variable varies over time. In this type of graph, the horizontal scale (x-axis) is used to measure time, and the vertical scale (y-axis) is used to measure number or quantity. A line graph figure needs at least three data points over time on the horizontal axis to show a trend or pattern. However, complexity does not enhance the ability to convey the data in a meaningful way, so it is recommended that no more than 10 time points should be included on a single line graph, and there should be no more than four lines or groups per graph. Figure 27-3 is a line graph developed by Goyal et al. (2010, p. 100) to depict the pattern of depressive symptoms over time by contrasting two groups of childbearing women from their third trimester to their 3-month postpartum assessment. Figure 27-3 is well constructed because it includes four data points per line along the x-axis (mean depressive symptom score at four visits) and two lines representing the study groups (low income and high income) being examined for differences in depressive symptoms after the birth of their first infant. The third dashed line at the value of 16 on the y-axis is helpful for readers to orient the scores for the two groups in context to the score that indicates clinical depression. The discussion of this graph in the text indicated that the pattern of depressive symptoms over the four time points was different for the two groups (F [3192] = 2.76; p = 0.044), with the low-income group improving at 1 month and 2 months postpartum. The figures could be improved by having the sample sizes (n) for each group depicted within the figure or in the legend. Tables are used more frequently in research reports than figures and can be developed to present results from numerous statistical analyses without additional software programs. In tables, the results are presented in columns and rows so that the reader can review them easily. The sample tables included in this section present means ( Heo et al. (2007) presented the results of their study about HRQOL for older adults with and without heart failure in four tables; three are included in this chapter. Table 27-4 compares individual characteristics (demographic variables) and biological and physiological status of the two groups. This table includes means and standard deviations (SDs) for variables measured at the interval or ratio level (age, education in years, and number of comorbidities) and frequencies and percentages (%) for variables measured at the nominal level (sex, marital status, and living arrangements). The two groups were compared for differences on selected variables using t-test (t) (variables measured at interval or ratio level), Mann-Whitney U (Z) (variables measured at ordinal level), and chi-square (χ2) (variables measured at nominal level). Nonsignificant results (p > 0.05) between the two groups in regard to age, marital status, and living arrangements indicate the groups are comparable in these areas. It was expected that the older adults with heart failure would have significantly more comorbidities (p < 0.001) than the healthy adults; however, the significant differences for education (p < 0.001) and sex (p < 0.001) were unexpected. Researchers desire their groups to be comparable on demographic variables, so any differences found between the groups on study outcome variables of interest are less likely to be due to basic demographic differences. Any differences on baseline characteristics need to be controlled in the remaining statistical analyses. TABLE 27-4 M, Mean; SD, standard deviation. From Heo, S., Moser, D. K., Lennie, T. A., Zambroski, C. H., & Chung, M. L. (2007). A comparison of health-related quality of life between older adults with heart failure and healthy older adults. Heart & Lung, 36(1), 19. Heo et al. (2007) conducted a Mann-Whitney U (Z) analysis to address aim 1 to determine differences in two groups for HRQOL, health perception, functional status, physical status, emotional symptoms status (anxiety and depression), and social support (Table 27-5). Older adults with heart failure reported significantly (p < 0.001) poorer HRQOL, health perceptions, functional status, physical symptoms status, anxiety, and depression than healthy older adults. Only social support did not significantly differ between the two groups (p = 0.66). The results indicate the increased needs of individuals with heart failure and the need to develop evidence-based interventions to manage these needs. TABLE 27-5 LHFQ, Minnesota Living with Heart Failure Questionnaire; SD, standard deviation. *Higher scores indicate poor status. †Higher scores mean better status. From Heo, S., Moser, D. K., Lennie, T. A., Zambroski, C. H., & Chung, M. L. (2007). A comparison of health-related quality of life between older adults with heart failure and healthy older adults. Heart & Lung, 36(1), 21. Tables are used to identify correlations among variables, and often the table presents a correlation matrix generated from the data analysis. The correlation matrix indicates the correlation values (coefficients) obtained when examining the relationships between variables, two variables at a time (bivariate correlations). The table also includes information about the significance (p value) of each correlation coefficient, but the significance will be sample-size dependent. Borge, Wahl, and Moum (2010) conducted a study entitled, “Association of Breathlessness with Multiple Symptoms in Chronic Obstructive Pulmonary Disease.” One of the questions in their study was “What are the relationships between … multiple symptoms (breathlessness, depression, anxiety, sleeping difficulties, fatigue and pain)?” (Borge et al., 2010, p. 2690). The researchers presented their results in a correlation matrix, shown in Table 27-6. The six symptom variables are listed horizontally across the top of the table and vertically down the left side of the table. The relationship of Breathlessness with itself (Breathlessness) is always a perfect positive relationship of 1.00. Breathlessness is correlated with Fatigue (r = 0.51***). The asterisks (***) indicate that this correlation is significant at p ≤ 0.001 (some journals would require the exact p value). This table identifies the correlation coefficients (Pearson r value) between the variables, and the significance of each of these coefficients. Borge et al. (2010) described this table in the text of their article in the following way. TABLE 27-6 Correlation Matrix between Symptoms of Patients with Chronic Obstructive Pulmonary Disease (N = 154) **Statistically significant at 0.01 level. ***Statistically significant at 0.001 level. From Borge, C. R., Wahl, A. K., & Moum, T. (2010). Association of breathlessness with multiple symptoms in chronic obstructive pulmonary disease. Journal of Advanced Nursing, 66(12), 2695.
Disseminating Research Findings
 http://evolve.elsevier.com/Grove/practice/
Content of a Research Report
Quantitative Research Report
Introduction
Methods
Results
Discussion
References
Introduction
Review of Literature
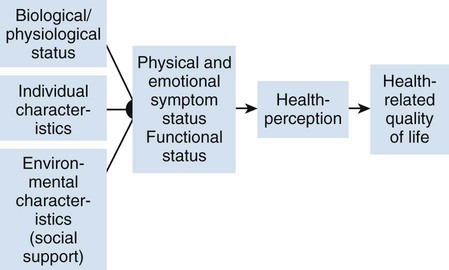
Framework
Methods
Design
Sample and Setting
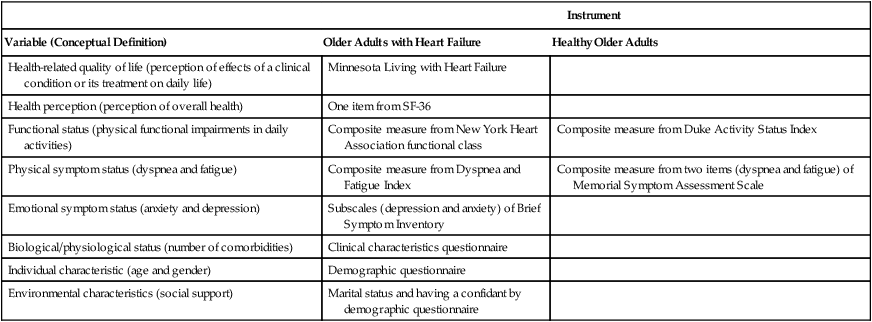
Measures
Instrument
Variable (Conceptual Definition)
Older Adults with Heart Failure
Healthy Older Adults
Health-related quality of life (perception of effects of a clinical condition or its treatment on daily life)
Minnesota Living with Heart Failure
Health perception (perception of overall health)
One item from SF-36
Functional status (physical functional impairments in daily activities)
Composite measure from New York Heart Association functional class
Composite measure from Duke Activity Status Index
Physical symptom status (dyspnea and fatigue)
Composite measure from Dyspnea and Fatigue Index
Composite measure from two items (dyspnea and fatigue) of Memorial Symptom Assessment Scale
Emotional symptom status (anxiety and depression)
Subscales (depression and anxiety) of Brief Symptom Inventory
Biological/physiological status (number of comorbidities)
Clinical characteristics questionnaire
Individual characteristic (age and gender)
Demographic questionnaire
Environmental characteristics (social support)
Marital status and having a confidant by demographic questionnaire
Data Collection Process and Procedures
Results
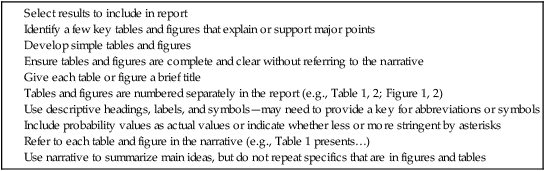
Presentation of Results in Figures and Tables
Figures
Tables
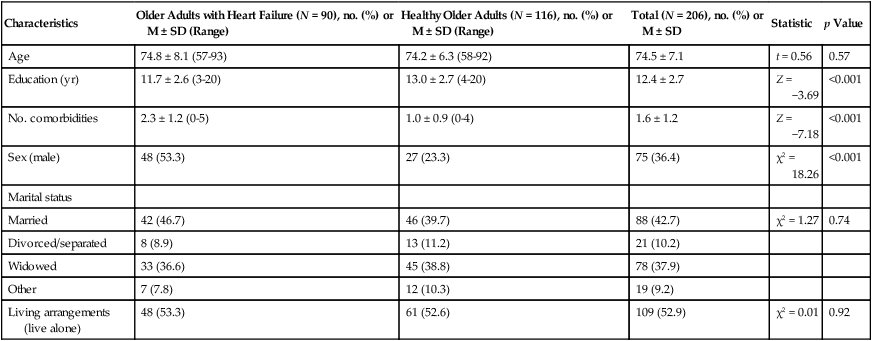
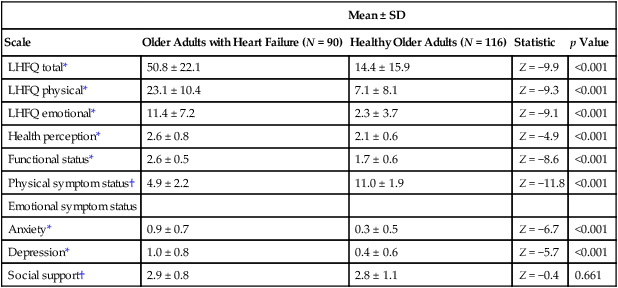
 ), standard deviations (SD), t values, chi-square (χ2) values, Mann-Whitney U values (Z), correlations (r), and regression analysis (R2) results. Means and standard deviations of the study variables should be included in the published study because of their importance to future research. A variable’s mean and standard deviation are essential for (1) providing a basis for comparison across studies, (2) calculating the effect size to determine sample size for future studies, and (3) conducting future meta-analyses (Conn & Rantz, 2003; Sandelowski, 2008). The sample size for each column should be included if the N varies from the total sample.
Characteristics
Older Adults with Heart Failure (N = 90), no. (%) or M ± SD (Range)
Healthy Older Adults (N = 116), no. (%) or M ± SD (Range)
Total (N = 206), no. (%) or M ± SD
Statistic
p Value
Age
74.8 ± 8.1 (57-93)
74.2 ± 6.3 (58-92)
74.5 ± 7.1
t = 0.56
0.57
Education (yr)
11.7 ± 2.6 (3-20)
13.0 ± 2.7 (4-20)
12.4 ± 2.7
Z = −3.69
<0.001
No. comorbidities
2.3 ± 1.2 (0-5)
1.0 ± 0.9 (0-4)
1.6 ± 1.2
Z = −7.18
<0.001
Sex (male)
48 (53.3)
27 (23.3)
75 (36.4)
χ2 = 18.26
<0.001
Marital status
Married
42 (46.7)
46 (39.7)
88 (42.7)
χ2 = 1.27
0.74
Divorced/separated
8 (8.9)
13 (11.2)
21 (10.2)
Widowed
33 (36.6)
45 (38.8)
78 (37.9)
Other
7 (7.8)
12 (10.3)
19 (9.2)
Living arrangements (live alone)
48 (53.3)
61 (52.6)
109 (52.9)
χ2 = 0.01
0.92
Mean ± SD
Scale
Older Adults with Heart Failure (N = 90)
Healthy Older Adults (N = 116)
Statistic
p Value
LHFQ total*
50.8 ± 22.1
14.4 ± 15.9
Z = −9.9
<0.001
LHFQ physical*
23.1 ± 10.4
7.1 ± 8.1
Z = −9.3
<0.001
LHFQ emotional*
11.4 ± 7.2
2.3 ± 3.7
Z = −9.1
<0.001
Health perception*
2.6 ± 0.8
2.1 ± 0.6
Z = −4.9
<0.001
Functional status*
2.6 ± 0.5
1.7 ± 0.6
Z = −8.6
<0.001
Physical symptom status†
4.9 ± 2.2
11.0 ± 1.9
Z = −11.8
<0.001
Emotional symptom status
Anxiety*
0.9 ± 0.7
0.3 ± 0.5
Z = −6.7
<0.001
Depression*
1.0 ± 0.8
0.4 ± 0.6
Z = −5.7
<0.001
Social support†
2.9 ± 0.8
2.8 ± 1.1
Z = −0.4
0.661
Breathlessness
Fatigue
Anxiety
Depression
Sleeping difficulties
Pain intensity
Breathlessness
1
Fatigue
0.51***
1
Anxiety
0.34***
0.45***
1
Depression
0.38***
0.53***
0.65***
1
Sleeping difficulties
0.42***
0.58***
0.56***
0.50***
1
Pain intensity
0.26**
0.48***
0.41***
0.32***
0.51***
1
![]()
Stay updated, free articles. Join our Telegram channel

Full access? Get Clinical Tree


Disseminating Research Findings
Get Clinical Tree app for offline access