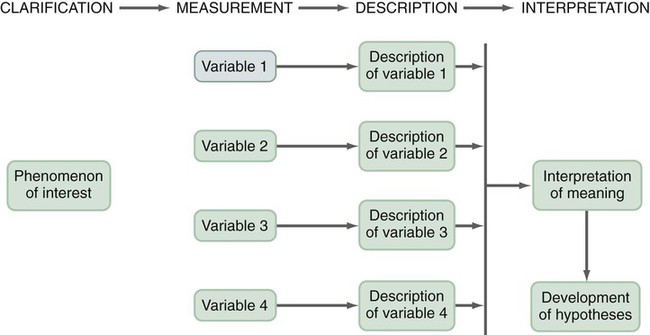
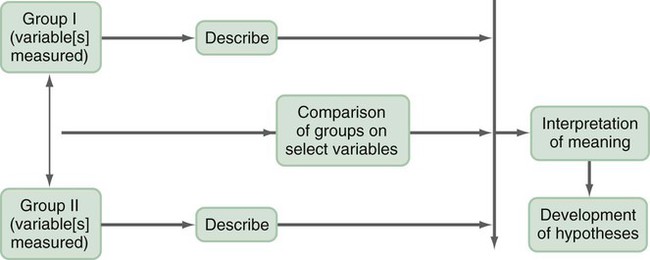
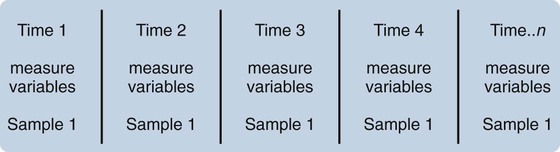
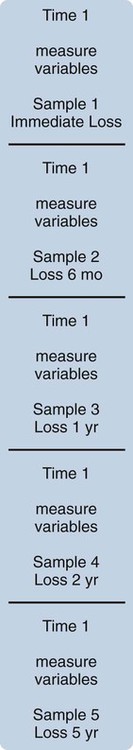
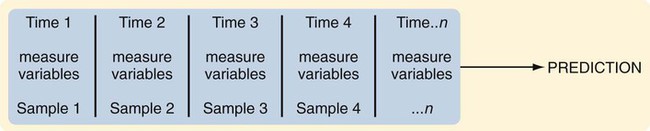
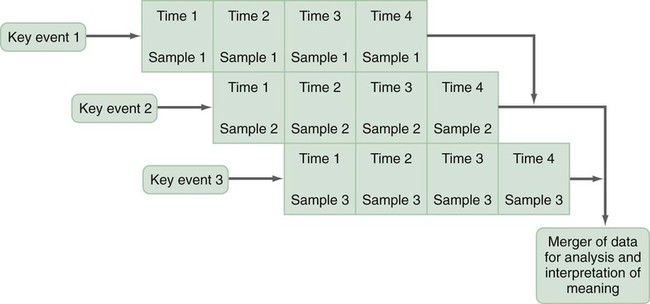
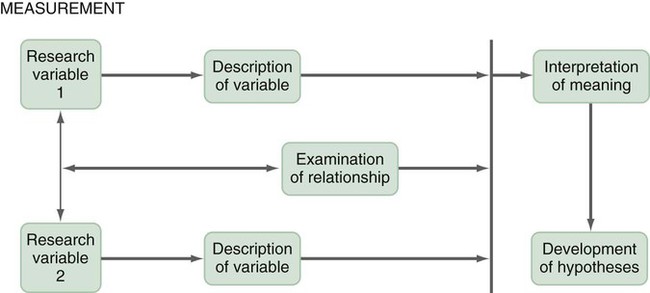
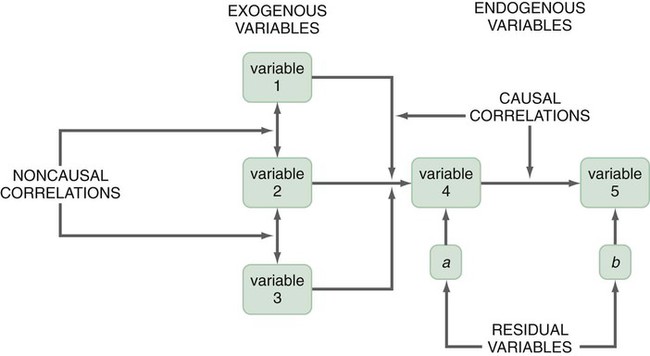
A design is the blueprint for conducting a study that maximizes control over factors that could interfere with the validity of the findings. A research design gives you greater control and thus improves the validity of your study. To select an appropriate research design, you will need to integrate many elements. Chapter 10 began with questions that will help you select a design or identify by name the design of a study you are critically appraising. Identifying the design of a published study is not always easy, because many published studies do not identify the design used. Determining the design may require you to put together bits of information from various parts of the research report. This chapter describes the designs most commonly used in nursing research, using the study categories described in Chapter 3: descriptive, correlational, quasi-experimental, and experimental. Descriptive and correlational designs examine variables in natural environments, such as home, and do not include researcher-designed treatments or interventions. Quasi-experimental and experimental designs examine the effects of an intervention by comparing differences between groups that have received the intervention and those that have not received the intervention. As you review each design, note the threats to validity that are controlled by the design, keeping in mind that uncontrolled threats in the design you choose may weaken the validity of your study. Box 11-1 lists the designs discussed in this chapter. Each of the designs is briefly described, and a model is provided so you can see the different elements of the designs. After the descriptions of the designs, we provide a series of decision trees or algorithms that will help you to select the appropriate design for your study or to identify the design used in a published study. Investigators have always developed designs to meet emerging research needs. In the 1930s, Sir Ronald A. Fisher (1935) developed the first experimental designs that were published in a book titled The Design of Experiments. However, most work on design has been conducted since the 1970s, and the designs of the last 20 years have become much more sophisticated and varied. There is no universal standard for categorizing designs. Names of designs change as various writers discuss them. Researchers sometimes merge elements of several designs to meet the research needs of a particular study. From these developments, new designs sometimes emerge. Originally, only experimental designs were considered of value. In addition, many believed that the only setting in which an experiment can be conducted is a laboratory, where stricter controls can be maintained than in a field or natural setting. This approach is appropriate for the natural sciences but not for the social sciences. From the social sciences have emerged additional quantitative designs (descriptive, correlational, and quasi-experimental), methodological designs, and qualitative designs (Cook & Campbell, 1979; Creswell, 2009; Fawcett & Garity, 2009). The epidemiology, public health, and community health fields have presented time-series designs, health promotion designs, and prevention designs. Innovative design strategies are beginning to appear within nursing research. One example is the intervention research design described in Chapter 14. Developing designs to study the outcomes of nursing actions is also important. The emerging field of outcomes research in nursing is described in Chapter 13. Nurse researchers must see themselves as credible scientists before they will dare to develop new design strategies to explore little-understood aspects of nursing. To develop a new design, the researcher must carefully consider possible threats to validity and ways to diminish them. Nurses must also be willing to risk the temporary failures that are always inherent in the development of something new. Descriptive study designs (see Box 11-1) are crafted to gain more information about characteristics within a particular field of study. Their purpose is to provide a picture of situations as they naturally happen. In many aspects of nursing, a phenomenon must be clearly delineated before prediction or causality can be examined. A descriptive design may be used to develop theory, identify problems with current practice, justify current practice, make judgments, or determine what others in similar situations are doing. Variables are not manipulated, and there is no treatment or intervention. Dependent and independent variables are not appropriate for use within a descriptive design, because the design involves no attempt to establish causality. Descriptive designs vary in levels of complexity. Some contain only two variables, whereas others may have multiple variables. The relationships among variables present an overall picture of the phenomenon being examined, but examination of types and degrees of relationships is not the primary purpose of a descriptive study. Protection against bias (or threat to the validity) in a descriptive design is achieved through (1) links between conceptual and operational definitions of variables (Fawcett & Garity, 2009); (2) sample selection and size (Aberson, 2010; Thompson, 2002); (3) the use of valid and reliable instruments (Waltz, Strickland, & Lenz, 2010) or accurate and precise biophysical measures (Ryan-Wenger, 2010); and (4) data collection procedures that achieve some environmental control (Bialocerkowski, Klupp, & Bragge, 2010; Creswell, 2009; DeVon et al., 2007; Kerlinger & Lee, 2000). Figure 11-1 presents the commonly used descriptive study design that examines characteristics of a single sample. The design identifies a phenomenon of interest and the variables within the phenomenon, develops conceptual and operational definitions of the variables, and describes the variables. The description of the variables leads to an interpretation of the theoretical meaning of the findings and provides knowledge of the variables and the study population that can be used for future research in the area. Most studies contain descriptive components; however, the methodology of some studies is confined to the typical descriptive design. This is a critically important design for acquiring knowledge in an area in which little research has been conducted. Peterson, Schwab, van Oostrom, Gravenstein, and Caruso (2010) implemented a descriptive study design to examine the effects of various patient positions on the development of pressure in common areas such as the sacrum and hips. Minimizing skin–support surface interface pressure is important in preventing and controlling pressure ulcers, but the effects of standard patient repositioning on skin interface pressure has not been clearly described. The study design and key results are presented in the abstract, which is reprinted in full: A descriptive research design is appropriate when the current practice (that is, routine turning of patients) does not seem sufficient to alleviate the problem (risk for pressure ulcers). To discover why traditional nursing interventions have failed to eliminate the pressure ulcers on three at-risk areas of the body, Peterson et al. (2010) decided to explore the currently used techniques (pillows versus wedges) and objectively measure and describe the pressures that participants experienced using digital pressure sensors. This study involved no treatment and had one study group of participants who were measured for pressures in the at-risk areas. Some descriptive studies use questionnaires (surveys) to describe an identified area of concern. For example, Strand and Lindgren (2010) used a descriptive design to study nurses’ knowledge, attitude, and barriers regarding preventing pressure ulcers in patients in intensive care units (ICUs). The following excerpt from the abstract describes the design of their study: Some descriptive studies obtain data from retrospective chart review. For example, Kline and Edwards (2007) conducted a chart review to describe the effectiveness of intrapartum intravenous (IV) insulin on antepartum and intrapartum control of the mother’s diabetes and on the occurrence and severity of hypoglycemia in the neonate. Researchers measured and described the variables of intrapartum IV insulin, antepartum diabetic control, intrapartum diabetic control, and hypoglycemia in the neonate. It is not uncommon for researchers using a descriptive design to combine quantitative descriptive methods and qualitative methods (mixed methods) (Creswell, 2009). Chapter 10 includes a discussion of different types of mixed-methods approaches. To use this strategy, consult with a researcher experienced in using qualitative methods or include this person as a research partner to appropriately collect, analyze, and interpret qualitative data. Meghani and Keane (2007) used quantitative and qualitative methods in their study of preference for analgesic treatment in African-American cancer patients. The investigators used demographic data, the Brief Pain Inventory, and in-depth semi-structured interviews. Their sample of 35 patients was taken from three outpatient oncology clinics. Their study identified the major sources of anxiety described by this sample. The goal of this study was to improve our understanding of patients’ needs and assist in the development of specific interventions that might alleviate their problems. The comparative descriptive design (Figure 11-2) examines and describes differences in variables in two or more groups that occur naturally in the setting. Descriptive statistics and inferential statistical analyses may be used to examine differences between or among groups. Commonly, the results obtained from these analyses are not generalized to a population because the description is for a very specific sample and would not necessarily apply to a larger population. An example of this design is the study by Cramer, Chen, Roberts, and Clute (2007) of the social and economic impact of community-based prenatal care. The abstract for this study, which is reprinted in full, describes the focus, design, and major findings: Using a comparative descriptive design, Cramer and colleagues (2007) described the variables incidence of case management, home visits, screening, referral, transportation, and health education, as well as the outcomes low birth weight, infant mortality, adequacy of care, trimester of care, and costs of care in three groups (OHS birth mothers, non-OHS birth mothers, and Douglas County birth mothers) yearly for 3 years. The results of the study were comparisons across the 3 years and among the three groups. Time-dimensional designs were developed within the discipline of epidemiology, a field that studies the occurrence and distribution of disease among populations. These designs examine trends over time, growth, or sequences and patterns of change. The dimension of time, then, becomes an important factor. Within the field of epidemiology, the samples in time-dimensional studies are called cohorts. Originally, cohorts were age categories; however, the concept has been expanded to apply to groups distinguished by many other variables. Other means of classifying populations that have relevance in relation to time are time of diagnosis, point of entry into a treatment protocol, point of entry into a new lifestyle, and age at which the subject started smoking. An understanding of temporal sequencing is an important prerequisite to examining causality between variables. Thus, the results of these designs lead to description of trends, processes, patterns, and changes over time as well as the development of hypotheses, and are often forerunners of experimental designs (Fawcett & Garity, 2009). Epidemiological studies that use time-dimensional designs determine the risk factors or causal factors of illness states. Cause determined in this manner is called inferred causality (Kerlinger & Lee, 2000). These studies also examine trends, patterns, and changes over time. The best-known studies in this area are those on smoking and cancer. Because of the strength of studies that have undergone multiple repetitions, the causal link is strong. The strategy is not as powerful as experimental designs in supporting causality; however, in this situation, as in many nursing contexts, one can never ethically conduct a true experiment. A true experiment requires that there be an experimental group (who would not smoke) and a control group (who smoke). The participants must be randomly assigned to one of these groups. Therefore, without being provided a choice, some individuals would be required to smoke and others would be required to abstain from smoking over a long period. The Framingham study is the best-known example of a prospective study (U.S. Department of Health and Human Services, 1968). In this study, researchers monitored members of a community for 20 years and examined variables such as dietary patterns, exercise, weight, and blood lipid levels. As the subjects experienced illnesses, such as heart disease, hypertension, and lung disease, their illnesses could be related to previously identified variables. Longitudinal designs examine changes in the same subjects over time. They are sometimes called panel designs (Figure 11-3). Longitudinal designs are expensive and require a long period of researcher and subject commitment. The area to be studied, the variables, and their measurement must be clearly identified before data collection begins. Measurement must be carefully planned and implemented because the measures will be used repeatedly over time. If children are being studied, the measures must be valid for all the ages being studied. To use this design, researchers must be familiar with how the construct being measured changes and its patterns and trends over time. In addition, they need to provide a clear rationale for the points of time they have selected for measurement. There is often a bias in selection of subjects because of the requirement for a long-term commitment. Individuals participating in a study conducted over long periods might differ in some important ways from the target population. In addition, attrition or loss of subjects from the study can be high and can decrease the validity of findings. The sample size calculated with power analysis needs to take into consideration the potential attrition rate when determining the final number of subjects to recruit. As a researcher, you must invest considerable energy in developing effective strategies to maintain the sample (see Chapter 15). The period during which subjects will be recruited into the study must be carefully planned, and a timeline depicting data collection points for each subject must be developed to enable planning for the numbers and availability of data collectors. If this issue is not carefully thought out, data collectors may be confronted with the need to recruit new subjects while they are attempting to collect data scheduled for subjects recruited earlier. You must also decide whether you will use a single data collector to obtain all data from a particular subject or whether you will use a different data collector at each point to ensure that data are collected blindly. Because of the large volumes of data acquired in a longitudinal study, you must give careful attention to strategies for managing the data. The repetition of measures requires that data analysis be carefully thought through. Analyses commonly used are repeated measures analyses of variance, multivariate analyses of variance (MANOVA), regression analysis, cluster analysis, and time-series analysis (see Chapters 24 and 25) (Corty, 2007; Munro, 2005). Lee, Chaboyer, and Wallis (2010) conducted a descriptive study using a longitudinal cohort design. This study was conducted to describe the perceptions and physical manifestations of injury and illness of patients with traumatic injury and to examine the changes they experienced over time. The following abstract from the study demonstrates the background, longitudinal design, key results, conclusions, and implications for practice: Cross-sectional designs examine groups of subjects in various stages of development, trends, patterns, and changes simultaneously with the intent to describe changes in the phenomenon across stages (see Figure 11-4). The assumption is that the stages are part of a process that will progress over time. Selecting subjects at various points in the process provides important information about the totality of the process, even though the same subjects are not monitored through the entire process. The processes of development selected for the study might be related to age, position in an educational system, growth pattern, or stages of maturation or personal growth (if they could be clearly enough defined that criteria could be developed for inclusion within differentiated groups or disease stages). Subjects are then categorized by group, and data on the selected variables are collected at a single point in time. For example, suppose you wish to study grief reactions at various periods after the death of a spouse. With a cross-sectional design, you could study a group of individuals whose spouses had died 1 week ago, another group composed of individuals whose losses occurred 6 months ago, and other groups whose losses occurred 1 year, 2 years, and 5 years ago (see Figure 11-4). You could study all of these groups during one period of time, but you could describe a pattern of grief reactions over a 5-year period. The design is not as strong as the longitudinal design, in which the same participants continue in the study over time, thus eliminating some variance, but it allows some understanding of the phenomenon over time when time allowed for the study is limited. Sidani et al. (2007) conducted a cross-sectional study titled “Outcomes of Nurse Practitioners in Acute Care: An Exploration.” The following abstract describes the design of their study: Trend designs examine changes in the general population in relation to a particular phenomenon (see Figure 11-5). The researchers select different samples of subjects from the same population at preset intervals of time, and at each selected time, they collect data from that particular sample. Researchers need to be able to justify generalizing from the samples to the population under study. Analysis involves strategies to predict future trends by examining past trends. Harris, Gordon-Larsen, Chantala, and Udry (2006, p. 74) used a trend design to describe “longitudinal trends in race/ethnic disparities in 20 leading health indicators from Healthy People 2010 [U.S. Department of Health and Human Services, 2000] across multiple domains from adolescence to young adulthood.” These researchers examined the study trends in an ethnically diverse, national database, and their study design is described in the following excerpt. Harris et al. (2006) found the trend design to be an effective way to examine health indicators of Americans over time. They noted for 15 of 20 indicators that the health risk increased and access to health care decreased from teen to adult years for most Americans. The health indicators varied over time by gender and race/ethnicity, causing the health disparities to fluctuate over time. A merger of the cross-sectional or longitudinal and trend designs, the event-partitioning design, is used in some cases to enlarge sample size and to avoid the effects of history on the validity of findings. Cook and Campbell (1979) referred to these as cohort designs with treatment partitioning. Figure 11-6 shows a model of the cross-sectional study design with treatment partitioning, and Figure 11-7 provides the model of a longitudinal design with treatment partitioning. The term treatment is used loosely here to mean a key event that is thought to lead to change. In a descriptive study, the researcher would not cause or manipulate the key event but rather would clearly define it so that when it occurred naturally, it would be recognized. Sutton’s (2007) dissertation described a study to examine the relationship of preoperative education for the aging adult and anxiety. Most individuals experience anxiety in anticipation of surgery, and they expect education and support to help alleviate their anxiety prior to entering the operating room. Because a growing number of surgical procedures are being conducted on an outpatient basis (day surgery), there is limited time for healthcare personnel to provide psychological preparation of patients for the perioperative process. Sutton used an event-partitioning design and correlational analysis to examine the relationship between education and the state anxiety experienced by aging adults in the preoperative setting. Quantitative data were collected using the Visual Analog Scale (VAS) to measure state anxiety in a pre-test and post-test format, with treatment consisting of a scripted preoperative educational presentation. Patients scheduled for general anesthesia for a surgical procedure in two acute care facilities in southern West Virginia were asked to participate in this study over a 4-week time frame. The sample included 52 pre-surgical patients, ages 65 to 94 years, who were asked to participate in the study. Participants were asked to score their state anxiety on the VAS prior to the scripted educational presentation to establish a baseline anxiety level. State anxiety is the emotion a person experiences in a particular situation, versus trait anxiety, which is the innate anxiety of a person. Upon completion of this presentation, the participants were given an opportunity to ask questions and receive answers. They were then asked to indicate their state anxiety on the VAS. The study results indicated that 75% of the study participants reported a decrease in their state anxiety levels following the preoperative educational presentation. This intervention requires further testing using a quasi-experimental study design but has the potential to reduce state anxiety in individuals experiencing day surgery (Sutton, 2007). Case studies were commonly used in nursing research in the 1970s. Their use then declined, but they are beginning to appear in the literature more frequently today. Well-designed case studies are good sources of descriptive information and can be used as evidence for or against theories. Case studies can use a mixed-methods approach, incorporating both quantitative and qualitative methods (Creswell, 2009; Fawcett & Garity, 2009). Sterling and McNally (1992) recommended single-subject case studies for examining process-based nursing practice. This strategy allows the researcher to investigate daily observations and interventions that are a common aspect of nursing practice. Case studies also can demonstrate the effectiveness of specific therapeutic techniques. In fact, by reporting a case study, the researcher introduces the technique to other practitioners. The case study design also has potential for revealing important findings that can generate new hypotheses for testing. Thus, the case study can lead to the design of large sample studies to examine factors identified through the case study. For example, Sprague and Chang (2011) used a single subject case study design to examine the effect of acupuncture on the treatment of chronic pain. Their study abstract identifies the key elements of their study: Sprague and Chang (2011) noted that this patient had dramatic improvements in depression, disability, and pain scores over the 6 months of the study. Thus, this case study justifies conducting further clinical studies to determine the effectiveness of acupuncture in the management of patients with CRPS. They recommended conducting studies with larger samples and randomized controlled treatment designs. How you design a case study depends on the circumstances of the case but usually includes an element of time. History and previous behavior patterns are usually explored in detail. As the case study proceeds, you may become aware of components important to the phenomenon being examined that were not originally built into the study. A case study is likely to have both quantitative and qualitative elements; and if the study incorporates both of these components, the study design must clearly present this fact (Creswell, 2009). Methods used to analyze and interpret qualitative data need to be carefully planned. Consultation with a qualitative researcher can strengthen the study. Large volumes of data are generally obtained during a case study. Organizing the findings of a case study into a coherent whole is a difficult but critical component of the study (Fawcett & Garity, 2009). Generalizing study findings in the statistical sense is not appropriate; however, generalizing the findings to theory is appropriate and important (Crombie & Davies, 1996; Gray, 1998; Sandelowski, 1996). The term survey is used in two ways within scientific thought. It is used in a broad sense to mean any descriptive or correlational study; in this sense, survey tends to mean nonexperimental (Kerlinger & Lee, 2000). In a narrower sense, the term is used to describe a data collection technique in which the researcher uses questionnaires (collected by email, by mail, or in person) or personal interviews to gather data about an identified population. Correlational study designs examine relationships among variables. The examination can occur at several levels of the independent variable. The researcher can seek to describe a relationship, predict relationships among variables, or test the relationships proposed by a theoretical proposition or a model. In any correlational study, a representative sample must be selected for the study. That sample reflects the full range of values possible on the variables being measured. Thus, large samples are required. In correlational designs, a large variance in the variable values is necessary to determine the existence of a relationship. Therefore, correlational designs are unlike experimental designs, in which variance in variable scores is controlled by controlling such design elements as the study setting, sampling criteria, and sampling method (Kerlinger & Lee, 2000). Neophyte researchers tend to make two serious errors with correlational studies. First, they often attempt to establish causality by correlation, reasoning that if two variables are related, one must cause the other. Second, they confuse studies in which differences are examined with studies in which relationships are examined. Although the existence of a difference assumes the existence of a relationship, the design and statistical analysis of studies examining differences are not the same as those of studies examining relationships. If your study examines two or more groups in terms of one or more variables, then you are exploring differences between or among groups as reflected in scores on the identified variables. If your study examines a single group in terms of two or more variables, then you are exploring relationships between or among variables. In a correlational study, the relationship examined is between or among two or more research variables within an identified situation. Thus, the sample is not separated into groups. Analyses examine variable values in the entire sample. In a correlational design, data from the entire sample are analyzed as a single group (Grove, 2007; Kerlinger & Lee, 2000). A descriptive correlational design examines the relationships that exist in a situation. Using this design facilitates the identification of many interrelationships in a situation in a short time. Although the descriptive design discussed earlier may reveal relationships among variables, the descriptive correlational design focuses specifically on relationships among study variables. Descriptive correlational studies may lead to hypotheses for later studies. Figure 11-8 provides a model of a typical descriptive correlational design for examining a relationship between two research variables. This design can be expanded to include examination of relationships among several study variables. A descriptive correlational study may examine variables in a situation that has already occurred or is currently occurring. No attempt is made to control or manipulate the situation. As with descriptive studies, variables must be clearly identified and defined. An example of a descriptive correlational design is the study by Bailey, Sabbagh, Loiselle, Boileau, and McVey (2010, p. 114) titled “Supporting families in the ICU: A descriptive correlational study of informational support, anxiety, and satisfaction with care.” The researchers conducted this study to describe family members’ perceptions of informational support, anxiety, and satisfaction with care and to examine the relationships among these variables. The design for this study is described in the following excerpt from its abstract: By implementing a descriptive, correlational research design, Bailey et al. (2010) were able to describe their study variables and determine relationships among them. The ultimate objective of the researchers was to further refine a local informational support initiative for families with members in the intensive care unit. Thus, this research provided the basis for development of an intervention that might be tested in future quasi-experimental or experimental studies. This study had a descriptive correlational design, as evidenced by the single study group, the absence of treatment, and the use of descriptive and correlational statistical techniques to analyze study data. The study variables informational support, anxiety, and satisfaction with care were described with means, standard deviations, and ranges (see Chapter 22). The relationships among these three variables were determined using Pearson’s product moment correlational coefficient (see Chapter 23). The aim of a predictive design is to predict the level of the dependent variable from the independent variables. Figure 11-9 is a model of a predictive design with two independent variables used to predict the dependent variable. Independent variables most effective in prediction are highly correlated with the dependent variable but not highly correlated with other independent variables used in the study. Predictive designs require you to develop a theory-based mathematical hypothesis proposing the independent variables that are expected to predict the dependent variable effectively. You can then test the hypothesis using regression analysis (see Chapter 24) (Corty, 2007; Munro, 2005). Predictive studies are also used to establish the predictive validity of measurement scales. Mancuso (2010) conducted a correlational study with a cross-sectional predictive correlational design to examine the impact of health literacy and patient trust on glycemic control in diabetic adults. The independent variables of patient trust, health literacy, knowledge of diabetes, performance of self-care activities, and depression were used to predict the dependent variable of glycosylated hemoglobin concentration (HbA1c). Regression analysis was conducted to determine how effective the independent variables were in predicting the dependent variable of HbAlc. The following except from the abstract describes the study design, results, and conclusions: Mancuso (2010) reported that patient trust and depression were important factors that significantly predicted HbA1c (R2 = 0.320; R2adj = 0.285; F(5, 96) = 9.047; p < 0.05). However, knowledge of diabetes, health literacy, and self-care activities was not a significant predictor of glycemic control. She recommended further research examining depression and patient trust as predictors of glycemic control and additional studies to explore other influences on or barriers to glycemic control. Mancuso’s implementation of a predictive correlational design and conduct of regression analysis were appropriate to address the study purpose and research questions. Some studies are designed specifically to test the accuracy of a hypothesized causal model. The model-testing design requires that all variables relevant to the model be measured. A large, heterogeneous sample is required. All the paths expressing relationships between concepts are identified, and a conceptual map is developed (see Figure 11-10). The analysis determines whether or not the data are consistent with the model. For some studies, you might set aside data from half of the subjects and not include them in the initial path analysis. You might use these data from the second half of the subjects to test the fit of the paths defined by the initial analysis. Variables are classified into three categories: exogenous variables, endogenous variables, and residual variables. Exogenous variables are within the theoretical model but are caused by factors outside this model. Endogenous variables are those whose variation is explained within the theoretical model. Exogenous variables influence the variation of endogenous variables. Residual variables indicate the effect of unmeasured variables not included in the model. These variables explain some of the variance found in the data but not the variance within the model (Mason-Hawkes & Holm, 1989; Norris, 2005a). In Figure 11-10, the illustration of a model-testing design, paths are drawn to demonstrate directions of cause and effect. The arrows (paths) from the exogenous variables 1, 2, and 3 lead to the endogenous variable 4, indicating that variable 4 is theoretically proposed to be caused by variables 1, 2, and 3. The arrow (path) from endogenous variable 4 to endogenous variable 5 indicates that variable 4 theoretically causes variable 5. To measure exogenous and endogenous variables, you would collect data from the subjects and analyze the accuracy of the proposed paths. Historically, these analysis procedures were performed with a series of regression analyses. Researchers now conduct statistical procedures that have been developed specifically for path analysis using the computer programs LISREL and EQS (Norris, 2005a). Structural equation modeling is a commonly used statistical procedure (Norris, 2005b). Path coefficients are calculated that indicate the effect that one variable has on another. The amount of variance explained by the model, as well as the fit between the path coefficients and the theoretical model, indicates the accuracy of the theory. Variance that is not accounted for in the statistical analysis is attributed to residual variables (variables a and b) not included in the analyses (Mason-Hawkes & Holm, 1989; Norris, 2005a). An example of this design is the Cummings, Estabrooks, Midodzi, Wallin, and Hayduk (2007) study testing a model of the influence of organizational characteristics and context on research utilization in nursing. The following study abstract identifies the study purpose, design, results, and conclusions: In quasi-experimental and experimental studies, an intervention (or protocol) is developed that is expected to result in differences in posttest measures of the treatment and control or comparison groups. This intervention may be physiological, psychosocial, educational, or a combination of these and should be designed to maximize the differences between the groups. Thus, it should be the best intervention possible in the circumstances of the study and should be expected to improve the outcomes of the experimental group (Egan, Snyder, & Burns, 1992; Forbes, 2009; Santacroce, Maccarelli, & Grey, 2004). Over the last 5 years, the nursing literature has included a growing number of publications focused on the methodology for designing interventions for nursing studies (Morrison et al., 2009; Wyatt, Sikorskii, Rahbar, Victorson, & Adams, 2010; Yamada, Stevens, Sidani, Watt-Watson, & Silva, 2010). In addition, descriptions of nursing interventions in published studies have more detail and specificity but still not at the level given to describing measurement instruments (Fawcett & Garity, 2009; Waltz et al., 2010). Thus, nurse researchers provide detailed information about measurement but often do not provide sufficient detail to allow a nurse to implement a nursing intervention as it was used in a published nursing study. To some extent, this situation may reflect the state of knowledge in the nursing field regarding the provision of nursing interventions in clinical practice. Many clinical nursing interventions are not well defined; thus, each nurse may use her or his own terminology to describe a particular intervention. In addition, an intervention tends to be applied differently in each case by a single nurse and even less consistently by different nurses. However, the quality of nursing interventions has been greatly enhanced with the development of the Nursing Interventions Classification by a team of nurses at the University of Iowa. The Nursing Interventions Classification (NIC) is a standardized language used to describe interventions or treatments performed by nurses in research and practice. Each intervention consists of a label, a definition, and a set of activities performed by nurses carrying out the intervention. The NIC was initiated by the University of Iowa in Iowa City, IA, in 1987 (NIC, 2011). The intervention labels developed over the last 20 years were derived from nursing education and practice. The research to develop the NIC was initiated in 1987 and progressed through four phases that overlapped in time: “Phase I: Construction of the Classification (1987-1992); Phase II: Construction of the Taxonomy (1990-1995); Phase III: Clinical Testing and Refinement (1993-1997); and Phase IV: Use and Maintenance (1996-ongoing)” (Bulechek, Butcher, & Dochterman, 2008, p. 5). The research methods used to develop the classification included content analysis, surveys, focus groups, similarity analysis, and hierarchical clustering. The NIC Taxonomy contained seven domains: Domain 1: Physiological: Basic; Domain 2: Physiological: Complex; Domain 3: Behavioral; Domain 4: Safety; Domain 5: Family; Domain 6: Health System; and Domain 7: Community. There are a total of 30 classes under the seven domains (Bowles & Naylor, 1996; Bulechek et al., 2008). Tripp-Reimer, Woodworth, McCloskey, and Bulechek (1996), in their analysis of the structure of the NIC interventions, identified three dimensions: intensity of care, focus of care, and complexity of care. A high intensity of care is associated with the physiological illness level of the patient and the emergency nature of the illness. The dimension of intensity of care includes indicators of (1) intensity (or acuity) and (2) whether the care is typical or novel. The dimension of focus of care addresses (1) the target of the intervention, ranging from the individual to the system; (2) whether the care action is direct or on behalf of the patient; and (3) the continuum of practice from independent to collaborative actions. The dimension of complexity of care encompasses a range of knowledge, skill, and urgency of the interventions (Bulechek et al., 2008). The interventions in the NIC have been subjected to multiple studies examining the effects on different populations and the effects of varying degrees of intensity. The 5th edition of the Nursing Interventions Classification, developed by faculty at the University of Iowa, included 542 research-based interventions (Bulechek et al., 2008). NIC development continues through the Center for Nursing Classification & Clinical Effectiveness located at the University of Iowa, and you can email them with questions (classification-center@uIowa.edu/; see Chapter 14 for more details on NIC). Currently, studies are being conducted to determine the outcomes of each intervention and to establish links between the intervention and outcomes at varying points in time after the intervention has been implemented. Outcomes that occur immediately following the intervention are easiest to determine. However, the most important outcomes may be those that occur after a client has been discharged or several weeks or months after the intervention. Table 11-1 provides some of the most current examples of the research related to the NIC and the Nursing Outcomes Classification (NOC) being conducted nationally and internationally. This information is critical for ensuring the quality of care provided by nurses and justifying nursing actions in a cost-conscious market (Doran, 2011). For a more extensive discussion of the importance of linking interventions with outcomes measures, see Chapter 13. TABLE 11-1 Work in Nursing Related to the NIC and the Nursing Outcomes Classification (NOC)
Selecting a Quantitative Research Design
 http://evolve.elsevier.com/Grove/practice/
Descriptive Study Designs
Typical Descriptive Study Designs
Comparative Descriptive Designs
Time-Dimensional Designs
Longitudinal Designs
Cross-Sectional Designs
Trend Designs
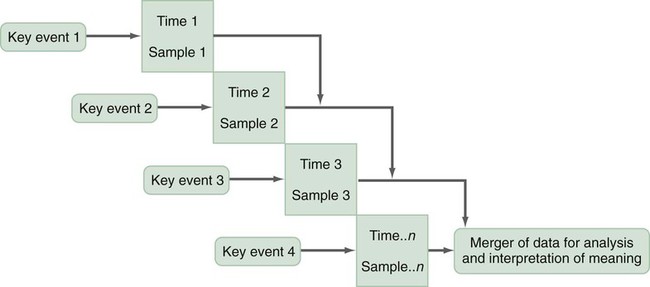
Event-Partitioning Designs
Case Study Designs
Surveys
Correlational Study Designs
Descriptive Correlational Designs
Predictive Designs

Model-Testing Designs
Defining Therapeutic Nursing Interventions
The Nursing Interventions Classification
Year
Source
2011
Lee, E., Park, H., Nam, M., & Whyte, J. (2011). Identification and comparison of interventions performed by Korean school nurses and U.S. school nurses using the Nursing Interventions Classification (NIC). Journal of School Nursing, 27(2), 93–101.
2011
Scherb, C. A., Head, B. J., Maas, M. L., Swanson, E. A., Moorhead, S., Reed, D., & Kozel, M. (2011). Most frequent nursing diagnoses, nursing interventions, and nursing-sensitive patient outcomes of hospitalized older adults with heart failure: Part 1. International Journal of Nursing Terminologies & Classifications, 22(1), 13–22.
2010
de Cordova, P., Lucero, R. J., Hyun, S., Quinlan, P., Price, K., & Stone, P. W. (2010). Using the Nursing Interventions Classification as a potential measure of nurse workload. Journal of Nursing Care Quality, 25(1), 39–45.
2010
Lunney, M., McGuire, M., Endozo, N., & McIntosh-Waddy, D. (2010). Consensus-validation study identifies relevant nursing diagnoses, nursing interventions, and health outcomes for people with traumatic brain injuries. Rehabilitation Nursing, 35(4), 161–166.
2010
Smith, K. J., & Craft-Rosenberg, M. (2010). Using NANDA, NIC, and NOC in an undergraduate nursing practicum. Nurse Educator, 35(4), 162–166.
2010
Solari-Twadell, P., & Hackbarth, D. P. (2010). Evidence for a new paradigm of the ministry of parish nursing practice using the nursing intervention classification system. Nursing Outlook, 58(2), 69–75.
2009
Scherb, C. A., & Weydt, A. P. (2009). Work complexity assessment, nursing interventions classification, and nursing outcomes classification: Making connections. Creative Nursing, 15(1), 16–22.
2009
Schneider, J. S., & Slowik, L. H. (2009). The use of the Nursing Interventions Classification (NIC) with cardiac patients receiving home health care. International Journal of Nursing Terminologies & Classifications, 20(3), 132–140.
2009
Wong, E. (2009). Novel nursing terminologies for the rapid response system. International Journal of Nursing Terminologies & Classifications, 20(2), 53–63.
2009
Wong, E., Scott, L. M., Briseno, J. R., Crawford, C. L., & Hsu, J. Y. (2009). Determining critical incident nursing interventions for the critical care setting: A pilot study. International Journal of Nursing Terminologies & Classifications, 20(3), 110–121.
2008
Schneider, J. S., Barkauskas, V., & Keenan, G. (2008). Evaluating home health care nursing outcomes with OASIS and NOC. Journal of Nursing Scholarship, 40(1), 76–82.
2008
Sheerin, F. K. (2008). Diagnoses and interventions pertinent to intellectual disability nursing. International Journal of Nursing Terminologies & Classifications, 19(4), 140–149. ![]()
Stay updated, free articles. Join our Telegram channel

Full access? Get Clinical Tree


Selecting a Quantitative Research Design
Get Clinical Tree app for offline access
