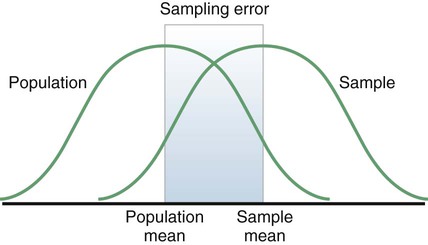
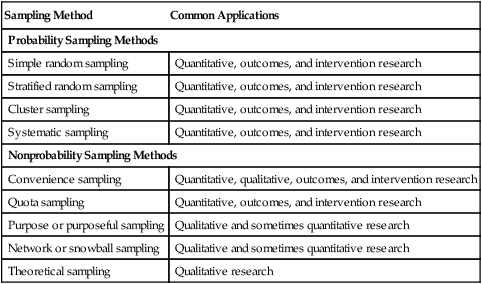
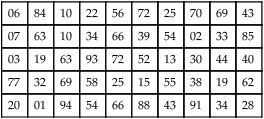
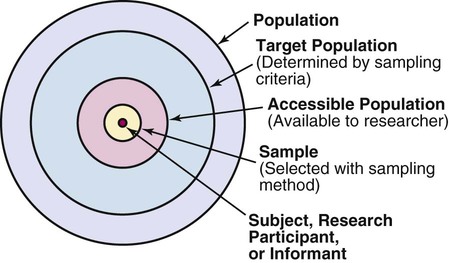
Sampling theory was developed to determine mathematically the most effective way to acquire a sample that would accurately reflect the population under study. The theoretical, mathematical rationale for decisions related to sampling emerged from survey research, although the techniques were first applied to experimental research by agricultural scientists. One of the most important surveys that stimulated improvements in sampling techniques was the U.S. census. Researchers have adopted the assumptions of sampling theory identified for the census surveys and incorporated them within the research process (Thompson, 2002). The population is a particular group of people, such as people who have had a myocardial infarction, or type of element, such as nasogastric tubes, that is the focus of the research. The target population is the entire set of individuals or elements who meet the sampling criteria, such as women who have experienced a myocardial infarction in the past year. Figure 15-1 shows the relationships among the population, target population, and accessible populations. An accessible population is the portion of the target population to which the researchers have reasonable access. The accessible population might be elements within a country, state, city, hospital, nursing unit, or clinic, such as the adults with diabetes in a primary care clinic in Fort Worth, Texas. The sample is obtained from the accessible population by a particular sampling method, such as simple random sampling. The individual units of the population and sample are called elements. An element can be a person, event, behavior, or any other single unit of study. When elements are persons, they are usually referred to as subjects or research participants or informants (see Figure 15-1). The term used by researchers depends of the philosophical paradigm that is reflected in the study and the design. The term subject, and sometimes research participant, is used within the context of the postpositivist paradigm of quantitative research (see Chapter 2). The term study or research participant or informant is used in the context of the naturalistic paradigm of qualitative research (Fawcett & Garity, 2009; Munhall, 2012). In quantitative, intervention, and outcomes research, the findings from a study are generalized first to the accessible population and then, if appropriate, more abstractly to the target population. Generalizing means that the findings can be applied to more than just the sample under study because the sample is representative of the target population. Because of the importance of generalizing, there are risks to defining the accessible population too narrowly. For example, a narrow definition of the accessible population reduces the ability to generalize from the study sample to the target population and diminishes the meaningfulness of the findings. Biases may be introduced that make generalization to the broader target population difficult to defend. If the accessible population is defined as individuals in a white, upper-middle-class setting, one cannot generalize to nonwhite or lower income populations. These biases are similar to biases that may be encountered in a nonrandom sample (Thompson, 2002). In some studies, the entire population is the target of the study. These studies are referred to as population studies (Barhyte, Redman, & Neill, 1990). Many of these studies use data available in large databases, such as the census data or other government-maintained databases. Epidemiologists sometimes use entire populations for their large database studies. In other studies, the entire population of interest in the study is small and well defined. For example, one could conduct a study in which the defined population was all living recipients of heart and lung transplants. Sampling criteria, also referred to as eligibility criteria, include a list of characteristics essential for membership or eligibility in the target population. The criteria are developed from the research problem, the purpose, a review of literature, the conceptual and operational definitions of the study variables, and the design. The sampling criteria determine the target population, and the sample is selected from the accessible population within the target population (see Figure 15-1). When the study is complete, the findings are generalized from the sample to the accessible population and then to the target population if the study has a representative sample (see the next section). Sampling criteria may include characteristics such as the ability to read, to write responses on the data collection instruments or forms, and to comprehend and communicate using the English language. Age limitations are often specified, such as adults 18 years and older. Subjects may be limited to individuals who are not participating in any other study. Persons who are able to participate fully in the procedure for obtaining informed consent are often selected as subjects. If potential subjects have diminished autonomy or are unable to give informed consent, consent must be obtained from their legal representatives. Thus, persons who are legally or mentally incompetent, terminally ill, or confined to an institution are more difficult to access as subjects (see Chapter 9). However, sampling criteria should not become so restrictive that the researcher cannot find an adequate number of study participants. A study might have inclusion or exclusion sampling criteria (or both). Inclusion sampling criteria are characteristics that a subject or element must possess to be part of the target population. Exclusion sampling criteria are characteristics that can cause a person or element to be excluded from the target population. Researchers need to provide logical reasons for their inclusion and exclusion sampling criteria, and certain groups should not be excluded without justification. In the past, some groups, such as women, ethnic minorities, elderly adults, and poor people, were unnecessarily excluded from studies (Larson, 1994). Today, federal funding for research is strongly linked to including these populations in studies. Exclusion criteria limit the generalization of the study findings and should be carefully considered before being used in a study. Twiss et al. (2009) conducted a quasi-experimental study to examine the effects of strength and weight training (ST) exercises on muscle strength, balance, and falls of breast cancer survivors (BCSs) with bone loss (population). This study included clearly identified inclusion and exclusion sampling or eligibility criteria that are presented in the following excerpt. Twiss et al. (2009) identified specific inclusion and exclusion sampling criteria to designate the subjects in the target population precisely. These sampling criteria probably were narrowly defined by the researchers to promote the selection of a homogeneous sample of postmenopausal BCSs with bone loss. These inclusion and exclusion sampling criteria were appropriate for the study to reduce the effect of possible extraneous variables that might have an impact on the treatment (ST exercises) and the measurement of the dependent variables (muscle strength, balance, and falls). Because this is a quasi-experimental study that examined the impact of the treatment on the dependent or outcome variables, the increased controls imposed by the sampling criteria strengthened the likelihood that the study outcomes were caused by the treatment and not by extraneous variables. Twiss et al. (2009) found significant improvement in muscle strength and balance for the treatment group but no significant difference in the number of falls between the treatment and comparison groups. Representativeness is usually evaluated by comparing the numerical values of the sample (a statistic such as the mean) with the same values from the target population. A numerical value of a population is called a parameter. We can estimate the population parameter by identifying the values obtained in previous studies examining the same variables. The accuracy with which the population parameters have been estimated within a study is referred to as precision. Precision in estimating parameters requires well-developed methods of measurement that are used repeatedly in several studies. You can define parameters by conducting a series of descriptive and correlational studies, each of which examines a different segment of the target population; then perform a meta-analysis to estimate the population parameter (Thompson, 2002). The difference between a sample statistic and a population parameter is called the sampling error (Figure 15-2). A large sampling error means that the sample is not providing a precise picture of the population; it is not representative. Sampling error is usually larger with small samples and decreases as the sample size increases. Sampling error reduces the power of a study, or the ability of the statistical analyses conducted to detect differences between groups or to describe the relationships among variables (Aberson, 2010; Cohen, 1988). Sampling error occurs as a result of random variation and systematic variation. Systematic variation, or systematic bias, is a consequence of selecting subjects whose measurement values are different, or vary, in some specific way from the population. Because the subjects have something in common, their values tend to be similar to the values of others in the sample but different in some way from the values of the population as a whole. These values do not vary randomly around the population mean. Most of the variation from the mean is in the same direction; it is systematic. All the values in the sample may tend to be higher or lower than the mean of the population (Thompson, 2002). Because of systematic variance, the sample mean is different from the population mean. The extent of the difference is the sampling error (see Figure 15-2). Exclusion criteria tend to increase the systematic bias in the sample and increase the sampling error. An extreme example of this problem is the highly restrictive sampling criteria used in some experimental studies that result in a large sampling error and greatly diminished representativeness. Systematic variation or bias is most likely to occur when the sampling process is not random. However, even in a random sample, systematic variation can occur if potential subjects decline participation. Systematic bias increases as the subjects’ refusal rate increases. A refusal rate is the number and percentage of subjects who declined to participate in the study. High refusal rates to participate in a study have been linked to individuals with serious physical and emotional illnesses, low socioeconomic status, and weak social networks (Neumark, Stommel, Given, & Given, 2001). The higher the refusal rate, the less the sample is representative of the target population. The refusal rate is calculated by dividing the number of potential subjects refusing to participate by the number of potential subjects meeting sampling criteria and multiplying the results by 100%. Systematic variation can also occur in studies with high sample attrition. Sample attrition is the withdrawal or loss of subjects from a study. Systematic variation is greatest when a high number of subjects withdraw from the study before the data have been collected or when a large number of subjects withdraw from one group but not the other in the study (Kerlinger & Lee, 2000; Thompson, 2002). In studies involving a treatment, subjects in the control group who do not receive the treatment may be more likely to withdraw from the study. Sample attrition should be reported in the published study to determine if the final sample represents the target population. Researchers also need to provide a rationale for subjects withdrawing from the study and to determine if they are different from the subjects who complete the study. The sample is most like the target population if the attrition rate is low (<10% to 20%) and the subjects withdrawing from the study are similar to the subjects completing the study. Sample attrition rate is calculated by dividing the number of subjects withdrawing from a study by the sample size and multiplying the results by 100%. The study by Twiss et al. (2009) of the effects of ST exercises on muscle strength, balance, and falls of BCSs with bone loss was introduced earlier in this chapter with the discussion of sampling criteria; the following excerpt presents the acceptance rate and sample attrition for this study. Twiss et al. (2009) identified that 249 participants or subjects met the sampling criteria and 249 were enrolled in the study indicating that the acceptance rate for the study was 100%. The sample retention was 223 women for a retention rate of 90% (223 ÷ 249 × 100% = 89.6% = 90%), and the sample attrition rate was 26 women for an attrition rate of 10% (100% − 90% = 10%). The treatment group retention was 110 women with a retention rate of 89% (110 ÷ 124 × 100% = 88.7% = 89%). The comparison group retention was 113 women with a retention rate of 90% (113 ÷ 125 = 90.4% = 90%). This study has an excellent acceptance rate (100%) and a very strong sample retention rate of 90% for a 24-month-long study. The retention rates for both groups were very strong and comparable (treatment group 89% and comparison group 90%). Twiss et al. (2009) also provided a rationale for the subjects’ attrition, and the reasons were varied and seemed appropriate and typical for a study lasting 24 months. The acceptance rate, the sample and group retention rates, and the reasons for subjects’ attrition indicate limited potential for systematic variation in the study sample. The likelihood is increased that the sample is representative of the target population and the results are an accurate reflection of reality. The study would have been strengthened if the researchers would have included not only the numbers but also the sample and group retention rates. Random sampling increases the extent to which the sample is representative of the target population. However, random sampling must take place in an accessible population that is representative of the target population. Exclusion criteria limit true randomness. Thus, a study that uses random sampling techniques may have such restrictive sampling criteria that the sample is not truly random. In any case, it is rarely possible to obtain a purely random sample for nursing studies because of informed consent requirements. Even if the original sample is random, persons who volunteer or consent to participate in a study may differ in important ways from persons who are unwilling to participate. All samples with human subjects must be volunteer samples, which includes individuals willing to participate in the study, to protect the rights of the individuals (Fawcett & Garity, 2009). Methods of achieving random sampling are described later in the chapter. For each person in the target or accessible population to have an opportunity to be selected for the sample, each person in the population must be identified. To accomplish this goal, the researcher must acquire a list of every member of the population through the use of the sampling criteria to define membership. This listing of members of the population is referred to as the sampling frame. The researcher selects subjects from the sampling frame using a sampling plan. Djukic, Kovner, Budin, and Norman (2010) studied the effect of nurses’ perceived physical work environment on their job satisfaction and described their sampling frame in the following excerpt. A sampling method is the process of selecting a group of people, events, behaviors, or other elements that represent the population being studied. A sampling method is similar to a design; it is not specific to a study. The sampling plan provides detail about the application of a sampling method in a specific study. The sampling plan must be described in detail for purposes of critical appraisal, replication, and future meta-analyses. The sampling method implemented in a study varies with the type of research being conducted. Quantitative, outcomes, and intervention research apply a variety of probability and nonprobability sampling methods. Qualitative research usually includes nonprobability sampling methods. The sampling methods to be included in this text are identified in Table 15-1 and are linked to the types of research that most commonly incorporate them. The following sections describe the different types of probability and nonprobability sampling methods most commonly used in quantitative, qualitative, outcomes, and intervention research in nursing. TABLE 15-1 Probability and Nonprobability Sampling Methods Commonly Applied in Nursing Research There is less opportunity for systematic bias if subjects are selected randomly, although it is possible for a systematic bias to occur by chance. Using random sampling, the researcher cannot decide that person X would be a better subject for the study than person Y. In addition, a researcher cannot exclude a subset of people from selection as subjects because he or she does not agree with them, does not like them, or finds them hard to deal with. Potential subjects cannot be excluded just because they are too sick, not sick enough, coping too well, or not coping adequately. The researcher, who has a vested interest in the study, could (consciously or unconsciously) select subjects whose conditions or behaviors are consistent with the study hypothesis. It is tempting to exclude uncooperative or assertive individuals. Random sampling leaves the selection to chance and decreases sampling error and increases the validity of the study (Thompson, 2002). There can be some differences in the probability for the selection of each element, depending on whether the name or number of the selected element is replaced before the next name or number is selected. Selection with replacement, the most conservative random sampling approach, provides exactly equal opportunities for each element to be selected (Thompson, 2002). For example, if the researcher draws names out of a hat to obtain a sample, each name must be replaced before the next name is drawn to ensure equal opportunity for each subject. There are many ways to achieve random selection, such as with the use of a computer, a random numbers table, drawing names out of a hat, or a roulette wheel. The most common method of random selection is the computer, which can be programmed to select a sample randomly from the sampling frame with replacement. However, some researchers still use a table of random numbers to select a random sample. Table 15-2 shows a section from a random numbers table. To use a table of random numbers, the researcher places a pencil or a finger on the table with the eyes closed. The number touched is the starting place. Moving the pencil or finger up, down, right, or left, the researcher uses the numbers in order until the desired sample size is obtained. For example, the researcher places a pencil on 58 in Table 15-2, which is in the fourth column from the left and fourth row down. If five subjects are to be selected from a population of 100 and the researcher decides to go across the column to the right, the subject numbers chosen are 58, 25, 15, 55, and 38. Table 15-2 is useful only if the population number is less than 100. However, tables are available for larger populations, such as the random numbers table provided in the online resources for this textbook or the Thompson (2002, pp. 14-15) sampling text. TABLE 15-2 Section from a Random Numbers Table Degirmen, Ozerdogan, Sayiner, Kosgeroglu, and Ayranci (2010, p. 153) conducted a pretest-posttest randomized controlled experimental study to determine the effect of hand and foot massage and foot massage only interventions on the postoperative pain of women who had a cesarean operation. These researchers obtained their sample using a simple random sampling method that is described in the following excerpt from their study. Degirmen et al. (2010) clearly identified their target population as women needing cesarean operations, and the 281 women with presenting orders provided the sampling frame for the study. The sample of 75 women was randomly selected, but the researchers did not indicate the process for the random selection. The use of a computer to select a sample randomly is usually the most efficient and unbiased process. The subjects were evenly divided with 25 in each group, but the researchers do not indicate if the assignment to groups was random or based on the convenience of the subjects or researchers. Application of simple random sampling and the attrition of only three (4%) subjects from the study seem to provide a sample representative of the target population. However, the study would have been strengthened by a discussion of the process for random sampling and a clarification of how the subjects were assigned to groups. The outcomes of the study were that foot and hand massage interventions significantly reduced postoperative pain experienced by the women and that foot and hand massage was significantly more effective than foot massage only. For example, if in conducting your research you selected a stratified random sample of 100 adult subjects using age as the variable for stratification, the sample might include 25 subjects in the age range 18 to 39 years, 25 subjects in the age range 40 to 59 years, 25 subjects in the age range 60 to 79 years, and 25 subjects 80 years or older. Stratification ensures that all levels of the identified variable, in this example age, are adequately represented in the sample. With a stratified random sample, you could use a smaller sample size to achieve the same degree of representativeness as a large sample acquired through simple random sampling. Sampling error decreases, power increases, data collection time is reduced, and the cost of the study is lower if stratification is used (Fawcett & Garity, 2009; Thompson, 2002). One question that arises in relation to stratification is whether each stratum should have equivalent numbers of subjects in the sample (termed disproportionate sampling) or whether the numbers of subjects should be selected in proportion to their occurrence in the population (termed proportionate sampling). For example, if stratification is being achieved by ethnicity and the population is 45% white non-Hispanic, 25% Hispanic nonwhite, 25% African American, and 5% Asian, your research team would have to decide whether to select equal numbers of each ethnic group or to calculate a proportion of the sample. Good arguments exist for both approaches. Stratification is not as useful if one stratum contains only a small number of subjects. In the aforementioned situation, if proportions are used and the sample size is 100, the study would include only five Asians, hardly enough to be representative. If equal numbers of each group are used, each group would contain at least 25 subjects; however, the white non-Hispanic group would be underrepresented. In this case, mathematically weighting the findings from each stratum can equalize the representation to ensure proportional contributions of each stratum to the total score of the sample. Most textbooks on sampling describe this procedure (Levy & Lemsbow, 1980; Thompson, 2002; Yates, 1981). Ulrich et al. (2006) used a stratified random sampling method to obtain their sample of nurse practitioners (NPs) and physician assistants (PAs) for the purpose of studying the ethical conflict of these healthcare providers associated with managed care. The following excerpt from this study describes the sampling method used to obtain the final sample of 1536 providers (833 NPs and 689 PAs). Cluster sampling is a probability sampling method applied when the population is heterogeneous; it is similar to stratified random sampling but takes advantage of the natural clusters or groups of population units that have similar characteristics (Fawcett & Garity, 2009). Cluster sampling is used in two situations. The first situation is when a simple random sample would be prohibitive in terms of travel time and cost. Imagine trying to arrange personal meetings with 100 people, each in a different part of the United States. The second situation is in cases in which the individual elements making up the population are unknown, preventing the development of a sampling frame. For example, there is no list of all the heart surgery patients who complete rehabilitation programs in the United States. In these cases, it is often possible to obtain lists of institutions or organizations with which the elements of interest are associated. Fouladbakhsh and Stommel (2010, p. E8) used multistage cluster sampling in their study of the “complex relationships among gender, physical and psychological symptoms, and use of specific CAM [complementary and alternative medicine] health practices among individuals living in the United States who have been diagnosed with cancer.” These researchers described their sampling method in the following excerpt from their study.
Sampling
 http://evolve.elsevier.com/Grove/practice/
Sampling Theory
Populations and Elements
Sampling or Eligibility Criteria
Sample Representativeness
Sampling Error
Systematic Variation
Refusal and Acceptance Rates in Studies
Sample Attrition and Retention Rates in Studies

Randomization
Sampling Frame
Sampling Plan
Sampling Method
Common Applications
Probability Sampling Methods
Simple random sampling
Quantitative, outcomes, and intervention research
Stratified random sampling
Quantitative, outcomes, and intervention research
Cluster sampling
Quantitative, outcomes, and intervention research
Systematic sampling
Quantitative, outcomes, and intervention research
Nonprobability Sampling Methods
Convenience sampling
Quantitative, qualitative, outcomes, and intervention research
Quota sampling
Quantitative, outcomes, and intervention research
Purpose or purposeful sampling
Qualitative and sometimes quantitative research
Network or snowball sampling
Qualitative and sometimes quantitative research
Theoretical sampling
Qualitative research
Probability (Random) Sampling Methods
Simple Random Sampling
06
84
10
22
56
72
25
70
69
43
07
63
10
34
66
39
54
02
33
85
03
19
63
93
72
52
13
30
44
40
77
32
69
58
25
15
55
38
19
62
20
01
94
54
66
88
43
91
34
28
Stratified Random Sampling
Cluster Sampling
![]()
Stay updated, free articles. Join our Telegram channel

Full access? Get Clinical Tree


Sampling
Get Clinical Tree app for offline access
