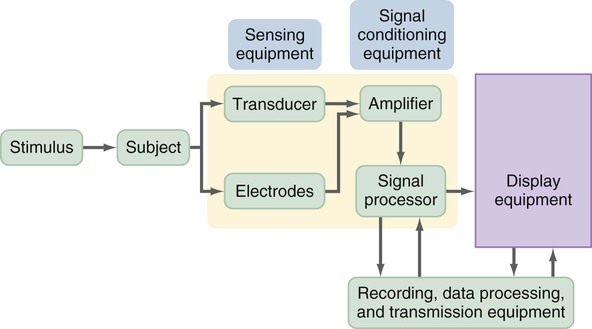
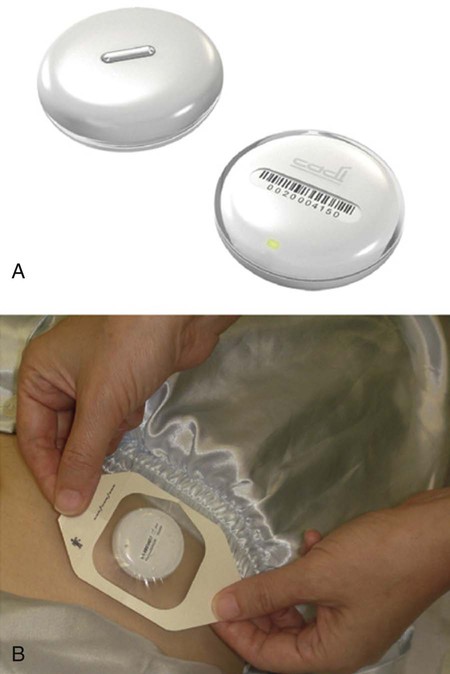
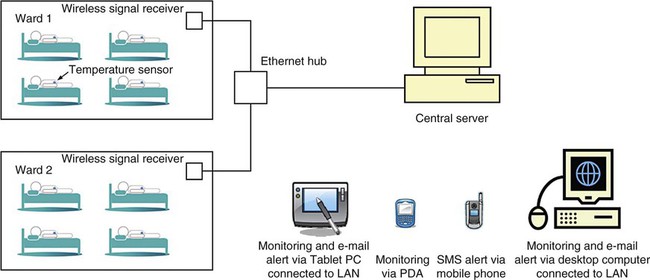
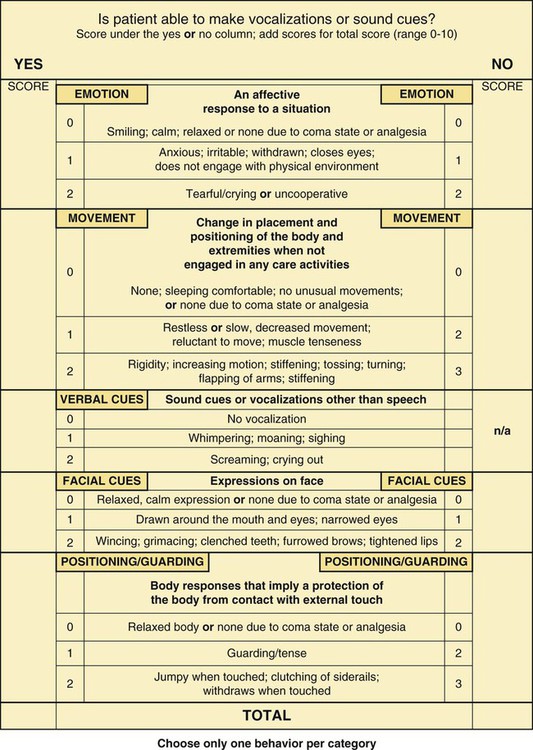
Nursing research examines a wide variety of phenomena, requiring an extensive array of measurement methods. However, nurse researchers have sometimes found limited instruments available to measure phenomena central to the studies essential for generating evidence-based practice (EBP). Thus, for the last 30 years, nurse researchers have made it a priority to develop valid and reliable instruments to measure phenomena of concern to nursing. As a result, the number and quality of measurement methods have greatly increased (DeVon et al., 2007; Waltz, Strickland, & Lenz, 2010). Knowledge of measurement methods is important to all aspects of nursing. To perform a critical appraisal of a study, nurses need knowledge of measurement theory and an understanding of the state of the art for developing instruments to examine the phenomena under study. For example, when evaluating someone else’s research, you might want to know whether the researcher was using an older tool that has been surpassed by more precise and accurate physiological measures. It might help you to know that measuring a particular phenomenon has been a problem with which nurse researchers have struggled for many years. Your understanding of the successes and struggles in measuring nursing phenomena may stimulate your creative thinking and lead you to contribute your own research to the development of measurement approaches. Some nursing phenomena have not been adequately examined because reliable and valid instruments are not available to measure them, which makes it difficult for nurse researchers to generate the essential evidence needed for practice (Brown, 2009; Craig & Smyth, 2012; Melnyk & Fineout-Overholt, 2011). Much of nursing practice is oriented toward physiological dimensions of health. Therefore, many of our questions require us to be able to measure these dimensions. Of particular importance are studies linking physiological, psychological, and social variables. The need for physiological research reached national attention in 1993 when the National Institute of Nursing Research (NINR) recommended an increase in physiologically-based nursing studies because 85% of NINR-funded studies involved nonphysiological variables. According to NINR staff, a review of physiological studies funded by the NINR found that “the biological measurements used in the funded grants often were not state-of-the-science, and the biological theory underlying the measurements often was underutilized” (Cowan, Heinrich, Lucas, Sigmon, & Hinshaw, 1993, p. 4). Cowan et al. proposed a 10-year plan to enhance the education of nurse researchers in physiological measurement, expand the number and quality of physiological studies conducted, and increase the funding for physiological research. Rudy and Grady (2005) noted in their small study of funded researchers (N = 31) that nursing is building a group of nurse scientists who are committing their research careers to studying various biological and pathological phenomena. Over the last 15 years, nurse researchers have expanded their use and development of precise and accurate physiological measures. An example is the current research taking place in genetics, which was encouraged by Grady, Director of the NINR, with the implementation of the Summer Genetics Institute (SGI) to expand the conduct of genomic research (NINR, 2012). The 2011 Strategic Plan for NINR emphasized the conduct of biological research to provide a foundation for understanding and managing diseases and to test preventive care and self-management strategies. NINR (2011) proposed to invest in research to “[i]mprove quality of life by managing symptoms of chronic illness,” which will require expansion in the number of biologically based studies and the quality of physiological measurements used in these studies (see the NINR most current Mission and Strategic Plan document at http://www.ninr.nih.gov/AboutNINR/NINRMissionandStrategicPlan/). The increased number of biological researchers and the expanded funding for biological research have increased the quality and quantity of physiological measures used in nursing studies. Physiological measures include two categories, biophysical and biochemical. Biophysical measures might include the use of the stethoscope and sphygmomanometer to measure blood pressure, and a biochemical measure might include the laboratory value for total cholesterol. Physiological measures can be acquired in a variety of ways from instruments within the body (in vivo), such as a reading from an arterial line, or from application of an instrument on the outside of a subject (in vitro), such as a blood pressure cuff (Stone & Frazier, 2010). The following sections describe how to obtain physiological measures by self-report, observation, direct or indirect measurement, laboratory tests, electronic monitoring, and the creative development of new instruments. The measurement of physiological variables across time is also addressed. This section concludes with a discussion of how to select physiological measures for a particular study. Self-report has been used effectively to obtain physiological information and may be particularly useful when the subjects are not in closely monitored settings such as hospitals, clinics, or research facilities. Phenomena that have been or could be measured by self-report include hours of sleep, patterns of daily activities, eating patterns, dieting patterns, stool frequency and consistency, patterns of joint stiffness, variations in degree of mobility, and exercise patterns. For some variables, self-report may be the only means of obtaining the information. Such may be the case when study participants experience a physiological phenomenon that cannot be observed or measured by others. Nonobservable physiological phenomena include pain, nausea, dizziness, indigestion, patterns of hunger or thirst, hot flashes, tinnitus, pruritus, fatigue, malaise, and dyspnea (DeVon et al., 2007; Waltz et al., 2010). Bhengu et al. (2011) studied the physiological symptoms experienced by individuals infected with human immunodeficiency virus (HIV) and receiving antiretroviral therapy. These physiological symptoms were measured using a self-report checklist completed by the HIV-infected patients. The measurement method was the revised Sign and Symptom Checklist for HIV patients (SSC-HIVrev) developed by Holzemer et al. (1999) and revised by Holzemer, Hudson, Kirksey, Hamilton, and Bakken (2001). The SSC-HIVrev instrument is described in the following excerpt. The self-report SSC-HIVrev scale was refined by Holzemer et al. (1999, 2001) over the years and has documented reliability and validity. The SSC-HIVrev has demonstrated construct validity through factor analysis, with six factors being identified, and concurrent validity. The scale has strong reliability in previous studies and in this study for the total scale and the six subscales (alpha reliabilities ranging from 0.77 to 0.91). Using self-report measures may enable nurses to study research questions that were not previously considered, which could be an important means to build knowledge in areas not yet explored. The insight gained could alter the way nurses manage patient situations that are now considered problematic and improve patient outcomes (Doran, 2011). However, self-report is a subjective way to measure physiological variables, and studies are strengthened by having both subjective and objective measurements of physiological variables. Researchers sometimes obtain data on physiological parameters by using observational data collection measures. These measures provide criteria for quantifying various levels or states of physiological functioning. In addition to collecting clinical data, this method provides a means to gather data from the observations of caregivers. This source of data has been particularly useful in studies involving critically ill patients in intensive care units (ICUs) and patients with Alzheimer’s disease, advanced cancer, and severe mental illness. Observation is also an effective way to gather data on frail elderly adults, infants, and young children. Studies involving home health agencies and hospices often use observation tools to record physiological dimensions of patient status. These data are sometimes stored electronically and are available to researchers for large database analysis. Measuring physiological variables using observation requires a quality tool for data collection and consistent use of this tool by data collectors. If the observations in a study are being conducted using multiple data collectors, it is essential that the consistency or interrater reliability of the data collectors be determined (see Chapter 16) (Bialocerkowski, Klupp, & Bragge, 2010; DeVon et al., 2007; Waltz et al., 2010). Klein, Dumpe, Katz, and Bena (2010) developed a Nonverbal Pain Assessment Tool (NPAT) to measure the pain experience by nonverbal adult patients in the ICU. Testing of the tool occurred in three phases that focused on the internal reliability, content validity, and criterion validity of the tool and the interrater reliability of the data collectors. The following excerpt describes development of the NPAT and its demonstrated reliability and validity. Klein et al. (2010) found the NPAT had strong internal reliability for both the total scale (Cronbach’s alpha = 0.82) and the subscales (Cronbach’s alpha ranging from 0.77 to 0.79). Because the NPAT is a new tool, these researchers described the content and criterion validity of the tool and recognized the need for additional research to determine the reliability and validity of the tool with different samples. The final copy of this tool is presented later in this chapter. Physiological variables can be measured either directly or indirectly. Direct measures are more accurate because there is an objective measurement of the study variable. For example, patients might be asked to report any irregular heartbeats during waking hours over a 24-hour period, which is an indirect measurement of heart rhythm, and each patient’s heart could be monitored with a Holter monitor over the same 24-hour time frame (direct measure of heart rhythm). Whenever possible, researchers usually select direct measures of study variables because of the accuracy and precision of these measurement methods. However, if a direct measurement method does not exist, an indirect measurement method could be used in the initial investigation of a physiological variable. Sometimes researchers use both direct and indirect measurement methods to expand the understanding of a physiological variable. Dubbert, White, Grothe, O’Jile, and Kirchner (2006) studied the physical activity of patients who are severely mentally ill. These researchers measured the variable physical activity with indirect and direct measurement methods that are described in the following excerpt. Researchers need to ensure the accuracy and precision of laboratory measures and the methods of collecting specimens for their studies. The laboratory performing the analyses needs to be certified and in compliance with national standards developed by the Clinical and Laboratory Standards Institute (CLSI, 2011). The data collectors need to be trained to ensure that intrarater reliability and interrater reliability are maintained during the data collection process (see Chapter 16) (Bialocerkowski et al., 2010; Waltz et al., 2010). Smith, Annesi, Walsh, Lennon, and Bell (2010) examined the effects of a behavioral treatment on voluntary physical activity, self-efficacy, and risk factors for type 2 diabetes in obese preadolescents 10 to 14 years old. The risk factors for diabetes measured in this study included lipid values and glucose/insulin ratio that were determined before and after the 12-week behavioral treatment. The following excerpt describes the blood analyses that were conducted in this study. To use electronic monitoring, usually sensors are placed on or within study participants. The sensors measure changes in body functions such as electrical energy. Figure 17-1 shows the process of electronic measurement. Many sensors need an external stimulus to trigger the measurement process. Transducers convert the electrical signal to numerical data. Electrical signals often include interference signals as well as the desired signal, so you may choose to use an amplifier to decrease interference and amplify the desired signal. The electrical signal is digitized (converted to numerical digits or values) and stored in a computer. In addition, it is immediately displayed on a monitor. The display equipment may be visual or auditory or both. One type of display equipment is an oscilloscope that displays the data as a waveform; it may provide information such as time, phase, voltage, or frequency of the target event or behavior. The final phase is the recording, data processing, and transmission that might be done through computer, camera, graphic recorder, or magnetic tape recorder (Stone & Frazier, 2010). A graphic recorder provides a printed version of the data. Some electronic equipment simultaneously records multiple physiological measures that are displayed on a monitor. The equipment is often linked to a computer or might be wireless, which allows the researcher to review the data. The computer often contains complex software for detailed analysis of the data and provides a printed report of the analysis results (Pugh & DeKeyser, 1995; Stone & Frazier, 2010). The advantages of using electronic monitoring equipment are the collection of accurate and precise data, recording of data accurately within a computerized system, potential for collection of large amounts of data frequently over time, and transmission of data electronically for analysis. One disadvantage of using certain sensors to measure physiological variables is that the presence of a transducer within the body can alter the reading. For example, the presence of a flow transducer in a blood vessel can partially block the vessel and alter blood flow resulting in an inaccurate reflection of the flow (Ryan-Wenger, 2010). Ng, Wong, Lim, and Goh (2010) compared the Cadi ThermoSENSOR wireless skin-contact thermometer (Figure 17-2) readings with the ear and axillary temperatures in children. The ThermoSENSOR thermometer provides a continuous measurement of body temperature and transmits the readings wirelessly to a central server. The measurement with the ThermoSENSOR thermometer is described in the following excerpt. “Developed by Cadi Scientific in Singapore as part of an integrated wireless system for temperature monitoring and location tracking, this system uses a reusable skin-contact thermometer or sensor called the ThermoSENSOR. This thermometer takes the form of a small disc that can be easily adhered to the patient’s skin, and each disc is assigned a unique radio frequency identification (RFID) number [see Figure 17-2]. The thermometer measures body temperature continuously and transmits a temperature reading and the RFID number approximately every 30 seconds to a computer or server through one or more signal receivers (nodes) installed in the vicinity of the patient [Figure 17-3].” (Ng et al., 2010, pp. 176-177) The ThermoSENSOR uses a thermistor as the sensing element. When in use, the sensor is attached to the patient using a two-layer dressing system that prevents the sensor from coming in direct contact with the skin [see Figure 17-2]. The sensor is water resistant and can be cleaned by immersing it in a cleaning and disinfectant solution. The manufacturer provided the following specifications for the sensor: operating ambient temperature range, 10° C to 50° C; thermistor accuracy, ± 0.2° C for temperature range of 32.0° C to 42.0° C; data transmission rate, every 30 seconds on average; radio frequency, 868.4 MHz; typical transmission range, 10 m (unblocked); power source, internal 3-V lithium coin-cell battery; battery life, 12 months (continuous operation); dimensions, diameter of 36 mm, height of 11.6 mm; weight, 10 g without battery; applicable radio equipment standards, ETSI 300 220, ETSI EN 301 489.” (Ng et al., 2010, pp 177-178) Ng et al. (2010) provided detailed descriptions and pictures of both the ThermoSENSOR thermometer and the wireless setup. The thermometer was consistently applied to the abdomen of each child and was cleaned in a precise way. The manufacturer specifications of the thermometer documented that it was an accurate device to measure temperature. The wireless system was described in detail with documentation of its precision and accuracy in obtaining and transferring the children’s temperatures to a computer for recording, display, and analysis of the data. The findings of the study indicated that the ThermoSENSOR wireless skin-contact thermometer readings were comparable to the ear and axillary temperature readings. The Human Genome Project has greatly expanded the understanding of deoxyribonucleic acid (DNA) that contains the code for controlling human development. The U.S. Human Genome Project was begun in 1990 by the Department of Energy and the National Institutes of Health and was completed in 2003. The genome is the entire DNA sequence in an organism, including its genes. The genes carry information for making all the proteins required by the organism that are used to determine how the body looks, functions, and behaves. The DNA is a double-stranded helix and serves as the code for the production of the single-stranded messenger ribonucleic acid (RNA) (Stone & Frazier, 2010). • Identify all the approximately 20,000-25,000 genes in human DNA, • Determine the sequences of the 3 billion chemical base pairs that make up human DNA, • Store this information in databases, • Improve tools for data analysis, • Transfer related technologies to the private sector, and • Address the ethical, legal, and social issues (ELSI) that may arise from the project” (Department of Education Genomic Science, 2011) The advancements in genetics have facilitated the development of new technologies that have permitted the analysis of normal and abnormal genes for the detection and diagnosis of genetic diseases. Through the use of molecular cloning, sufficient quantities of DNA and RNA have been produced to permit analysis in research. The Southern blotting technique is the standard way for analyzing the structure of DNA. The Northern blotting technique is used for RNA analysis. Analyses of both normal and mutant genes are of interest, and the Western blotting technique is used to examine the mutant proteins in cells obtained from patients with diseases. In addition, polymerase chain reaction can selectively amplify DNA and RNA molecules for study (Stone & Frazier, 2010). It is important that nurses be aware of the advances in technologies to measure nucleic acids and use them in their programs of research. Nurses are becoming more aware of the conduct of genetic research through doctoral and postdoctoral programs specialized in this area. In addition, the NINR provides the SGI to expand researchers’ expertise in conducting genetic research. You can access information on the SGI at the following NINR (2012) website: http://www.ninr.nih.gov/Training/TrainingOpportunitiesIntramural/SummerGeneticsInstitute/. These educational opportunities have expanded genetic research in nursing and increased the number of studies focused on the measurement of nucleic acids by nurses. Jones, Munro, Grap, Kitten, and Edmond (2010) conducted a study to determine the impact of oral care on the bacteremia risk in mechanically ventilated adults. The researchers wanted to determine if tooth brushing induced transient bacteremia in this group of patients. They used DNA typing to identify organisms for the blood and oral cultures collected before and 1 minute and 30 minutes after tooth brushing. Their measurement of oral microbial organisms is presented in the following excerpt. Through the use of DNA typing, Jones et al. (2010) were able to measure very precisely bacteremia risk associated with oral care in mechanically ventilated patients. By comparison of DNA sequences in the blood and oral cultures, other confounding potential causes of bacteremia could be eliminated. The researchers found that tooth brushing did not induce transient bacteremia in the patient population. This research provides a basis for future research focused on standardizing effective and safe oral care in this population. Some studies require imaginative approaches to measuring phenomena that are traditionally observed in clinical practice but are not measured. The first step in this process is to recognize that the phenomenon being observed by the nurse can be measured. Once that idea has emerged, one can begin envisioning various means of measuring the phenomenon. As new physiological measurements are developed, they must be compared with previous methods to determine the best strategy for measuring each physiological outcome based on the patient’s condition. Gelinas et al. (2010) developed a new approach for detecting pain in adults by measuring the cerebral regional oxygen saturation (rSO2) using near-infrared spectroscopy (NIRS). The NIRS technique (IN-VOS-4100 system; Somanetics, Troy, MI) was used to measure pain during the nociceptive procedures, such as intravenous and arterial line insertions, sternal bone incision, and thorax opening, during cardiac surgery. The rSO2 measurements were compared with the scores from the Critical-Care Pain Observation Tool (CPOT) and the faces pain thermometer (FPT) to determine discriminant and criterion validity. These physiological measures used in this study are presented in the following excerpt. These researchers detailed the use of the NIRS technique to measure rSO2, and this measurement of pain was comparable to the CPOT and the FPT. Comparison of the rSO2 with the CPOT and FPT added to the criterion, convergent, and discriminant validity of the measurement methods. Gelinas et al. (2010, p. 485) concluded, “Although further research is needed in critically ill adult patients undergoing more painful procedures, the NIRS may become a promising technique for assessing pain.” In the previously discussed study using NIRS, Gelinas et al. (2010) conducted a repeated-measures design that involved obtaining measurements from 40 subjects at two test periods. The first test period occurred while patients were awake, and the rSO2, CPOT, and FPT measurements were recorded for each subject. The second test period took place after the induction of anesthesia, and it was possible to record only the rSO2. These simultaneous measurements of pain using various instruments as well as the repeated measures of the rSO2 when patients were anesthetized allowed the examination of reliability and validity of the NIRS technique to measure rSO2 as a pain indicator over time. 1. What physiological variables are relevant to the study? 2. Do the variables need to be measured continuously or at a particular point in time? 3. Are repeated measures needed? 4. Do certain characteristics of the population under study place limits on the measurement approaches that can be used? 5. How has the variable been measured in previous research? 6. Is more than one measurement method available to measure the physiological variable being studied (Stone & Frazier, 2010)? 7. Which measurement method is the most accurate and precise for the population you are studying (Fawcett & Garity, 2009; Ryan-Wenger, 2010)? 8. Could the study be designed to include more than one measurement method for the variable being studied (DeVon et al., 2007; Fawcett & Garity, 2009)? 9. Where can the measurement device or devices be obtained to measure the physiological variable being studied? 10. Can the measurement device be obtained from the manufacturer for use in the study, or must it be purchased? 11. What are the standards for the measurement device or equipment that has been designated nationally and internationally (International Organization for Standardization [IOS], 2011)? Physiological measures must be linked conceptually with the framework of the study. The logic of operationalizing the concept in a particular way must be well thought out and expressed clearly (see Chapter 7). It is often a good idea to use diverse physiological measures of a single concept, which reduces the impact of extraneous variables that might affect measurement. The operationalization of a physiological variable in a study should clearly indicate the physiological measure to be used. The link of the physiological variable to the concept in the framework must be made explicit in the published report of your study. You also need to evaluate the accuracy and precision of physiological measures. Until more recently, researchers commonly used information from the equipment manufacturer to describe the accuracy of measurement. This information is useful, but it is insufficient to evaluate accuracy and precision. The accuracy and precision of physiological measures are discussed in Chapter 16 (CLSI, 2011; IOS, 2011; Ryan-Wenger, 2010). You need to consider problems you might encounter when using various approaches to physiological measurement. One factor of concern is the sensitivity of the measure. Will the measure detect differences finely enough to avoid a type II error—known as a false negative—that occurs when the investigator claims there is no difference between groups or relationships among variables when one really exists (see Chapter 21)? Physiological measures are usually norm referenced. Data obtained from a study participant are compared with a norm as well as with other participants. You need to determine whether the norm used for comparison is relevant for the population you are studying. Laboratories are certified by ensuring that the analyses conducted in the laboratory meet a national standard (CLSI, 2011). New physiological measures are compared with the “gold standard” or the current best measurement method for a physiological variable. For example, Klein et al. (2010) compared their NPAT with the “gold standard” of the patients’ self-reports of pain using the CPOT. 1. Description of the equipment or device used in performing the measurement 2. Identification of the name of the equipment manufacturer 3. Account of the accuracy and precision of the equipment or device based on previous research, the manufacturers’ specifications, and national and international standards 4. Explanation of the exact procedure followed to measure the physiological variable 5. Overview of the process the device used to record, retrieve, and store data Observational measurement is the use of unstructured and structured inspection to gauge a study variable. This section focuses on structured observational measurement; unstructured observational measurement is described in Chapter 12. Although data collection by observation is most common in qualitative research, it is used to some extent in all types of studies (Marshall & Rossman, 2011; Munhall, 2012). First, you must decide what you want to observe, and then you need to determine how to ensure that every variable is observed in a similar manner in each instance. Much attention must be given to training data collectors, especially when the observations are complex and examined over time (Waltz et al., 2010). You must create opportunities for the observational technique to be pilot-tested and to generate data on interrater reliability. Observational measurement tends to be more subjective than other types of measurement and is often seen as less credible. However, in many cases, observation is the only possible way to obtain important evidence for practice. Klein et al. (2010) developed the NPAT that was introduced earlier in this chapter. The NPAT included categories of behaviors that were to be observed to determine the pain level for nonverbal adults in the ICU (see Figure 17-4). The interrater reliability of the tool in this study was ensured when “Two RNs, trained in the use and scoring of the NPAT, simultaneously observed a patient unable to verbalize his or her pain” (Klein et al., 2010, p. 523). Rating scales (discussed in detail later in this chapter) can be used for observation and for self-reporting. A rating scale allows the observer to rate the behavior or event on a scale. This method provides more information for analysis than the use of dichotomous data, which indicate only that the behavior either occurred or did not occur. The NPAT also included a rating scale in which each observational category was scored on a scale or 0 to 2 or 0 to 3 (see Figure 17-4). The tool resulted in a total score between 0 and 10, with 0 indicating no pain and 10 indicating the worst pain ever experienced by the patient (Klein et al., 2010). Interviews involve verbal communication during which the subject provides information to the researcher. Although this measurement strategy is most common in qualitative and descriptive studies, it also can be used in other types of studies. The various approaches to conducting interviews range from very unstructured interviews in which study participants control content (see Chapter 12) to interviews in which the participants respond to a questionnaire that the researcher has carefully designed (Waltz et al., 2010). Although most interviews are conducted face to face, telephone interviews are also commonly used. Using the interview method for measurement requires careful detailed work with a scientific approach. Excellent books are available on the techniques of developing interview questions (Briggs, 1986; Dillman, Smyth, & Christian, 2009; Dillon, 1990; Foddy, 1993; Fowler, 1990; Gorden, 1987, 1998; McLaughlin, 1990; Mishler, 1986). If you plan to use this strategy, consult a text on interview methodology before designing your instrument. Because nurses frequently use interview techniques in nursing assessment, the dynamics of interviewing are familiar; however, using this technique for measurement in research requires greater sophistication. After the research team has satisfactorily developed the interview protocol, team members need to pretest or pilot-test it on subjects similar to the individuals who will be included in their study. Pilot-testing allows the research team to identify problems in the design of questions, sequencing of questions, or procedure for recording responses. It also provides an opportunity to assess the reliability and validity of the interview instrument (Waltz et al., 2010). Data obtained from interviews are recorded, either during the interview or immediately afterward. The recording may be in the form of handwritten notes, video recordings, or audio recordings. If you hand-record your notes, you must have the skill to identify key ideas (or capture essential data) in an interview and concisely record this information. Data must be recorded without distracting the interviewee. Some interviewees have difficulty responding if it is obvious that the interviewer is taking notes or recording the conversation. In such a case, the interviewer may need to record data after completing the interview. If you wish to record the interview, you first must obtain IRB approval and then obtain the participant’s permission. Plan to prepare verbatim transcriptions of the recordings before data analysis. In some studies, researchers use content analysis to capture the meaning within the data (see Chapter 12).
Measurement Methods Used in Developing Evidence-Based Practice
 http://evolve.elsevier.com/Grove/practice/
Physiological Measurement
Obtaining Physiological Measures by Self-Report
Obtaining Physiological Measures by Observation
Obtaining Physiological Measures Directly or Indirectly
Obtaining Physiological Measures from Laboratory Tests
Obtaining Physiological Measures through Electronic Monitoring
Genetic Advancements in Measuring Nucleic Acids
Developing New Physiological Measures
Obtaining Physiological Measures across Time
Selecting a Physiological Measure
Reporting Physiological Measures in Studies
Observational Measurement
Structured Observations
Category Systems
Rating Scales
Interviews
Structured Interviews
Pilot-Testing the Interview Protocol
Recording Interview Data
![]()
Stay updated, free articles. Join our Telegram channel

Full access? Get Clinical Tree


Measurement Methods Used in Developing Evidence-Based Practice
Get Clinical Tree app for offline access
