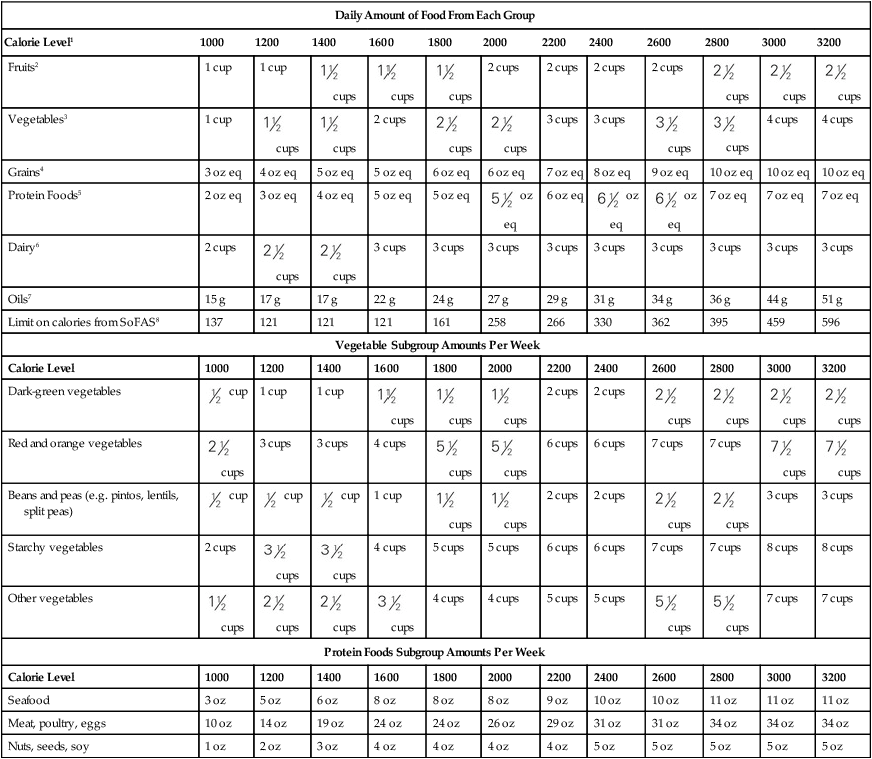
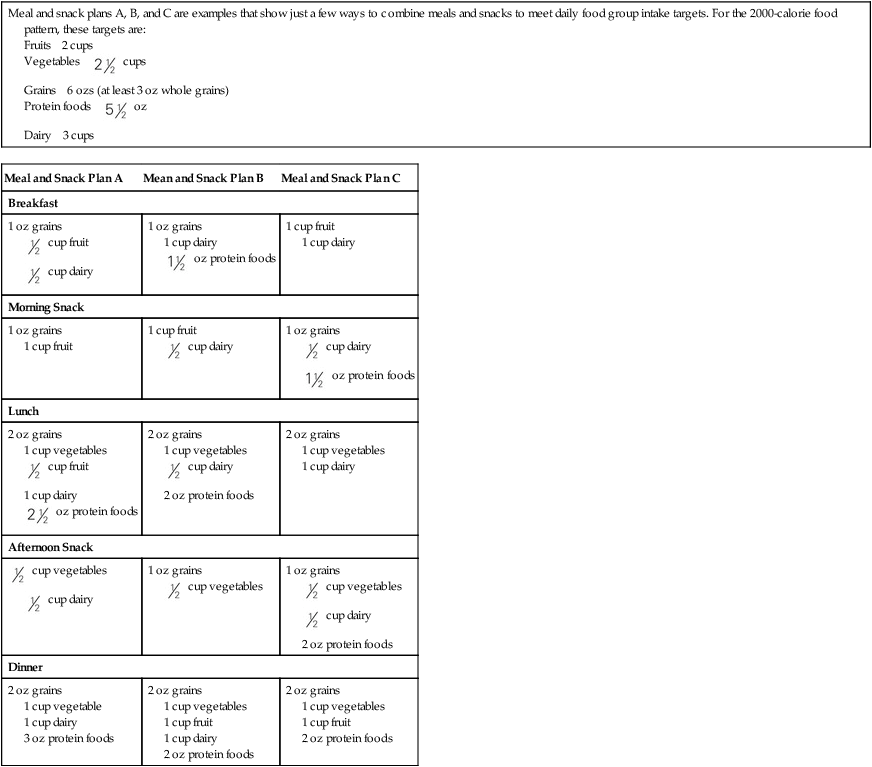
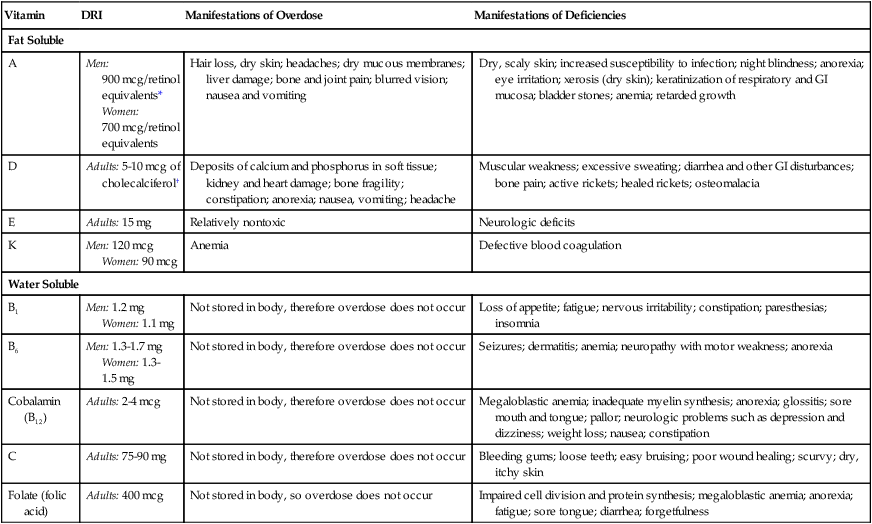
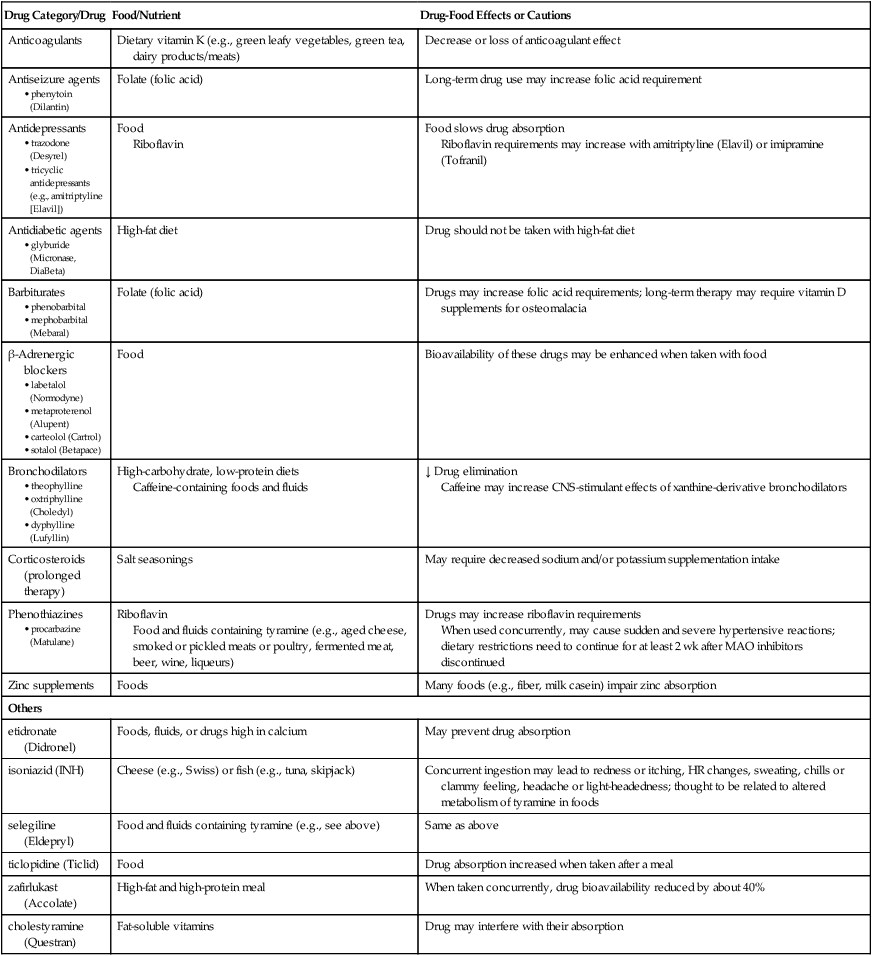
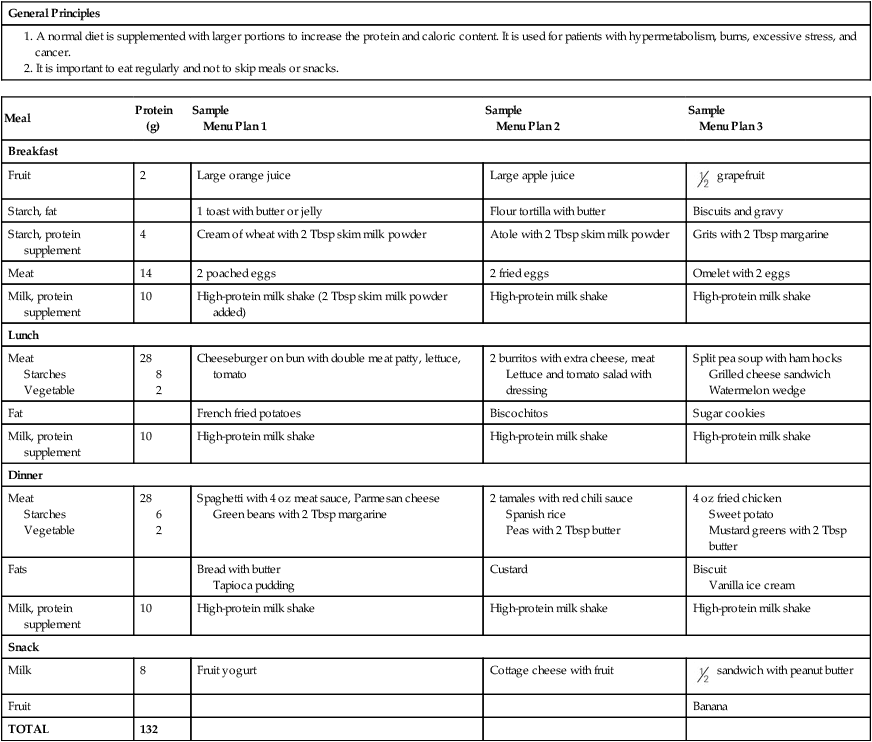
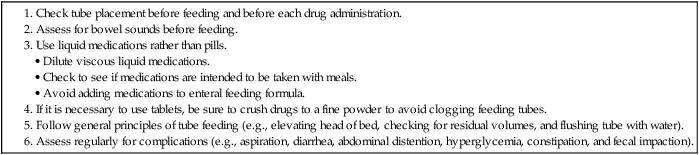
1. Relate the essential components of a well-balanced diet to their impact on health outcomes. 2. Describe the common etiologic factors, clinical manifestations, and management of malnutrition. 3. Describe the components of a nutritional assessment. 4. Explain the indications, complications, and nursing management principles related to the use of enteral nutrition. 5. Explain the indications, complications, and nursing management related to the use of parenteral nutrition. 6. Compare the etiologic factors, clinical manifestations, and nursing management of eating disorders. This chapter focuses on problems related to nutrition. A review of normal nutrition provides a basis for evaluating nutritional status. Malnutrition and types of supplemental nutrition, including enteral and parenteral nutrition, are discussed. Obesity is discussed in Chapter 41. Nutrition is the sum of processes by which one takes in and utilizes nutrients.1 Nutritional status can be viewed as a continuum from undernutrition to normal nutrition to overnutrition. An alteration in the process of nutrient intake or utilization can potentially cause nutritional problems. Nutritional problems occur in all age-groups, cultures, ethnic groups, and socioeconomic classes and across all educational levels. The nutritional status of a person or a family is influenced by many factors. Attitudes toward the importance of food and eating habits are established early. Cultural or religious preferences and requirements are frequently reflected in dietary intake. The financial status of a family or an individual may influence the type and amount of nutritionally sound food that can be purchased.2 Achieves adequate nutritional status Maintains adequate fluid volume Experiences no manifestations of infection BP, Blood pressure; IV, intravenous; PN, parenteral nutrition; WBC, white blood cell. †Other manifestations of electrolyte imbalances are discussed in Chapter 17. eTABLE 40-1 The Food Patterns suggest amounts of food to consume from the basic food groups, subgroups, and oils to meet recommended nutrient intakes at 12 different calorie levels. Nutrient and energy contributions from each group are calculated according to the nutrient-dense forms of foods in each group (e.g., lean meats and fat-free milk). The table also shows the number of calories from solid fats and added sugars (SoFAS) that can be accommodated within each calorie level, in addition to the suggested amounts of nutrient-dense forms of foods in each group. 1Calorie Levels are set across a wide range to accommodate the needs of different individuals. The attached table “Estimated Daily Calorie Needs” can be used to help assign individuals to the food pattern at a particular calorie level. 2Fruit Group includes all fresh, frozen, canned, and dried fruits and fruit juices. In general, 1 cup of fruit or 100% fruit juice, or 3Vegetable Group includes all fresh, frozen, canned, and dried vegetables and vegetable juices. In general, 1 cup of raw or cooked vegetables or vegetable juice, or 2 cups of raw leafy greens can be considered as 1 cup from the vegetable group. 4Grains Group includes all foods made from wheat, rice, oats, cornmeal, barley, such as bread, pasta, oatmeal, breakfast cereals, tortillas, and grits. In general, 1 slice of bread, 1 cup of ready-to-eat cereal, or 5Protein Foods Group includes meat, poultry, seafood, eggs, processed soy products, and nuts and seeds. In general, 1 ounce of lean meat, poultry, or seafood, 1 egg, 1 Tbsp peanut butter, or 6Dairy Group includes all milks, including lactose-free products and fortified soymilk (soy beverage), and foods made from milk that retain their calcium content, such as yogurt and cheese. Foods made from milk that have little to no calcium, such as cream cheese, cream, and butter, are not part of the group. Most dairy group choices should be fat-free or low-fat. In general, 1 cup of milk or yogurt, 7Oils include fats from many different plants and from fish that are liquid at room temperature, such as canola, corn, olive, soybean, and sunflower oil. Some foods are naturally high in oils, like nuts, olives, some fish, and avocados. Foods that are mainly oil include mayonnaise, certain salad dressings, and soft margarine. 8SoFAS are solid fats and added sugars. The limits for calories from SoFAS are the remaining amount of calories in each food pattern after selecting the specified amounts in each food group in nutrient-dense forms (forms that are fat-free or low-fat and with no added sugars). Source: From U.S. Department of Agriculture Center for Nutrition Policy and Promotion, USDA Food Patterns, September 2011. Accessed from www.cnpp.usda.gov/Publications/USDAFoodPatters/USD. eTABLE 40-2 SAMPLE MEAL PLANS FOR THE USDA FOOD PATTERN AT THE 2000-CALORIE LEVEL From: U.S. Department of Agriculture Center for Nutrition Policy and Promotion: Sample Meal Patterns for the USDA Food Pattern at the 2000 calorie level. Retrieved from http://www.cnpp.usda.gov/Publications/USDAFoodPatterns/SampleMealPatterns.pdf eTABLE 40-3 RECOMMENDED DIETARY REFERENCE INTAKES AND MANIFESTATIONS OF IMBALANCE DRI, Dietary Reference Intake; GI, gastrointestinal. *1 retinol equivalent = 10 international units vitamin A activity from β-carotene or 3.33 international units vitamin A activity from retinol. †1 mcg of cholecalciferol = 40 international units vitamin D. eTABLE 40-4 COMMON DRUG AND FOOD/NUTRIENT INTERACTIONS CNS, Central nervous system; HR, heart rate; MAO, monoamine oxidase. eTABLE 40-5 MANIFESTATIONS OF PROTEIN-CALORIE MALNUTRITION BUN, Blood urea nitrogen; PCM, protein-calorie malnutrition. eTABLE 40-6 NUTRITIONAL THERAPY eTABLE 40-7 NURSING MANAGEMENT OF FEEDING TUBES eTABLE 40-8 NURSING MANAGEMENT OF PARENTERAL NUTRITION INFUSIONS
Nursing Management
Nutritional Problems
Nutritional Problems
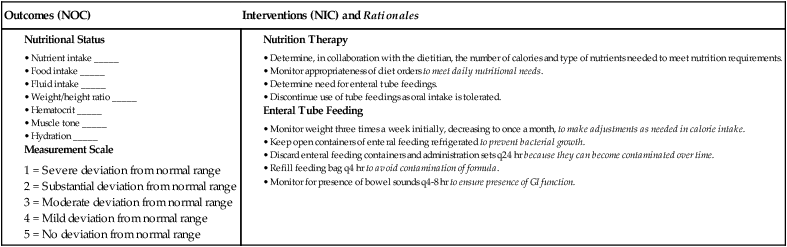
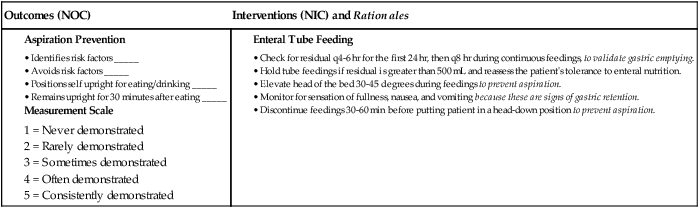
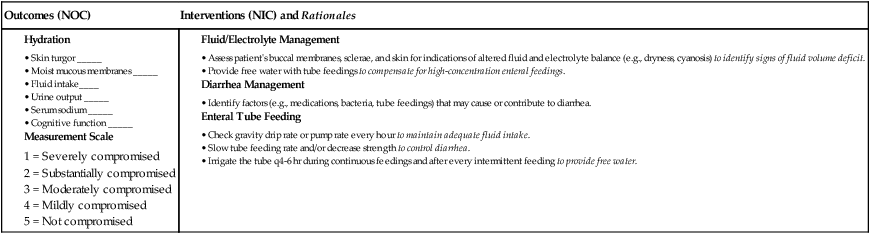
 eNursing Care Plan 40-1 Patient Receiving Enteral Nutrition
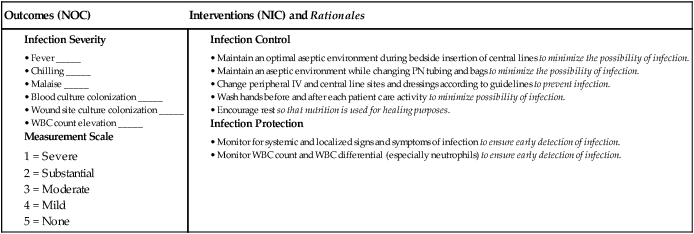
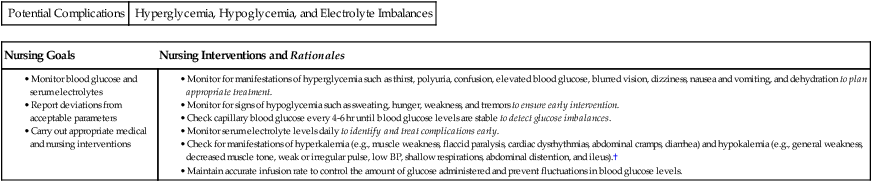
 eNursing Care Plan 40-2 Patient Receiving Parenteral Nutrition
Potential Complications
Hyperglycemia, Hypoglycemia, and Electrolyte Imbalances
Daily Amount of Food From Each Group
Calorie Level1
1000
1200
1400
1600
1800
2000
2200
2400
2600
2800
3000
3200
Fruits2
1 cup
1 cup
 cups
cups
 cups
cups
 cups
cups
2 cups
2 cups
2 cups
2 cups
 cups
cups
 cups
cups
 cups
cups
Vegetables3
1 cup
 cups
cups
 cups
cups
2 cups
 cups
cups
 cups
cups
3 cups
3 cups
 cups
cups
 cups
cups
4 cups
4 cups
Grains4
3 oz eq
4 oz eq
5 oz eq
5 oz eq
6 oz eq
6 oz eq
7 oz eq
8 oz eq
9 oz eq
10 oz eq
10 oz eq
10 oz eq
Protein Foods5
2 oz eq
3 oz eq
4 oz eq
5 oz eq
5 oz eq
 oz eq
oz eq
6 oz eq
 oz eq
oz eq
 oz eq
oz eq
7 oz eq
7 oz eq
7 oz eq
Dairy6
2 cups
 cups
cups
 cups
cups
3 cups
3 cups
3 cups
3 cups
3 cups
3 cups
3 cups
3 cups
3 cups
Oils7
15 g
17 g
17 g
22 g
24 g
27 g
29 g
31 g
34 g
36 g
44 g
51 g
Limit on calories from SoFAS8
137
121
121
121
161
258
266
330
362
395
459
596
Vegetable Subgroup Amounts Per Week
Calorie Level
1000
1200
1400
1600
1800
2000
2200
2400
2600
2800
3000
3200
Dark-green vegetables
 cup
cup
1 cup
1 cup
 cups
cups
 cups
cups
 cups
cups
2 cups
2 cups
 cups
cups
 cups
cups
 cups
cups
 cups
cups
Red and orange vegetables
 cups
cups
3 cups
3 cups
4 cups
 cups
cups
 cups
cups
6 cups
6 cups
7 cups
7 cups
 cups
cups
 cups
cups
Beans and peas (e.g. pintos, lentils, split peas)
 cup
cup
 cup
cup
 cup
cup
1 cup
 cups
cups
 cups
cups
2 cups
2 cups
 cups
cups
 cups
cups
3 cups
3 cups
Starchy vegetables
2 cups
 cups
cups
 cups
cups
4 cups
5 cups
5 cups
6 cups
6 cups
7 cups
7 cups
8 cups
8 cups
Other vegetables
 cups
cups
 cups
cups
 cups
cups
 cups
cups
4 cups
4 cups
5 cups
5 cups
 cups
cups
 cups
cups
7 cups
7 cups
Protein Foods Subgroup Amounts Per Week
Calorie Level
1000
1200
1400
1600
1800
2000
2200
2400
2600
2800
3000
3200
Seafood
3 oz
5 oz
6 oz
8 oz
8 oz
8 oz
9 oz
10 oz
10 oz
11 oz
11 oz
11 oz
Meat, poultry, eggs
10 oz
14 oz
19 oz
24 oz
24 oz
26 oz
29 oz
31 oz
31 oz
34 oz
34 oz
34 oz
Nuts, seeds, soy
1 oz
2 oz
3 oz
4 oz
4 oz
4 oz
4 oz
5 oz
5 oz
5 oz
5 oz
5 oz
 cup of dried fruit can be considered as 1 cup from the fruit group.
 cup of cooked rice, pasta, or cooked cereal can be considered as 1-ounce–equivalent from the grains group. At least half of all grains consumed should be whole grains.
 ounce of nuts or seeds can be considered as 1-ounce–equivalent from the protein foods group. Also,
  cup of beans or peas may be counted as 1-ounce–equivalent in this group.
 ounces of natural cheese, or 2 ounces of processed cheese can be considered as 1 cup from the dairy group.
ESTIMATED DAILY CALORIE NEEDS
To determine which food intake pattern to use for an individual, the following chart gives an estimate of individual calorie needs. The calorie range for each age/sex group is based on physical activity level, from sedentary to active.
Calorie Range
Sedentary
→
Active
Children
2-3 yr
1000
→
1400
Females
4-8 yr
1200
→
1800
9-13 yr
1600
→
2200
14-18 yr
1800
→
2400
19-30 yr
2000
→
2400
31-50 yr
1800
→
2200
51+ yr
1600
→
2200
Males
4-8 yr
1400
→
2000
9-13 yr
1800
→
2600
14-18 yr
2200
→
3200
19-30 yr
2400
→
3000
31-50 yr
2400
→
3000
51+ yr
2200
→
2800
Meal and snack plans A, B, and C are examples that show just a few ways to combine meals and snacks to meet daily food group intake targets. For the 2000-calorie food pattern, these targets are:
Meal and Snack Plan A
Mean and Snack Plan B
Meal and Snack Plan C
Breakfast
1 oz grains  cup fruit
 cup dairy
1 oz grains
1 cup dairy oz protein foods
1 cup fruit
1 cup dairy
Morning Snack
1 oz grains
1 cup fruit
1 cup fruit  cup dairy
1 oz grains  cup dairy
 oz protein foods
Lunch
2 oz grains
1 cup vegetables cup fruit
1 cup dairy oz protein foods
2 oz grains
1 cup vegetables cup dairy
2 oz protein foods
2 oz grains
1 cup vegetables
1 cup dairy
Afternoon Snack
 cup vegetables
 cup dairy
1 oz grains  cup vegetables
1 oz grains  cup vegetables
 cup dairy
2 oz protein foods
Dinner
2 oz grains
1 cup vegetable
1 cup dairy
3 oz protein foods
2 oz grains
1 cup vegetables
1 cup fruit
1 cup dairy
2 oz protein foods
2 oz grains
1 cup vegetables
1 cup fruit
2 oz protein foods
Vitamin
DRI
Manifestations of Overdose
Manifestations of Deficiencies
Fat Soluble
A
Men: 900 mcg/retinol equivalents*
Women: 700 mcg/retinol equivalents
Hair loss, dry skin; headaches; dry mucous membranes; liver damage; bone and joint pain; blurred vision; nausea and vomiting
Dry, scaly skin; increased susceptibility to infection; night blindness; anorexia; eye irritation; xerosis (dry skin); keratinization of respiratory and GI mucosa; bladder stones; anemia; retarded growth
D
Adults: 5-10 mcg of cholecalciferol†
Deposits of calcium and phosphorus in soft tissue; kidney and heart damage; bone fragility; constipation; anorexia; nausea, vomiting; headache
Muscular weakness; excessive sweating; diarrhea and other GI disturbances; bone pain; active rickets; healed rickets; osteomalacia
E
Adults: 15 mg
Relatively nontoxic
Neurologic deficits
K
Men: 120 mcg
Women: 90 mcg
Anemia
Defective blood coagulation
Water Soluble
B1
Men: 1.2 mg
Women: 1.1 mg
Not stored in body, therefore overdose does not occur
Loss of appetite; fatigue; nervous irritability; constipation; paresthesias; insomnia
B6
Men: 1.3-1.7 mg
Women: 1.3-1.5 mg
Not stored in body, therefore overdose does not occur
Seizures; dermatitis; anemia; neuropathy with motor weakness; anorexia
Cobalamin (B12)
Adults: 2-4 mcg
Not stored in body, therefore overdose does not occur
Megaloblastic anemia; inadequate myelin synthesis; anorexia; glossitis; sore mouth and tongue; pallor; neurologic problems such as depression and dizziness; weight loss; nausea; constipation
C
Adults: 75-90 mg
Not stored in body, therefore overdose does not occur
Bleeding gums; loose teeth; easy bruising; poor wound healing; scurvy; dry, itchy skin
Folate (folic acid)
Adults: 400 mcg
Not stored in body, so overdose does not occur
Impaired cell division and protein synthesis; megaloblastic anemia; anorexia; fatigue; sore tongue; diarrhea; forgetfulness
Drug Category/Drug
Food/Nutrient
Drug-Food Effects or Cautions
Anticoagulants
Dietary vitamin K (e.g., green leafy vegetables, green tea, dairy products/meats)
Decrease or loss of anticoagulant effect
Antiseizure agents
Folate (folic acid)
Long-term drug use may increase folic acid requirement
Antidepressants
Food
Riboflavin
Food slows drug absorption
Riboflavin requirements may increase with amitriptyline (Elavil) or imipramine (Tofranil)
Antidiabetic agents
High-fat diet
Drug should not be taken with high-fat diet
Barbiturates
Folate (folic acid)
Drugs may increase folic acid requirements; long-term therapy may require vitamin D supplements for osteomalacia
β-Adrenergic blockers
Food
Bioavailability of these drugs may be enhanced when taken with food
Bronchodilators
High-carbohydrate, low-protein diets
Caffeine-containing foods and fluids
↓ Drug elimination
Caffeine may increase CNS-stimulant effects of xanthine-derivative bronchodilators
Corticosteroids (prolonged therapy)
Salt seasonings
May require decreased sodium and/or potassium supplementation intake
Phenothiazines
Riboflavin
Food and fluids containing tyramine (e.g., aged cheese, smoked or pickled meats or poultry, fermented meat, beer, wine, liqueurs)
Drugs may increase riboflavin requirements
When used concurrently, may cause sudden and severe hypertensive reactions; dietary restrictions need to continue for at least 2 wk after MAO inhibitors discontinued
Zinc supplements
Foods
Many foods (e.g., fiber, milk casein) impair zinc absorption
Others
etidronate (Didronel)
Foods, fluids, or drugs high in calcium
May prevent drug absorption
isoniazid (INH)
Cheese (e.g., Swiss) or fish (e.g., tuna, skipjack)
Concurrent ingestion may lead to redness or itching, HR changes, sweating, chills or clammy feeling, headache or light-headedness; thought to be related to altered metabolism of tyramine in foods
selegiline (Eldepryl)
Food and fluids containing tyramine (e.g., see above)
Same as above
ticlopidine (Ticlid)
Food
Drug absorption increased when taken after a meal
zafirlukast (Accolate)
High-fat and high-protein meal
When taken concurrently, drug bioavailability reduced by about 40%
cholestyramine (Questran)
Fat-soluble vitamins
Drug may interfere with their absorption
Body System
Subclinical Manifestations
Clinical Manifestations
Integumentary
Slowed tissue turnover rate, surface temperature 1°-2° F cooler
Brittle nails, ↓ tone and elasticity of skin, xeroderma (dry skin), pigment changes (brown-gray), erythematous seborrheic dermatitis, scrotal dermatitis
Hair: easy loss of hair, color changes, lack of luster
Visual
Night blindness
Blood vessel growth in cornea, Bitot’s spots (gray keratinized epithelium on conjunctiva), dryness of conjunctiva and cornea, pale to red conjunctiva
Gastrointestinal
Mouth and lips
Reduction in saliva production
Cheilosis (crusting and ulceration at angle of mouth)
Tongue
Mucosa more permeable to bacteria
Raw and beefy red, edematous and smooth, atrophy or hypertrophy of papillae
Teeth
Improper development, delayed eruption
Cavities, loose teeth, discolored enamel
Gingivae
Periodontal disease, tendency to bleed easily, receding, pale, and soft
Stomach
↓ Gastric secretion, delayed gastric emptying
Constant hunger, ↑ incidence of ulcers
Intestines
↓ Motility and absorption, normal flora causing infection from ↑ permeability of mucosa
Diarrhea and flatulence, protruding abdomen, ↑ incidence of parasitic diseases
Liver-biliary
Fatty liver, ↓ absorption of fat-soluble vitamins
Hepatomegaly
Cardiovascular
↓ Cardiac output, ↓ hemoglobin, shift in heart position, ↑ risk of thrombophlebitis
↓ BP and pulse, slight cyanosis, anemia, body edema
Endocrine
↓ Insulin production
Thyroid enlargement, polydipsia, polyuria, ↓ sensitivity to cold
Immunologic
↓ Lymphocyte proliferation, ↓ albumin levels, ↓ acute-phase protein production, ↓ antibody production, diminished febrile response to infection
↑ Number of infections, ↓ response to delayed hypersensitivity skin tests
Musculoskeletal
↓ Growth rate, ↓ body stature with chronic PCM, ↓ muscle mass
Prominence of bony structures such as face, clavicle, scapula, ribs, iliac crests, and spinal vertebrae caused by subcutaneous tissue loss; weak and spindly arms and legs, flat buttocks, weak and flabby muscles; ↓ physical activity and ability to work; severe weight loss
Neurologic
Loss of ambition, feeling of being tired
Depression, confusion, ↓ reflexes in legs and ankles, ↓ position sense, ↓ vibratory sense, paresthesias of hands and feet, syncope, motor weakness
Renal
Negative nitrogen balance, ↓ BUN and creatinine levels
Nocturia, ↓ urinary output
Reproductive
↓ Gonadotropin levels
Amenorrhea, impotence, atrophied breasts
Respiratory
Pulmonary edema, ↓ strength of respiratory muscles
↑ Susceptibility to respiratory infection, ↓ respiratory rate, ↓ vital capacity
High-Calorie, High-Protein Diet
General Principles
Meal
Protein (g)
Sample
Menu Plan 1
Sample
Menu Plan 2
Sample
Menu Plan 3
Breakfast
Fruit
2
Large orange juice
Large apple juice
 grapefruit
Starch, fat
1 toast with butter or jelly
Flour tortilla with butter
Biscuits and gravy
Starch, protein supplement
4
Cream of wheat with 2 Tbsp skim milk powder
Atole with 2 Tbsp skim milk powder
Grits with 2 Tbsp margarine
Meat
14
2 poached eggs
2 fried eggs
Omelet with 2 eggs
Milk, protein supplement
10
High-protein milk shake (2 Tbsp skim milk powder added)
High-protein milk shake
High-protein milk shake
Lunch
Meat
Starches
Vegetable
28
8
2
Cheeseburger on bun with double meat patty, lettuce, tomato
2 burritos with extra cheese, meat
Lettuce and tomato salad with dressing
Split pea soup with ham hocks
Grilled cheese sandwich
Watermelon wedge
Fat
French fried potatoes
Biscochitos
Sugar cookies
Milk, protein supplement
10
High-protein milk shake
High-protein milk shake
High-protein milk shake
Dinner
Meat
Starches
Vegetable
28
6
2
Spaghetti with 4 oz meat sauce, Parmesan cheese
Green beans with 2 Tbsp margarine
2 tamales with red chili sauce
Spanish rice
Peas with 2 Tbsp butter
4 oz fried chicken
Sweet potato
Mustard greens with 2 Tbsp butter
Fats
Bread with butter
Tapioca pudding
Custard
Biscuit
Vanilla ice cream
Milk, protein supplement
10
High-protein milk shake
High-protein milk shake
High-protein milk shake
Snack
Milk
8
Fruit yogurt
Cottage cheese with fruit
 sandwich with peanut butter
Fruit
Banana
TOTAL
132
 cups
cups oz
oz


