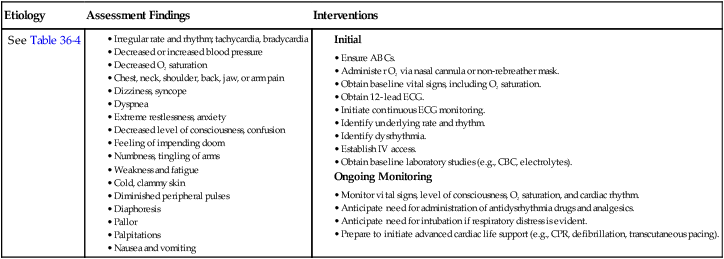
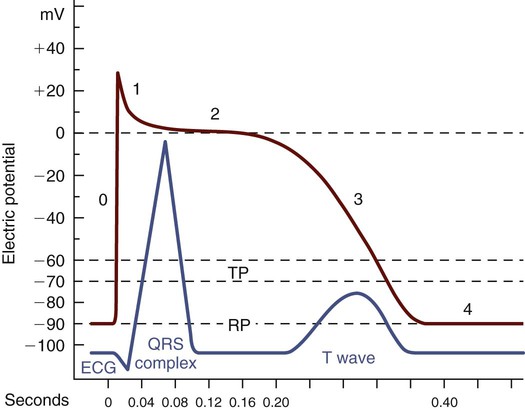
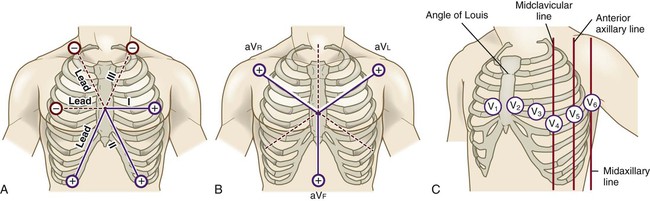
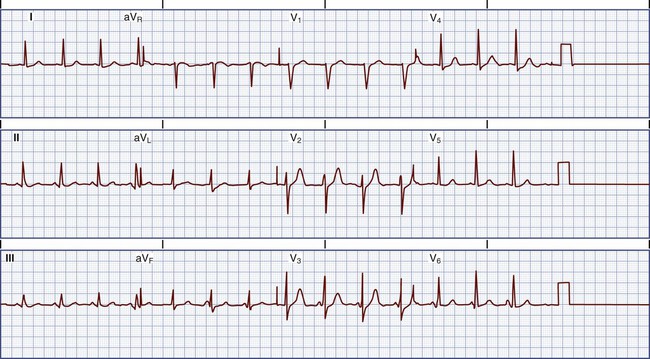
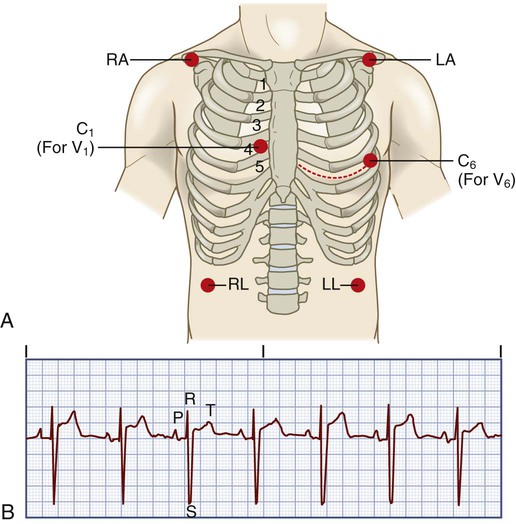
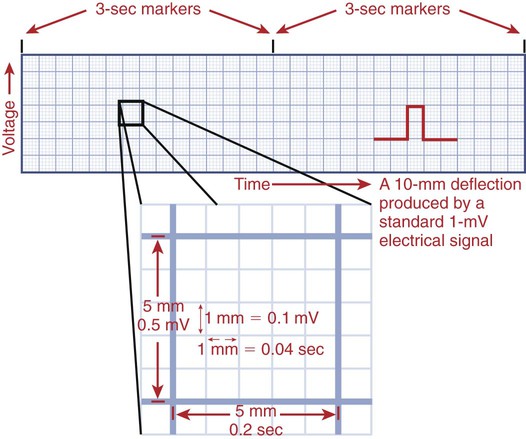
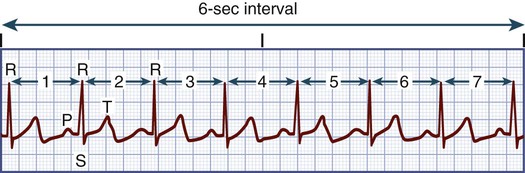
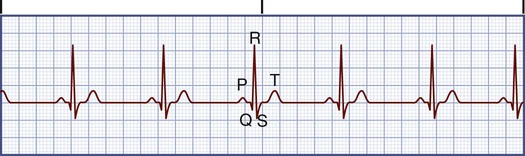
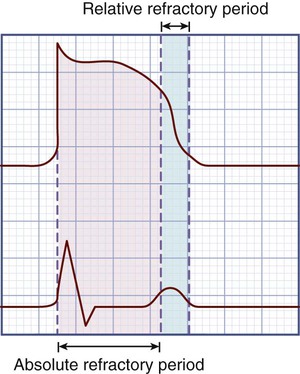
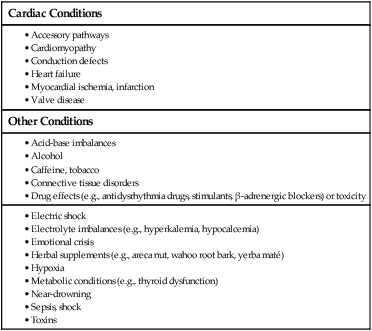
Chapter 36 1. Examine the nursing management of patients requiring continuous electrocardiographic (ECG) monitoring. 2. Differentiate the clinical characteristics and ECG patterns of normal sinus rhythm, common dysrhythmias, and acute coronary syndrome (ACS). 3. Compare the nursing and collaborative management of patients with common dysrhythmias and ECG changes associated with ACS. 4. Differentiate between defibrillation and cardioversion, including indications for use and physiologic effects. 5. Describe the management of patients with pacemakers and implantable cardioverter-defibrillators. 6. Select appropriate interventions for patients undergoing electrophysiologic testing and radiofrequency catheter ablation therapy. Your ability to recognize normal and abnormal cardiac rhythms, called dysrhythmias, is an essential nursing skill.1 Prompt assessment of dysrhythmias and the patient’s response to the rhythm is critical. Four properties of cardiac cells enable the conduction system to start an electrical impulse, send it through the cardiac tissue, and stimulate muscle contraction (Table 36-1). The heart’s conduction system consists of specialized neuromuscular tissue located throughout the heart (Fig. 32-4, A). A normal cardiac impulse begins in the sinoatrial (SA) node in the upper right atrium. It spreads over the atrial myocardium via interatrial and internodal pathways, causing atrial contraction. The impulse then travels to the atrioventricular (AV) node, through the bundle of His, and down the left and right bundle branches. It ends in the Purkinje fibers, which transmit the impulse to the ventricles. TABLE 36-1 eTABLE 36-1 The pacemaker code is written in a five-letter format as in the table below, using no more letters than necessary. VVI, Ventricle paced, ventricle sensed; pacing inhibited if beat sensed. VVIR, Demand ventricular pacing with physiologic response to exercise. DDD, Atrium and ventricle can both be paced, atrium and ventricle both sensed. Pacing triggered in each chamber if beat not sensed. DDDR, Dual-chamber paced, dual-chamber sensed, dual response, rate-modulated device. The membrane of a cardiac cell is semipermeable. This allows it to maintain a high concentration of potassium and a low concentration of sodium inside the cell. Outside the cell a high concentration of sodium and a low concentration of potassium exist. The inside of the cell, when at rest, or in the polarized state, is negative compared with the outside. When a cell or groups of cells are stimulated, the cell membrane changes its permeability. This allows sodium to move rapidly into the cell, making the inside of the cell positive compared with the outside (depolarization). A slower movement of ions across the membrane restores the cell to the polarized state, called repolarization. Fig. 36-1 describes the phases of the cardiac action potential. The ECG has 12 recording leads. Six of the leads measure electrical forces in the frontal plane. These are bipolar (positive or negative) leads I, II, and III; and unipolar (positive) leads aVr, aVl, and aVf (Fig. 36-2, A and B). The remaining six unipolar leads (V1 through V6) measure the electrical forces in the horizontal plane (precordial leads) (Fig. 36-2, C). The 12-lead ECG may show changes suggesting structural changes, conduction disturbances, damage (e.g., ischemia, infarction), electrolyte imbalance, or drug toxicity. Obtaining 12 ECG views of the heart is also helpful in the assessment of dysrhythmias. Fig. 36-3 is an example of a normal 12-lead ECG. One or more ECG leads can be used to continuously monitor a patient. The most common leads selected are leads II and V1 (Fig. 36-4). A modified chest lead (MCL1) is used when only three leads are available for monitoring (eFig. 36-1, showing MCL1 lead placement, is available on the website for this chapter). MCL1 is similar to V1. Accurate interpretation of an ECG depends on the correct placement of the leads on the patient. The monitoring leads used are determined by the patient’s clinical status.3,4 To correctly interpret an ECG, you measure time and voltage on the ECG paper. ECG paper consists of large (heavy lines) and small (light lines) squares (Fig. 36-5). Each large square consists of 25 smaller squares (five horizontal and five vertical). Horizontally, each small square (1 mm) represents 0.04 second. This means that one large square equals 0.20 second and that 300 large squares equal 1 minute. Vertically, each small square (1 mm) represents 0.1 millivolt (mV). This means that one large square equals 0.5 mV. Use these squares to calculate the heart rate (HR) and measure time intervals for the different ECG complexes. You can use a variety of methods to calculate the HR from an ECG. The most accurate way is to count the number of QRS complexes in 1 minute. However, because this method is time consuming, a simpler process is used. Note that every 3 seconds a marker appears on the ECG paper (see Fig. 36-5). Count the number of R-R intervals in 6 seconds and multiply that number by 10. (An R wave is the first upward [or positive] wave of the QRS complex.) This is the estimated number of beats per minute (Fig. 36-6). Another method is to count the number of small squares between one R-R interval. Divide this number into 1500 to get the HR. Last, you can count the number of large squares between one R-R interval and divide this number into 300 to get the HR (see Fig. 36-6). All these methods are most accurate when the rhythm is regular.1 You will see artifact on the monitor when leads and electrodes are not secure, or when there is muscle activity (e.g., shivering) or electrical interference. Artifact is a distortion of the baseline and waveforms seen on the ECG (Fig. 36-7). Accurate interpretation of heart rhythm is difficult when artifact is present. If artifact occurs, check the connections in the equipment. You may need to replace the electrodes if the conductive gel has dried out. Normal sinus rhythm refers to a rhythm that starts in the SA node at a rate of 60 to 100 times per minute and follows the normal conduction pathway (Fig. 36-8). Fig. 36-9 shows the components of a normal ECG tracing. Table 36-2 describes ECG waveforms and intervals, normal durations, and possible sources of disturbances in these features. TABLE 36-2 *Heart rate influences the duration of these intervals, especially those of the PR and QT intervals (e.g., QT interval shortens in duration as heart rate increases). Dysrhythmias result from disorders of impulse formation, conduction of impulses, or both. The heart has specialized cells in the SA node, atria, AV node, and bundle of His and Purkinje fibers (His-Purkinje system), which can fire (discharge) spontaneously. This is termed automaticity. Normally, the SA node is the pacemaker of the heart. It spontaneously fires 60 to 100 times per minute (Table 36-3). A secondary pacemaker from another site may fire in two ways. If the SA node fires more slowly than a secondary pacemaker, the electrical signals from the secondary pacemaker may “escape.” The secondary pacemaker will then fire automatically at its intrinsic rate. These secondary pacemakers may start from the AV node at a rate of 40 to 60 times per minute or the His-Purkinje system at a rate of 20 to 40 times per minute. TABLE 36-3 INTRINSIC RATES OF THE CONDUCTION SYSTEM The impulse started by the SA node or an ectopic focus must be conducted to the entire heart. The property of myocardial tissue that allows it to be depolarized by a stimulus is called excitability. This is an important part of the transmission of the impulse from one cell to another. The level of excitability is determined by the length of time after depolarization that the tissues can be restimulated. The recovery period after stimulation is the refractory phase or period. The absolute refractory phase or period occurs when excitability is zero and the heart cannot be stimulated. The relative refractory period occurs slightly later in the cycle, and excitability is more likely. In states of full excitability, the heart is completely recovered. Fig. 36-10 shows the relationship between the refractory period and the ECG. Dysrhythmias occur as the result of various abnormalities and disease states. The cause of a dysrhythmia influences the patient’s treatment. Table 36-4 presents common causes of dysrhythmias. Table 36-5 presents a systematic approach to assessing a heart rhythm. TABLE 36-5 APPROACH TO ASSESSING HEART RHYTHM 1. Look for the P wave. Is it upright or inverted? Is there one for every QRS complex or more than one? Are atrial fibrillatory or flutter waves present? 2. Evaluate the atrial rhythm. Is it regular or irregular? 4. Measure the duration of the PR interval. Is it normal duration or prolonged? 5. Evaluate the ventricular rhythm. Is it regular or irregular? 6. Calculate the ventricular rate. 7. Measure the duration of the QRS complex. Is it normal duration or prolonged? 8. Assess the ST segment. Is it isoelectric (flat), elevated, or depressed? 9. Measure the duration of the QT interval. Is it normal duration or prolonged? Dysrhythmias occurring in nonmonitored settings present management challenges. If the patient becomes symptomatic (e.g., chest pain), determination of the rhythm by cardiac monitoring is a high priority. Activate the emergency medical services (EMS) system. Table 36-6 outlines emergency care of the patient with a dysrhythmia. EMERGENCY MANAGEMENT In addition to continuous ECG monitoring during hospitalization, several other tests can assess dysrhythmias and the effectiveness of antidysrhythmia drug therapy. An electrophysiologic study, Holter monitoring, event monitoring (or loop recorder), exercise treadmill testing, and signal-averaged ECG can be performed on an inpatient or outpatient basis (see Table 32-6 for nursing care related to these tests). The signal-averaged ECG identifies late potentials strongly suggesting that the patient may be at risk for developing serious ventricular dysrhythmias. Chapter 32 discusses the diagnostic procedures for assessment of the cardiovascular system and related nursing care. Figs. 36-11 to 36-19 provide examples of the ECG tracings of common dysrhythmias. Table 36-7 presents the descriptive characteristics. TABLE 36-7 CHARACTERISTICS OF COMMON DYSRHYTHMIAS In sinus bradycardia the conduction pathway is the same as that in sinus rhythm but the SA node fires at a rate less than 60 beats/minute (Fig. 36-11, A). Symptomatic bradycardia refers to an HR that is less than 60 beats/minute and is inadequate for the patient’s condition, causing the patient to experience symptoms (e.g., chest pain, syncope).
Nursing Management
Dysrhythmias
Rhythm Identification and Treatment
Conduction System
Property
Definition
Automaticity
Ability to initiate an impulse spontaneously and continuously
Excitability
Ability to be electrically stimulated
Conductivity
Ability to transmit an impulse along a membrane in an orderly manner
Contractility
Ability to respond mechanically to an impulse
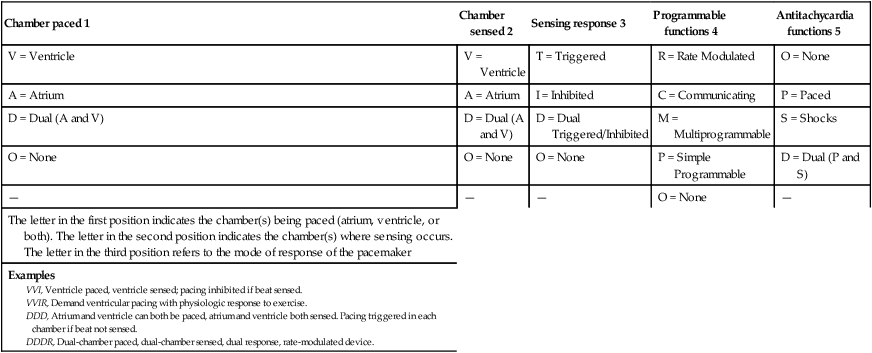
Chamber paced 1
Chamber sensed 2
Sensing response 3
Programmable functions 4
Antitachycardia functions 5
V = Ventricle
V = Ventricle
T = Triggered
R = Rate Modulated
O = None
A = Atrium
A = Atrium
I = Inhibited
C = Communicating
P = Paced
D = Dual (A and V)
D = Dual (A and V)
D = Dual Triggered/Inhibited
M = Multiprogrammable
S = Shocks
O = None
O = None
O = None
P = Simple Programmable
D = Dual (P and S)
—
—
—
O = None
—
The letter in the first position indicates the chamber(s) being paced (atrium, ventricle, or both). The letter in the second position indicates the chamber(s) where sensing occurs. The letter in the third position refers to the mode of response of the pacemaker
Examples
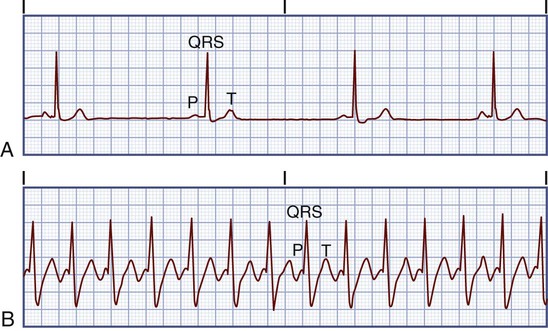
Electrocardiographic Monitoring
Assessment of Cardiac Rhythm
Description
Normal Duration (sec)
Source of Possible Variation
P Wave
Represents time for the passage of the electrical impulse through the atrium causing atrial depolarization (contraction). Should be upright.
0.06-0.12
Disturbance in conduction within atria
PR Interval
Measured from beginning of P wave to beginning of QRS complex. Represents time taken for impulse to spread through the atria, AV node and bundle of His, bundle branches, and Purkinje fibers, to a point immediately preceding ventricular contraction.
0.12-0.20
Disturbance in conduction usually in AV node, bundle of His, or bundle branches but can be in atria as well
QRS Complex
Q wave: First negative (downward) deflection after the P wave, short and narrow, not present in several leads.
<0.03
MI may result in development of a pathologic Q wave that is wide ( ≥0.03 sec) and deep ( ≥25% of the height of the R wave)
R wave: First positive (upward) deflection in the QRS complex.
Not usually measured
S wave: First negative (downward) deflection after the R wave.
Not usually measured
QRS Interval
Measured from beginning to end of QRS complex. Represents time taken for depolarization (contraction) of both ventricles (systole).
<0.12
Disturbance in conduction in bundle branches or in ventricles
ST Segment
Measured from the S wave of the QRS complex to the beginning of the T wave. Represents the time between ventricular depolarization and repolarization (diastole). Should be isoelectric (flat).
0.12
Disturbances (e.g., elevation, depression) usually caused by ischemia, injury, or infarction
T Wave
Represents time for ventricular repolarization. Should be upright.
0.16
Disturbances (e.g., tall, peaked; inverted) usually caused by electrolyte imbalances, ischemia, or infarction
QT Interval
Measured from beginning of QRS complex to end of T wave. Represents time taken for entire electrical depolarization and repolarization of the ventricles.
0.34-0.43
Disturbances usually affecting repolarization more than depolarization and caused by drugs, electrolyte imbalances, and changes in heart rate

Electrophysiologic Mechanisms of Dysrhythmias
Part of Conduction System
Rate
SA node
60-100 times/min
AV node
40-60 times/min
Bundle of His, Purkinje fibers
20-40 times/min
Evaluation of Dysrhythmias
When assessing a heart rhythm, use a consistent and systematic approach. One such approach includes the following:
Additional questions to consider include the following:
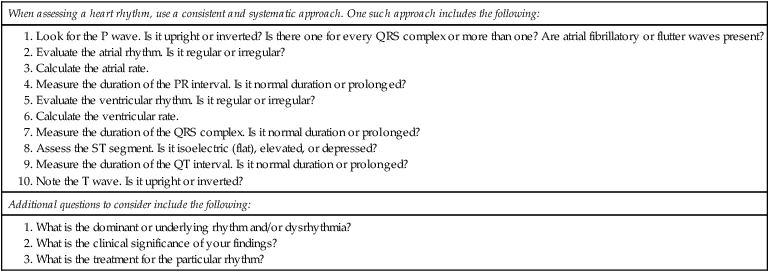
 TABLE 36-6
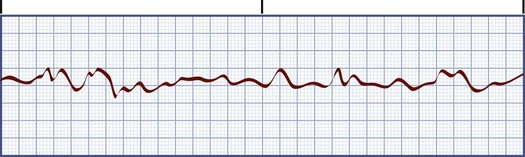
Dysrhythmias
Types of Dysrhythmias
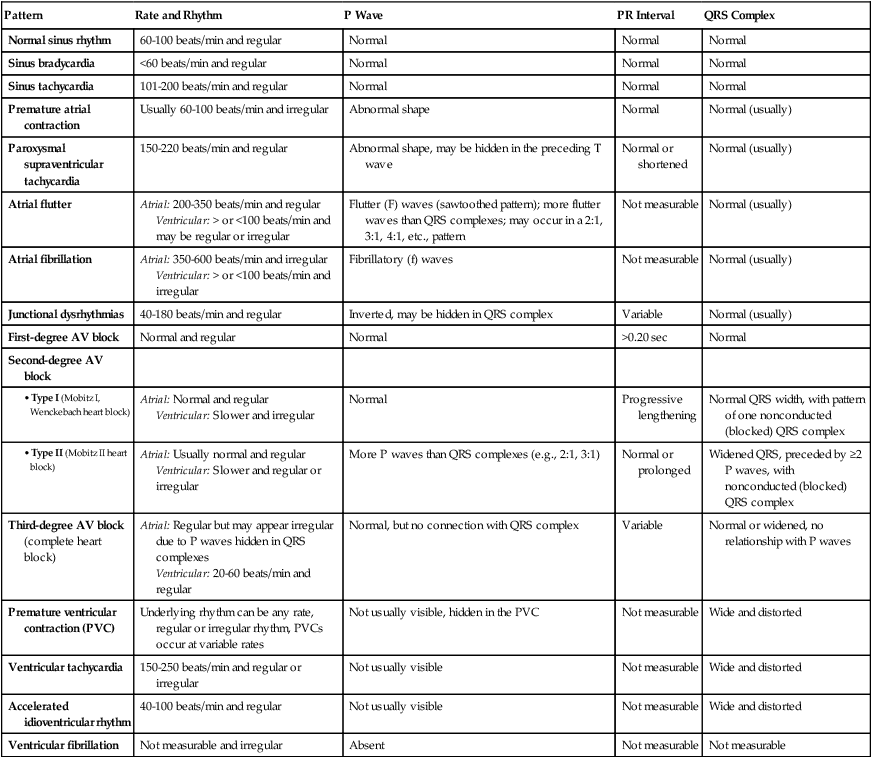
Pattern
Rate and Rhythm
P Wave
PR Interval
QRS Complex
Normal sinus rhythm
60-100 beats/min and regular
Normal
Normal
Normal
Sinus bradycardia
<60 beats/min and regular
Normal
Normal
Normal
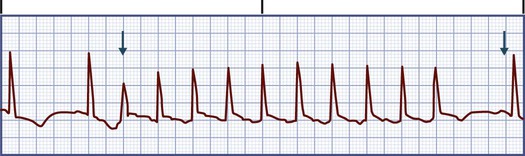
Sinus tachycardia
101-200 beats/min and regular
Normal
Normal
Normal
Premature atrial contraction
Usually 60-100 beats/min and irregular
Abnormal shape
Normal
Normal (usually)
Paroxysmal supraventricular tachycardia
150-220 beats/min and regular
Abnormal shape, may be hidden in the preceding T wave
Normal or shortened
Normal (usually)
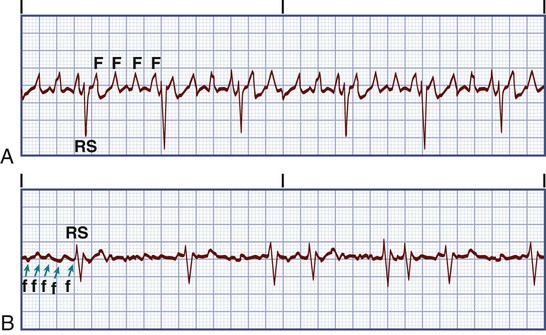
Atrial flutter
Atrial: 200-350 beats/min and regular
Ventricular: > or <100 beats/min and may be regular or irregular
Flutter (F) waves (sawtoothed pattern); more flutter waves than QRS complexes; may occur in a 2:1, 3:1, 4:1, etc., pattern
Not measurable
Normal (usually)
Atrial fibrillation
Atrial: 350-600 beats/min and irregular
Ventricular: > or <100 beats/min and irregular
Fibrillatory (f) waves
Not measurable
Normal (usually)
Junctional dysrhythmias
40-180 beats/min and regular
Inverted, may be hidden in QRS complex
Variable
Normal (usually)
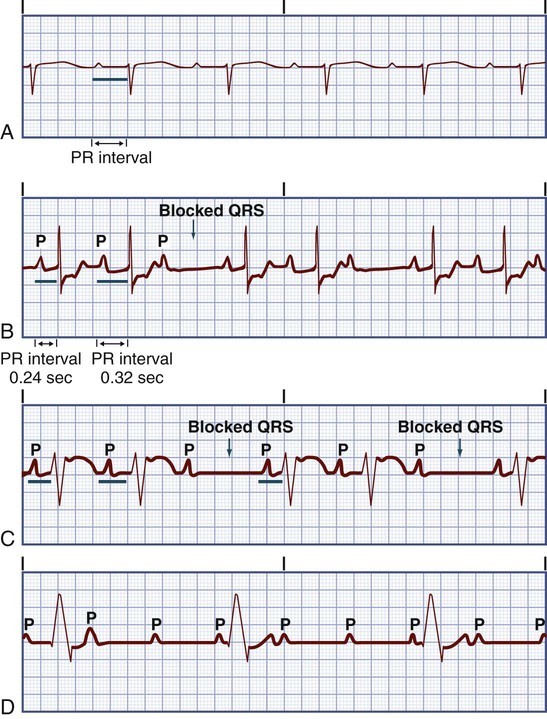
First-degree AV block
Normal and regular
Normal
>0.20 sec
Normal
Second-degree AV block
Atrial: Normal and regular
Ventricular: Slower and irregular
Normal
Progressive lengthening
Normal QRS width, with pattern of one nonconducted (blocked) QRS complex
Atrial: Usually normal and regular
Ventricular: Slower and regular or irregular
More P waves than QRS complexes (e.g., 2:1, 3:1)
Normal or prolonged
Widened QRS, preceded by ≥2 P waves, with nonconducted (blocked) QRS complex
Third-degree AV block (complete heart block)
Atrial: Regular but may appear irregular due to P waves hidden in QRS complexes
Ventricular: 20-60 beats/min and regular
Normal, but no connection with QRS complex
Variable
Normal or widened, no relationship with P waves
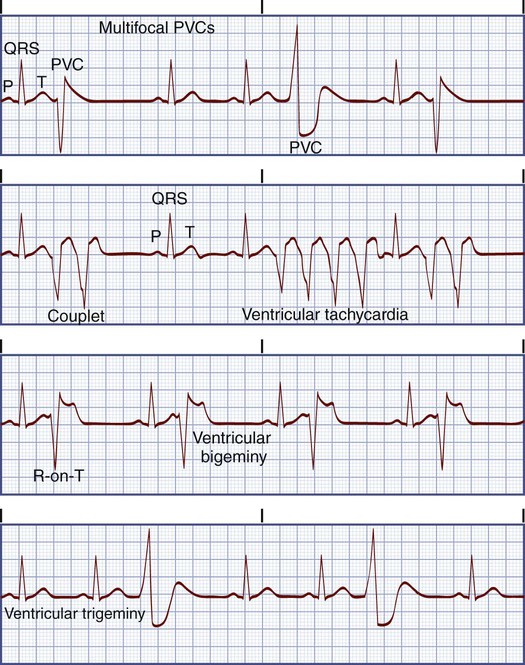
Premature ventricular contraction (PVC)
Underlying rhythm can be any rate, regular or irregular rhythm, PVCs occur at variable rates
Not usually visible, hidden in the PVC
Not measurable
Wide and distorted
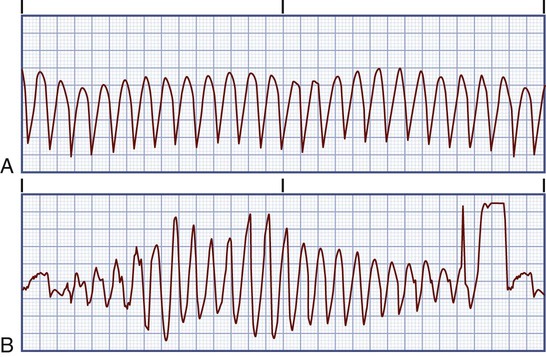
Ventricular tachycardia
150-250 beats/min and regular or irregular
Not usually visible
Not measurable
Wide and distorted
Accelerated idioventricular rhythm
40-100 beats/min and regular
Not usually visible
Not measurable
Wide and distorted
Ventricular fibrillation
Not measurable and irregular
Absent
Not measurable
Not measurable
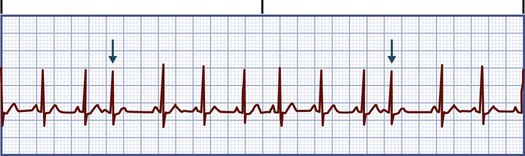
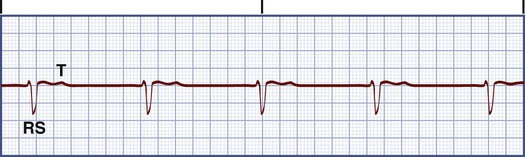
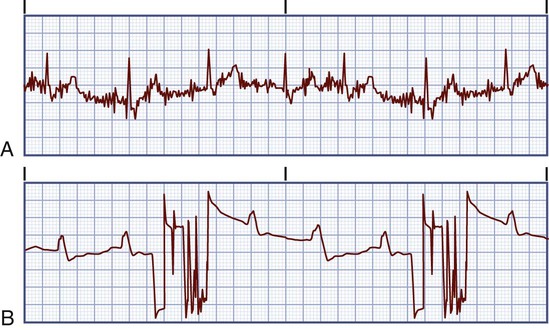
Sinus Bradycardia.
![]()
Stay updated, free articles. Join our Telegram channel

Full access? Get Clinical Tree


Nursing Management: Dysrhythmias
Get Clinical Tree app for offline access
