The rules that determine which wave is which are as follows, remembering that not all of these waves may be seen in all leads or indeed, be present.
- The small, generally positive (i.e. above the baseline) wave just before the main complex is the P wave.
- If the first deflection of the main complex is negative (i.e. below the baseline) this is the Q wave.
- If the first deflection of the main complex is positive, then it is the R wave. Otherwise the R wave is the first positive deflection after the Q wave.
- The S wave is a downward deflection following the R wave. This may not always go below the baseline.
- The final, normally positive, deflection in the complex is the T wave.
Relating these waves to activity within the heart, the P wave is produced by atrial depolarisation, the QRS by ventricular depolarisation and the T wave by repolarisation in the ventricles.
When reading a 12-lead ECG a systematic approach makes it easier to describe any changes and reduces the likelihood of changes being missed. First, decide what the heart rhythm is by answering five questions.
- What is the QRS rate?
- Is the QRS rhythm regular or irregular?
- Is the QRS width normal or broad?
- Is atrial activity present? If so, are these P waves? Is there other atrial activity?
- How is atrial activity related to ventricular activity?
The QRS rate can be determined by counting how many large squares on the ECG paper there are between each QRS complex and dividing this into 300, or by taking the patient’s pulse. It is unwise to rely on a machine estimate of the heart rate, e.g. from an oximeter or an ECG monitor. The normal heart rate should be between 50 and 100 beats per minute. Generally, tachycardias above 150 are abnormal tachycardias. Bradycardias below 40 are generally abnormal, although people who exercise regularly may have slow resting heart rates.
The QRS rate should be grossly regular. A slight irregularity associated with respiration is normal, but obvious irregularity may be due to atrial fibrillation, ectopic beats or heart block.
The duration of the QRS complex, from the start of the Q wave to the end of the S wave should be less than 120 milliseconds. This is three small squares on the ECG paper. If the complex is longer than this, there may be a bundle branch block.
P waves are normally organised and easy to see. If there are no obvious P waves and the baseline between the complexes is irregular or flat, the rhythm is most likely to be atrial fibrillation. P waves, either normal-looking or sawtooth in appearance at a rate of one every small square on the ECG paper (300 per minute), are a sign of atrial flutter. Atrial activity is usually best seen in leads II or V1.
There should normally be one P wave for each QRS complex. More than one is suggestive of a heart block.
Having established the heart rhythm, the next step in interpreting a 12-lead ECG is to look at each lead in turn. Each of the 12 leads of the ECG can be thought of as providing an electrical “view” of the heart. The views provided by these leads are:
- leads II, III and aVF look at the inferior surface of the heart
- lead I looks at the antero-apical surface of the heart
- lead aVL looks at the left lateral side of the heart
- lead V1 looks at the atria, leads V2,3,4 at the intraventricular septum, leads V5,6 at the lateral surface of the heart
- lead aVR is an unusual lead, but ST segment elevation in this is a marker of widespread myocardial ischaemia (Williamson et al., 2006).
When looking at each lead in turn:
- look at the ST segments, are these elevated or depressed? T waves, are these upright, flat or inverted? Look for pathological Q waves. When inspecting the T waves it is useful to note that they should be the same way around as the QRS complex, i.e. it is normal for the T wave to be inverted in lead aVr as the QRS is negative and at times in leads III and V1
- if the QRS duration is prolonged, decide whether there is a right bundle branch block (large R wave in V1 or V2) or left bundle branch block (large R wave in V5 or V6)
- look at the chest leads for normal R wave progression
- estimate the electrical axis. Look at leads I and II: these should be positive. If lead I is mainly negative there is right axis deviation, if lead II is mainly negative, left axis deviation.
In general, significant ST segment elevation indicates acute myocardial injury, such as a myocardial infarction (STEMI). Significant ST segment elevation is defined as being 1 mm or more above the baseline in the limb leads (leads I, II, III, aVR, aVL, aVF) or 2 mm or more in the chest leads (leads V1 to V6). ST segment elevation myocardial infarction is shown by significant ST elevation in two or more contiguous leads. That is, in leads looking at the same part of the heart: leads II, II or aVF, leads I or aVL or adjacent leads in leads V1 to V6 (Thygesen et al., 2007).
ST segment depression is a sign of ischaemia. T waves that are flattened or inverted may indicate recent myocardial damage, although some drugs, such as digoxin, can cause changes in the T waves. Deeply inverted T waves may indicate a partial thickness or sub-endocardial myocardial infarction (NSTEMI).
Pathological Q waves may be defined to be longer than 30 milliseconds (1/2 small squares of the ECG paper) or deeper than 2 mm (two small squares of the ECG paper). In health, there is often a deep Q wave in lead III, but this can disappear on deep inspiration. Pathological Q waves indicate myocardial necrosis, either recent or healed.
New left or right bundle branch block may indicate myocardial damage. Left bundle branch block makes diagnosing myocardial infarction from the ECG difficult.
Normally in the chest leads, there is no R wave in V1 but it will be present in V3 and get bigger in each lead round to V6. If there is no R wave in V3 and V4, it is equivalent to having Q waves in the chest leads, indicating recent or healed myocardial necrosis.
The cardiac axis may be shifted to the right or left by a variety of conditions including pulmonary embolus, cardiomyopathy and bundle branch block.
ECGs in Acute Coronary Syndromes
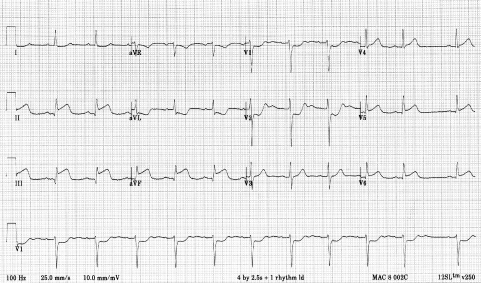
Figure 4.2 Infero-lateral ST segment elevation myocardial infarction. The rhythm is sinus with a short sino-atrial pause just before the last complex on the ECG. There is ST segment elevation in leads II, III, aVF, V5 and V6. There is ST depression in leads I, aVL, V1 and V2. There is a pathological Q wave in lead III.

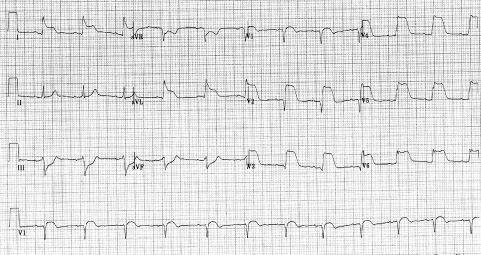
Figure 4.3 Extensive antero-lateral ST segment elevation myocardial infarction. The rhythm is sinus. There is ST segment elevation in leads I, aVL, V2 to V6. There is ST segment depression in leads III, aVR and aVF. There is no R wave in V3.

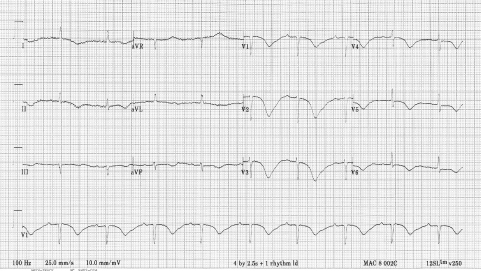
Figure 4.4 Non-ST segment elevation MI, an anterior sub-endocardial myocardial infarction. The rhythm is sinus bradycardia with T wave inversion in leads I, II, III, aVR, aVF and V1 to V6. The deep T inversion in V2 and V3 is suggestive of infarction.

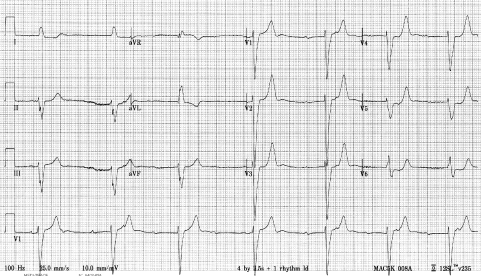
Figure 4.5 Left bundle branch block. The rhythm is complete heart block, the QRS duration is 160 milliseconds (four small squares). The largest R wave in the chest leads is in V6.

Stay updated, free articles. Join our Telegram channel

Full access? Get Clinical Tree


