The five phases of the action potential in Figure 10.1 are as follows.
- Phase 4 – the resting phase. The cell is negatively charged compared with the outside. This difference, of about 85 mV, is called the resting membrane potential. Potassium is high inside and sodium is high outside the cell.
- Phase 0 – except in the sinoatrial (SA) and atrioventricular (AV) nodes, the cells rapidly depolarise. Channels on the cell membrane open and sodium ions enter. This changes the cell’s negative electrical charge to a positive one as it depolarises.
- Phase 1 – the cells rapidly repolarise. This is caused by fast sodium channels closing and by potassium leaving the cell.
- Phase 2 – the action potential reaches a plateau, as the cell’s electrical activity stabilises. Calcium flows into and potassium flows out of the cell.
- Phase 3 – the cell completes repolarisation. Ion pumps move sodium out and potassium into the cell. When the cell’s membrane potential drops, the absolute refractory period ends and the relative refractory period begins.
The speed with which cells depolarise depends on whether a fast or slow channel dominates them. Fast and slow channels are the routes through which sodium and calcium flow in and out of the cell. If the fast channel dominates, the cell depolarises quickly. Conversely, if the slow channel dominates, the cell depolarises slowly. Fast channels dominate cardiac muscle cells, while slow channels dominate cardiac electrical cells. It is also of note that each action potential lasts about one thousandth of a second.
Refractory Period
This is the time it takes after depolarisation for the cell to depolarise in response to a second stimulus. Referring to the action potential above, in phase 2, no stimulus will cause depolarisation. In phase 3, a stronger than usual stimulus will depolarise the membrane; however, there is a short period during phase 3, the supranormal period, when a weaker than usual impulse may cause depolarisation (Grant and Durrani, 2007). The refractory period gives direction to impulse propagation: the cell that has just stimulated depolarisation in a second cell cannot be stimulated to depolarise by the second cell, as it will be refractory.
As stated earlier, myocyte depolarisation may be triggered by depolarisation of an adjacent cell, which would effectively mean that a wave of depolarisation would spread like a ripple across the myocardium. This is prevented by intercellular proteins called connexins, which channel these depolarisations through tracts in the myocardium.
Depolarisation of the cell membrane changes the concentration of calcium and other intracellular messengers that activate contraction of the myocardial cell.
The depolarisation/repolarisation of the millions of cells in the heart can be measured on the body surface and are what produces the electrocardiogram (ECG).
The Conduction System
The normal heartbeat originates from spontaneously depolarising cells in an area of tissue in the right atrium of the heart, the sinoatrial (SA) node. The rate at which these cells depolarise is influenced by sympathetic and parasympathetic activity. Sympathetic stimulation increases this rate; parasympathetic (vagal) stimulation decreases the rate at which these cells depolarise.
Depolarisation of the SA node depolarises adjacent cells and a wave of depolarisation spreads across the atria, causing atrial contraction. Inside the right atrium, close to the tricuspid valve, is another area of specialised conductive tissue, the atrioventricular (AV) node. This has the lowest conduction velocity in the myocardium. This slows transmission of atrial depolarisation to the ventricles.
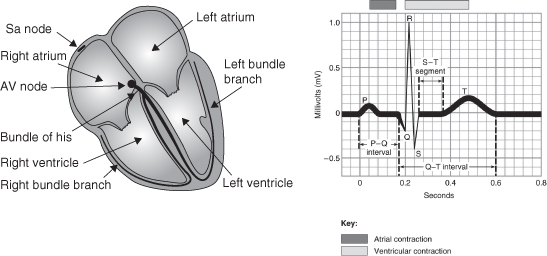
The impulse then spreads through both ventricles via the right and left bundle branches and the Purkinje fibres, causing a synchronised contraction of the heart muscle (Figure 10.2).
Figure 10.2 The cardiac conduction system and its manifestation into the QRS complex. P wave – atrial systole; PR interval – delay at the AV node; QRS complex – ventricular systole; T wave – ventricular repolarisation.
Re-Entry Phenomena
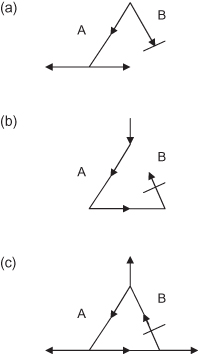
Many arrhythmias are caused by re-entrant excitation. These are due to lack of homogeneity in the conduction of impulses within the myocardium, which can have a number of causes including, ischaemia, stretch and scarring. This phenomenon is illustrated in Figure 10.3 (adapted from Hoffman and Rosen, 1981).
Figure 10.3 (a) Depolarisation spreads down paths A and B. In path A it continues on to other tissues. However, in path B, the depolarisation is blocked. (b) Depolarisation continues retrogradely in path B, but is not blocked in this direction. (c) The re-entrant circuit is complete. Other tissue, adjacent to the re-entry circuit is depolarised much more quickly than it would be by normal conduction.
Manifestations of Arrhythmias
The best way of diagnosing any arrhythmia is by medical assessment, including an electrocardiogram (ECG) (Schamroth, 1990). The clinical importance of an arrhythmia in a patient is related to the ventricular rate, the presence of any underlying heart disease and the reliability of cardiovascular reflexes.
Coronary blood flow occurs during diastole, and as the heart rate increases, the diastolic period shortens. In the patient with coronary heart disease, blood flow in the coronary arteries can be reduced and chest pain may occur. Reduced cardiac performance produces symptoms of faintness or syncope and leads to increased sympathetic stimulation, which may increase the heart rate even further.
An ECG is important in the assessment of the patient for determining the heart rhythm and how to proceed with the nursing management. The ECG transforms the electrical activity it picks up from each lead into a series of waveforms, which correspond to depolarisation and repolarisation within the heart (Figure 10.4).
- P wave – represents the time necessary for an electrical impulse to spread throughout the atrial musculature.
- PR interval – measures the spread of the impulse through the AV node. It is measured from the beginning of the QRS complex. Normal duration ranges from 0.12 to 0.20 s.
- QRS complex – normally has a greater amplitude than the P wave because ventricular muscle mass is greater than atrial. Normal duration is up to 0.10 s. Deflections of the QRS complex vary according to whether the electrical activity is travelling towards the positive electrode or away from it. When electrical activity travels towards the positive electrode, a positive deflection is seen. Conversely, when it travels towards the negative electrode, a negative deflection is seen. The first negative deflection is called the Q wave. The first positive deflection is called the R wave and the downward deflection following is called the S wave. The QRS complex can take on many different configurations, which can be normal.
- ST segment – no electrical activity occurs at this time, and therefore the ST segment remains at the baseline or isoelectric line. It is normally between 0.08 and 0.12 s.
- T wave – the peak of the T wave represents the vulnerable period of repolarisation. At this time a weak electrical stimulus can precipitate depolarisation and therefore can cause serious arrhythmias.
- QT interval – this includes the QRS complex, ST segment and the T wave. Normal QT intervals vary from patient to patient, with variants including age and sex. It varies between 0.30 and 0.45 s and it will shorten as the heart rate increases. For this reason, the corrected QT interval (QTc) is used. This is calculated using the formula
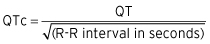
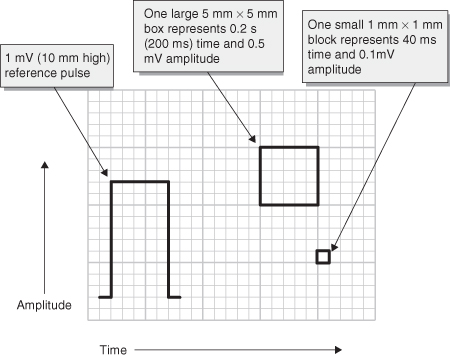
Figure 10.4 ECG paper: one large 5 mm square represents 0.2 s. Therefore five large squares represent 1 s in time.
Most ECG machines do this calculation automatically and the QTc should be 0.38–0.42 s.
Questions to Ask When Diagnosing a Rhythm
- Is there electrical activity?
- If there is no electrical activity, check the leads, electrical connections and gain on the machine. If there is still no electrical activity, the rhythm is asystole.
- If electrical activity is present, check to see if there are recognisable complexes. If there are none, the rhythm may be ventricular fibrillation, which presents as a rapid, bizarre, irregular appearance with random frequency.
- If there are recognisable complexes, go to the next question.
- If there is no electrical activity, check the leads, electrical connections and gain on the machine. If there is still no electrical activity, the rhythm is asystole.
- What is the ventricular rate?
- A normal resting heart rate is 60–100 beats/min (bpm). The ventricular rate can be calculated in a few ways. The simplest way is to record the number on the monitor. This can be unreliable if the rhythm is irregular or artefact is present. It is more accurate to record a strip and count the number of QRS complexes in 6 s and multiply by 10. This gives the approximate rate per minute. For example, if eight QRS complexes occur in 6 s, the rate is 8 × 10 = 80/min.
- An alternative method for calculating the heart rate is to count the number of large (5 mm) squares between two consecutive QRS complexes and divide this number into 300. For example, if there are four large boxes between two QRS complexes, the rate is 300/4 = 75/min.
- A normal resting heart rate is 60–100 beats/min (bpm). The ventricular rate can be calculated in a few ways. The simplest way is to record the number on the monitor. This can be unreliable if the rhythm is irregular or artefact is present. It is more accurate to record a strip and count the number of QRS complexes in 6 s and multiply by 10. This gives the approximate rate per minute. For example, if eight QRS complexes occur in 6 s, the rate is 8 × 10 = 80/min.
- Is the QRS rhythm regular or irregular?
- Look at an adequate length of rhythm strip and measure out the intervals between R waves. The interval should be fairly regular. If the QRS rhythm is irregular, decide if the basic rhythm is regular with intermittent irregularity or if it is totally irregular with no recognisable pattern of R–R interval. There may also be a recurring cyclical variation in the R–R intervals (Table 3.4).
- Is the QRS width normal or prolonged?
- A normal QRS complex should be 0.12 s (three small boxes) or less. This indicates the impulse has originated above the ventricles and may be from the SA node, atria or AV node.
- If the QRS duration is >0.12 s, the rhythm may be originating in the ventricular myocardium or may be a supraventricular rhythm.
- A normal QRS complex should be 0.12 s (three small boxes) or less. This indicates the impulse has originated above the ventricles and may be from the SA node, atria or AV node.
- Is atrial activity present?
- After determining the rate, regularity and QRS width, look to see if there are any identifiable P waves. This may be difficult either because the P waves are too small or because the atrial activity is partly or fully obscured by QRS complexes or T waves. Sinus P waves are usually seen best in lead II.
- Other types of atrial activity may be present. Atrial flutter waves occur when the atrium are depolarising at a rapid rate. The waves have a classic “saw tooth” pattern, often at a rate of 300/min.
- Atrial fibrillation happens when the waves of depolarisation happen randomly through both atria. There are no P waves. AF waves are usually seen as rapid deviations from the ECG baseline with varying size and duration.
- After determining the rate, regularity and QRS width, look to see if there are any identifiable P waves. This may be difficult either because the P waves are too small or because the atrial activity is partly or fully obscured by QRS complexes or T waves. Sinus P waves are usually seen best in lead II.
- How is atrial activity related to ventricular activity?
- A consistent interval between P waves and the following QRS complex indicates that conduction between the atrium and ventricle is intact. The interval between atrial depolarisation and ventricular depolarisation is referred to as the P–R interval and is normally 0.12–0.20 s (three to five small boxes). Occasionally, there are conduction problems between the atria and ventricles and a number of arrhythmias may arise (Table 3.4).
It is helpful to remember that effective treatment is often possible without a precise ECG diagnosis and the full clinical assessment must be considered; these basic questions will help to identify the patient’s rhythm and its origin. They facilitate a systematic approach to analysing the rhythm.
Arrhythmias
In adults, a bradycardia is defined as a ventricular rate of less than 60 bpm; a tachycardia is a rate greater than 100 bpm. With all the given rhythm strips, attempt to work out the heart rate using the calculation example given. What follows is not an exhaustive list, rather the arrhythmias more commonly encountered.
Bradyarrhythmias
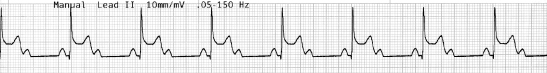
Sinus Bradycardia (Figure 10.5)
The heart rate is slower than normal; however, the pattern remains the same. It is usually benign and results from a good general fitness level or drugs such as beta-blockers.
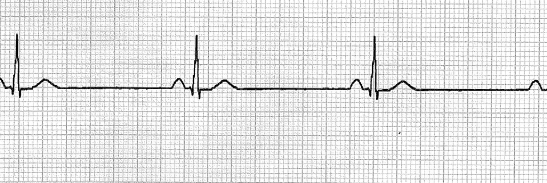
| What is the QRS rate? | Less than 60 bpm |
| Is the QRS rhythm regular? | Yes |
| What is the QRS duration? | Less than 0.12 s (three small squares) |
| Is there atrial activity? | P waves |
| Are there P waves before each QRS? | Yes |
| What is the PR interval? | 0.12–0.20 s (three to five small squares) |
Atrioventricular (AV) Blocks
The SA node may be generating impulses causing the atria to contract at a normal rate, but not every impulse passes through the AV node to the ventricles. Heart blocks may be congenital or acquired, for example following an ischaemic event. There are various types of AV block.
First Degree AV Block (Figure 10.6)
This is simply a delay in conduction through the conducting system. It is diagnosed by a prolonged PR interval, beyond the normal 0.20 s. Importantly, each P wave is followed by a QRS complex.
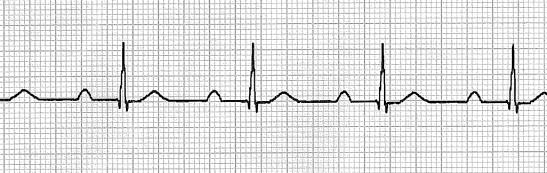
| What is the QRS rate? | Dependent on the underlying rhythm |
| Is the QRS rhythm regular? | Yes |
| What is the QRS duration? | Less than 0.12 s (three small squares) |
| Is there atrial activity? | Yes, P waves |
| Are there P waves before each QRS? | Yes |
| What is the PR interval? | Greater than 0.20 s (five small squares) |
Second Degree AV Block
Here, the rhythm is characterised by an intermittent failure or interruption of AV node conduction. The P wave is blocked within the AV conducting system, and in effect is “dropped” and hence not followed by a QRS complex.
- Second degree AV block (Mobitz type 1 – Wenkebach phenomenon) (Figure 10.7) Cellular depolarisation in the AV node becomes more prolonged, usually due to ischaemia in these tissues. As a result, the refractory period is prolonged. On the surface ECG, this rhythm has an initially normal PR interval, with each subsequent PR interval becoming more prolonged. The cycle is complete when atrial activation occurs while the AV node is refractory, and no ventricular conduction occurs, resulting in a “dropped” QRS complex. The PR interval following the dropped beat will be normal, as AV nodal tissue will have recovered. The sequence then continues to repeat itself.
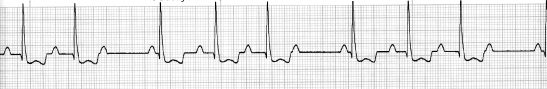
| What is the QRS rate? | Ventricular is usually slower than the atrial rate |
| Is the QRS rhythm regular? | No |
| What is the QRS duration? | Less than 0.12 s (three small squares) |
| Is there atrial activity? | Yes |
| Are there P waves before each QRS? | Yes, but some P waves are not followed by a QRS. |
| What is the PR interval? | Progressively lengthening until a QRS is “dropped” |
- 2:1 AV block (Figure 10.8) This is probably a short-cycle Wenkebach-type block. The QRS complexes are usually narrow, but there are two P waves for every QRS complex.