Operational management
Carol Venable and Anita Hazelwood
Objectives
• Define key words in operational management.
• Describe various methods of organizing work.
• Define productivity, productivity standards, and a productive unit of work.
• Describe the various methods of measuring output to establish productivity standards.
• Apply the work simplification process to improve a system.
• Explain the concepts applied to the systems model.
• Utilize the systems analysis and design process to analyze and improve a system.
• Differentiate between the formal and informal organization.
• Examine the characteristics of projects and project management.
• Utilize the project management process to achieve an organizational goal.
• Apply the employee’s individual needs to the design of the work space.
Key words
Accent lighting
Adaptive strategies
Ambient lighting
American plan of office design
Benchmarking
Carpal tunnel syndrome
Critical path
Decision grid
Decision matrix
Decision table
Decision tree
Directional strategies
Ergonomics
External environmental analysis
Flow process chart
Flowchart
Functional strategies
Gantt chart
Informal or unwritten organization
Internal environmental analysis
Linkage strategies
Market entry strategy
Methods improvement
Mission
Movement diagram
Office landscaping
Open office design plan
Operation flowchart
Operational strategies
Organization chart
PERT network
Policies
Population
Procedures
Process
Productive unit of work
Productivity
Productivity standards
Project management
Proximity chart
Random selection
Reengineering
Relative humidity
Sample
Staff hour
Stopwatch study
Strategic control
Strategic implementation
System
Systems analysis and design
Systems flowchart
Task lighting
Task-ambient lighting
Time-and-motion study
Trip frequency chart
Values
Vision
Work breakdown structures
Work distribution chart
Work sampling
Work simplification
Work station
Abbreviations
ADA—Americans with Disabilities Act
BLS—Bureau of Labor Statistics
CMS—Centers for Medicare and Medicaid Services
CTD—Cumulative Trauma Disorder
CTS—Carpal Tunnel Syndrome
DRG—Diagnosis-Related Group
EPA—Environmental Protection Agency
HIM—Health Information Management
HVAC—Heating, Ventilation, and Air-Conditioning
JC—Joint Commission
NIOSH—National Institute for Occupational Safety and Health
OSHA—Occupational Safety and Health Act
RSI—Repetitive Stress (or Strain) Injury
This chapter contains revised information from a previous edition authored by Peter M. Ginter and W. Jack Duncan.
Student Study Guide activities for this chapter are available on the Evolve Learning Resources site for this textbook. Please visit http://evolve.elsevier.com/Abdelhak.
When you see the Evolve logo,  , go to the Evolve site and complete the corresponding activity, referenced by the page number in the text where the logo appears.
Introduction
Health information is not limited to one department or even to one organization. It is developed, disseminated, and used throughout organizations and communities. The effective use of health information depends on the systems that can create, analyze, disseminate, and use it. To be effective, the systems must effectively use the resources of people, processes, and equipment.
An important skill for the health information manager is the ability to analyze the processes that create and handle health information to be sure that they are functioning in the most efficient and effective manner. These processes could involve paper, computer systems, or both. There are numerous software programs available to assist with the various operational functions.
This chapter describes the tools that can help to analyze and improve the methods used in health information systems. The discussion begins at the micro level of individual jobs and procedures and moves through a midlevel look at systems analysis and design and organizational concepts to a larger macro or organization-wide level with the concepts of project management, reengineering, and design.
Individual work processes (micro level)
Organizing work
The method of organizing, or allocating, the work among the employees depends somewhat on the type of organization and the nature of the work to be accomplished. Work division can be accomplished using any of the following methods:
Function—Similar tasks are performed by one unit within a department or an organization.
Project—A work unit performs all steps for a particular project (an example is a task force).
Product—In a manufacturing company, one unit performs all the work to produce a single product.
Territory—Sales forces are divided in this manner, with each representative responsible for a certain geographical area. Another example may be the organization of the hospital nursing service by patient care units.
Customer—This concept can be applied in a health information management (HIM) department when teams are organized to work on patient records of particular physicians.
Process—Similar work processes or procedures are grouped together and performed by a particular unit or group of employees.
Work processing can be further subdivided to the individual employee level. This subdivision can be classified into serial, parallel, and unit assembly (Figure 16-1).
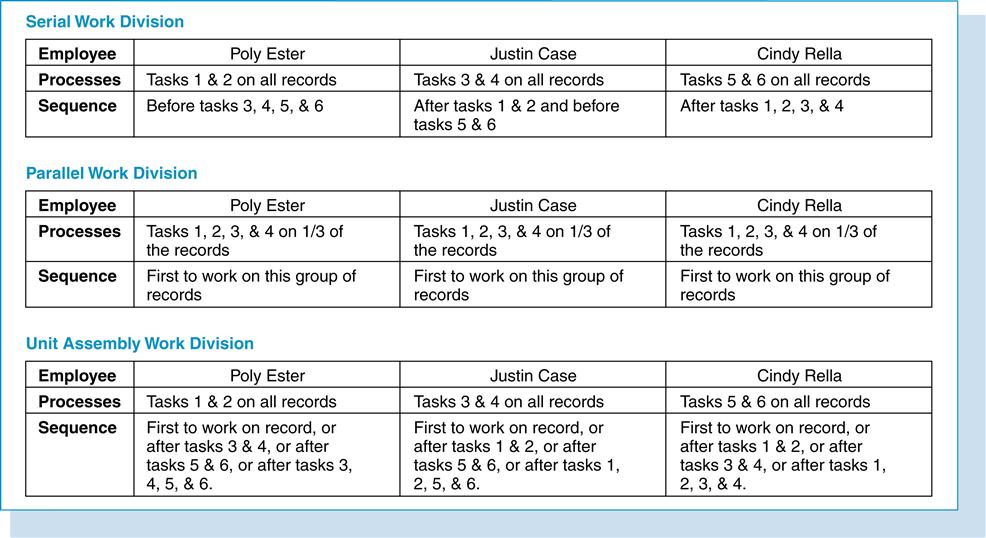
Serial work division
The serial work division is one of consecutive handling of tasks. A series of small tasks is grouped together. Each task in the series is performed by a specialist in that type of work. The work passes from one employee to another until all tasks have been performed and the work is complete. An example of the serial arrangement is an assembly line in a factory, in which each step in the process is performed by a different person.
Parallel work division
Parallel work division demonstrates a concurrent method of handling work. One person performs a series of tasks. The tasks may be, but are not necessarily, related. Several employees may be performing the series of tasks at the same time. An example of this method in an HIM department is one in which four persons are employed to assemble and analyze patient records. Each employee assembles and analyzes records.
Unit assembly work division
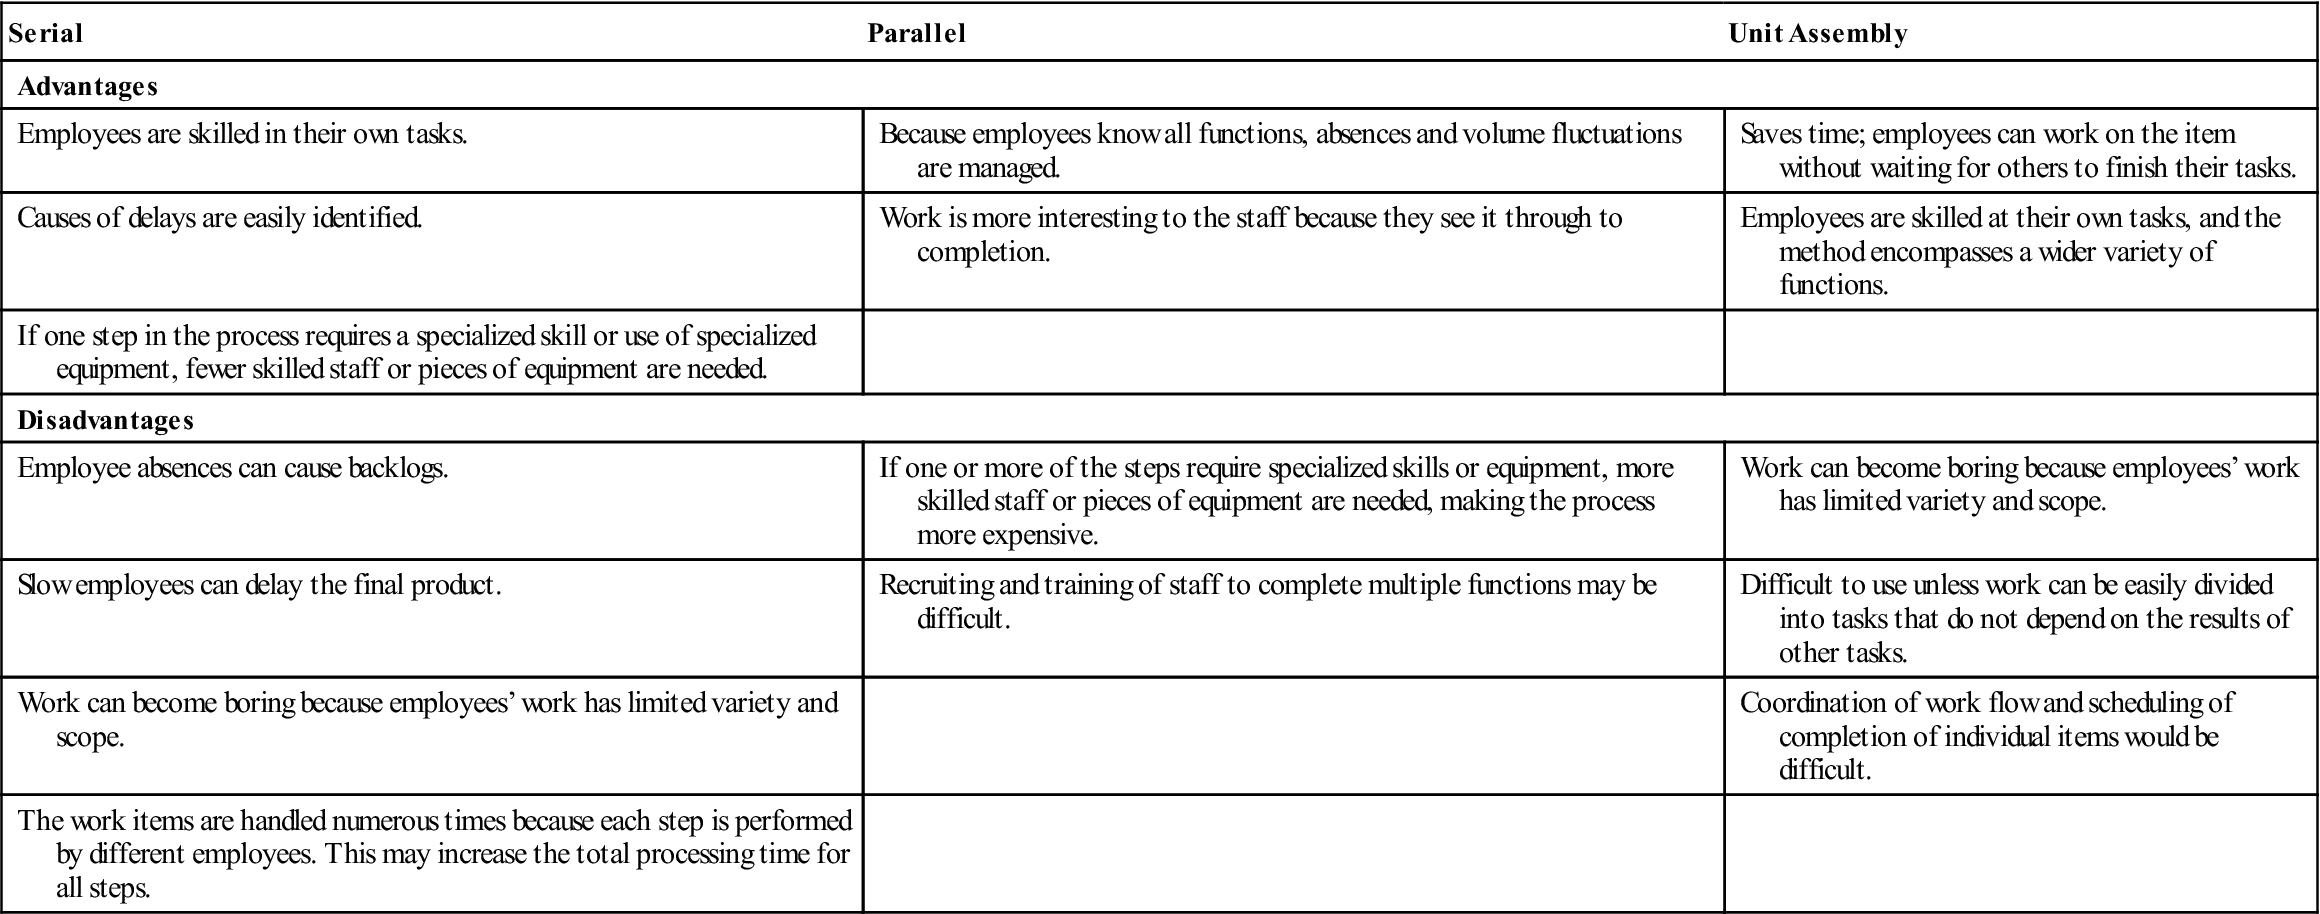
In unit assembly work division, each employee specializes in a particular task, as in serial work division, but the sequence of tasks on each unit is not identical. For example, in Figure 16-1, Poly Ester specializes in tasks 1 and 2. She may perform these tasks before anyone else works on a particular item, after tasks 3 and 4 are done, after tasks 5 and 6 are complete, or even after all steps—3, 4, 5, and 6—are done. A great deal of coordination is necessary in the unit assembly method because the amounts of time needed to perform individual tasks differ. The advantages and disadvantages of the three methods of organizing work are delineated in Table 16-1.
Table 16-1
ADVANTAGES AND DISADVANTAGES OF WORK DIVISION METHODS
| Serial | Parallel | Unit Assembly |
| Advantages | ||
| Employees are skilled in their own tasks. | Because employees know all functions, absences and volume fluctuations are managed. | Saves time; employees can work on the item without waiting for others to finish their tasks. |
| Causes of delays are easily identified. | Work is more interesting to the staff because they see it through to completion. | Employees are skilled at their own tasks, and the method encompasses a wider variety of functions. |
| If one step in the process requires a specialized skill or use of specialized equipment, fewer skilled staff or pieces of equipment are needed. | ||
| Disadvantages | ||
| Employee absences can cause backlogs. | If one or more of the steps require specialized skills or equipment, more skilled staff or pieces of equipment are needed, making the process more expensive. | Work can become boring because employees’ work has limited variety and scope. |
| Slow employees can delay the final product. | Recruiting and training of staff to complete multiple functions may be difficult. | Difficult to use unless work can be easily divided into tasks that do not depend on the results of other tasks. |
| Work can become boring because employees’ work has limited variety and scope. | Coordination of work flow and scheduling of completion of individual items would be difficult. | |
| The work items are handled numerous times because each step is performed by different employees. This may increase the total processing time for all steps. | ||
Work distribution chart
The work distribution chart is a useful tool that provides data to analyze the processes performed by a work group and the individual employee within the work group. Examination of the data assists in identifying problems but not solutions. The work distribution chart is a matrix that displays the tasks being performed in a work group, the employees who perform them, and the amount of time spent on each task by each employee and the work unit as a whole.
Preparation of the work distribution chart requires the following steps:
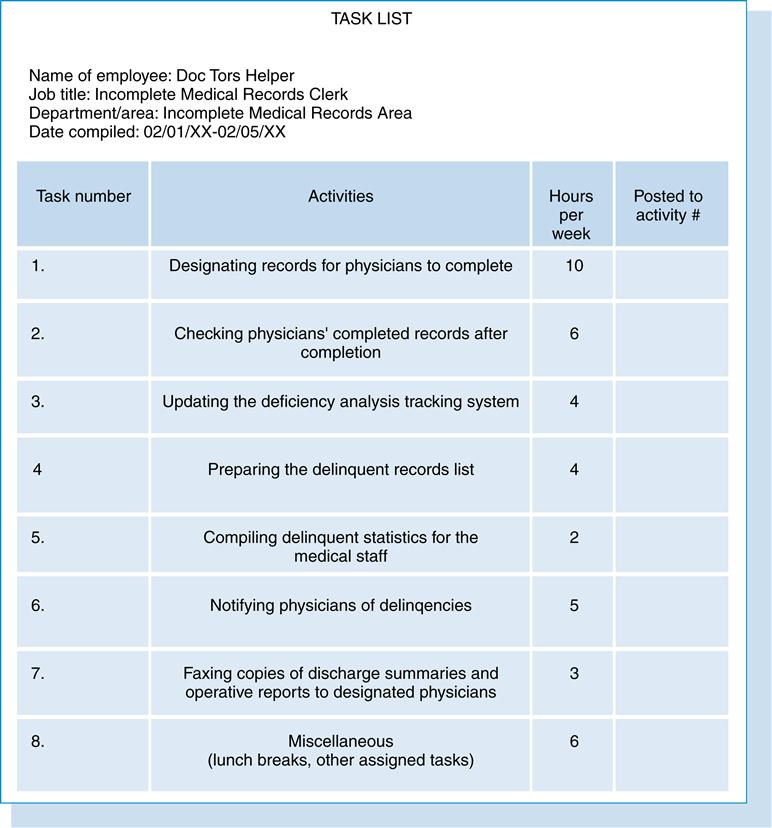
1. Each employee prepares a task list (Figure 16-2). The employee should be instructed that the task list should reflect what the employee actually does, not what he or she should be doing. To gain cooperation from the employees, the supervisor should explain the purpose of gathering these data. The purpose is not punitive but to analyze how time is spent in the work group to improve the jobs. Over a 1-week period, each employee lists the tasks he or she performs and the amount of time spent on each. The task statements should be brief and specific and include no more than 15 statements. The duties should be listed in order of importance. Every minute need not be accounted for. Hours should be entered to the nearest 15 minutes, and breaks and other nonproductive time should be included in a miscellaneous category.
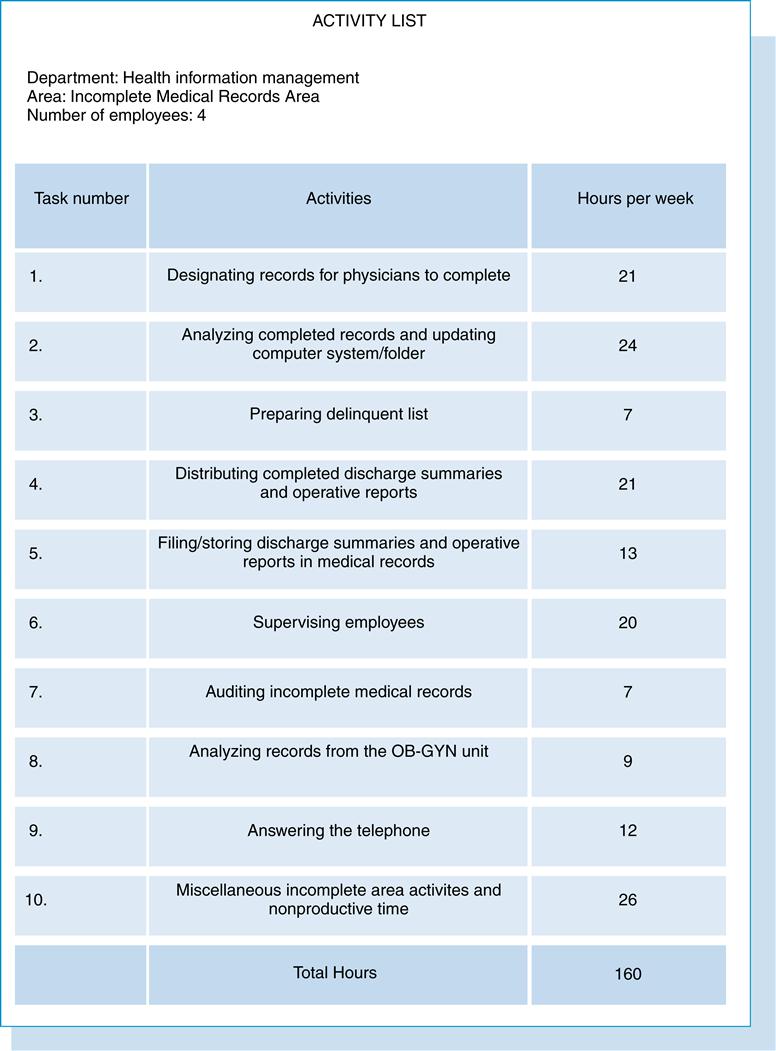
2. Supervisor prepares a list of the major activities of the work group (Figure 16-3). This is a list of general categories into which all activities of the employees can be classified. As a rule, no more than 10 activities should be listed. They should be listed in order of importance with the most important listed first. When the activity list is completed, each task shown on the individual employee’s task lists should be classified under one of the major activities. It may be necessary to add a miscellaneous category to accommodate all the tasks that may not fall under one of the major activities of the section.
3. Supervisor combines the employee task list and the activity list into the work distribution chart (Figure 16-4). The work distribution chart is complete when the following entries are made:
• The major activities are listed in the left-hand column.
• The total time spent on each major activity by all employees is recorded in the right-hand column.
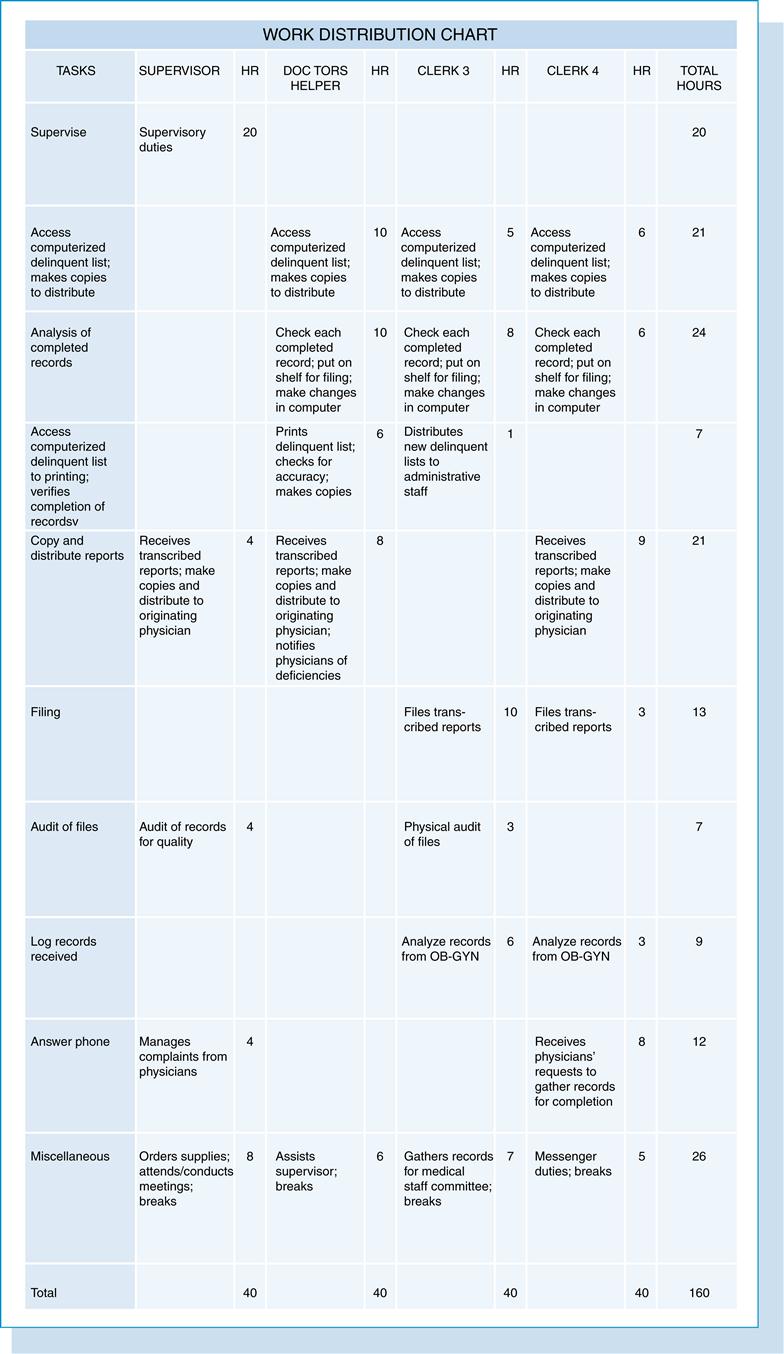
Analysis of the work distribution chart can answer the following questions:

Analysis of the work distribution chart may also aid the manager in choosing one of the types of work division (serial, parallel, or unit assembly). By including the number of units produced in the work distribution chart, managers can use the chart to establish productivity standards in an organization.
Productivity
Productivity is the process of converting an organization’s resources (labor, capital, materials, and technology) into products and services that meet the organization’s goals. Productivity is also defined as the number of items produced per staff hour that meet established levels of quality.1 A productive organization is one that produces quality products or services with the least expenditure of resources.
Productivity is often expressed as a ratio:
or

Some related definitions are important to the understanding of productivity. A staff hour is defined as 60 minutes of time during which an employee is working on a task or a particular function and being paid for that work. A productive unit of work is an item produced that meets established levels of quality. The quality (or accuracy) level is an important aspect of this definition. When a product does not meet the quality level, it often has to be redone. Therefore, if products that do not meet the quality level were counted as output, the number of products would be inflated because of counting the rework and the original work as outputs. Quantity, in the preceding ratio, generally refers to the number of work units that are produced by an employee who is trained and who is working at a normal pace. Examples of outputs in an HIM department are coded patient data, completed response to a request for information, and a transcribed report.
Productivity standards
Productivity (also known as performance or work) standards are the tools that are used to specify the expected performance and to measure actual performance. Productivity standards have many uses in managing an HIM department. They can assist in determining the number of personnel and supplies and the amount of equipment that are necessary to accomplish the projected workload; in scheduling completion and distribution of tasks; in evaluating proposed changes in processes or systems to see whether a savings in personnel time would occur; in setting goals for a work group or individual employee; and in evaluating the performance of a work group or individual employee. Productivity standards can also be used to determine the actual cost of producing a given product or service.
Setting productivity standards
Getting started
When a productivity program is designed, the work requirements and resources of the department must be clearly understood and the following should be addressed:
• All departmental activities should be identified and defined.
• An area of productivity focus should be selected.
• For the specific functions that are studied, quantity and quality must be defined.
• Current and past performance should be reviewed.
• Staff members should be involved in the establishment of the expectations of the program.
• Reporting mechanisms should be developed, and then performance should be monitored.
• As a final step, the improvements identified should be implemented.
Measuring input
To set productivity standards, certain determinations must be made. First, the methods of quantifying inputs must be determined. This is usually in terms of employee time expressed in paid staff hours worked. Second, the unit of work for measuring output must be established. For given processes, this can take various forms. For example, for the coding function, should the number of codes be counted or the number of records? Should the output be classified by level of difficulty (e.g., outpatient vs. inpatient, Medicare vs. non-Medicare)?
Measuring output
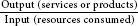
Actual Performance. Various methods are used to measure output, ranging from using past performance data to using time studies and work sampling. Using data from actual performance is the most common method of measuring output, as well as the easiest, quickest, and least expensive. Data can be collected by the organization’s own staff; therefore, specialists are not needed. Methods used to collect this information include employee-reported logs in the form of time ladders or diaries, as shown in Figure 16-5. Equipment can also be used to count items of work; for example, dictation equipment can record the number of minutes transcribed or characters entered.
Work Sampling. Work sampling is another method of collecting actual performance data. This method is based on the statistical laws of probability. The research concepts of population, random selection, and sample must be comprehended to understand the work sampling method.
Population. All items or members of the group to be studied.
Sample. The group of items chosen to represent the whole population. The size of the sample is important because it must be large enough to represent all members of the group but small enough to be manageable and cost effective.
Random selection. The method of choosing the sample that gives each item in the population an equal chance of being chosen.
In work sampling, the supervisor observes employees at times randomly selected, as opposed to continuous, all-day observations and records the task the employee is doing at the time of the observation. The observations are tallied to determine the percentage of all work time (the population) spent on each task. Combining these percentages with the number of items produced determines the productivity standards for these tasks. Advantages of the sampling method as opposed to the use of continuous observations are as follows:
2. Data can be obtained in less time and with less expense by using the sampling method.
3. Personnel who are being studied complain less often than individuals being observed continuously.
5. The sampling method is likely to produce more accurate results than continuous observations.
Using actual performance data has several problems. These productivity standards are based on existing procedures, processes, employee performance, and qualifications, all of which might not be the most effective for this process. Therefore, expected results would be based on poor performance and ineffective processes.
Benchmarking. Benchmarking, another method of setting standards, is the comparison of one organization’s performance with that of another organization that is known to be excellent in that area. Benchmarking is beneficial because it is more than comparing productivity. It involves discovering how the benchmark organization achieves its goals and then incorporating these methods into the other organization. The aim of benchmarking is the improvement of the organization’s processes. More information on benchmarking is in Chapter 12.
Stopwatch or time-and-motion. Stopwatch or time-and-motion studies are the most expensive techniques for setting productivity standards. Stopwatch studies require a skilled analyst to observe the employee performing the task and to record stop and start times for each portion of the task. The selection of the employee to be observed is an important element of this technique. The employee should be one who performs the task at an average speed, not the fastest or the slowest. This method is a poor public relations tool. Having to watch every move an individual makes can be unsettling and puts the individual on edge.
Whichever method is used to collect data and set productivity standards, the concept of quality cannot be overlooked. Techniques for ensuring the expected quality level of the output must be built into the methods for measuring the quantity. See Chapter 12 for more information about quality measurements.
Efficiency is as important in setting work standards as it is elsewhere in the organization. If it becomes too expensive to set standards and measure work, the goal of productivity monitoring is defeated.
Productivity standards must be understandable, realistic, reliable, and attainable under normal working conditions. Clear communication between employers and employees is important for the program to be a success. An effective productivity management program is based on accurate, reliable standards that have earned credibility with the employee.
Increasing productivity
Productivity can be increased through the following methods:
• Increasing output while holding input constant
• Decreasing input (resources) while maintaining the same level of output
• Increasing output while decreasing resources
• Increasing resources and output but with a proportionately greater increase in output
• Decreasing output and resources with a proportionately greater decrease in resources
Research findings on productivity improvement show the following2:
Implementing a productivity program

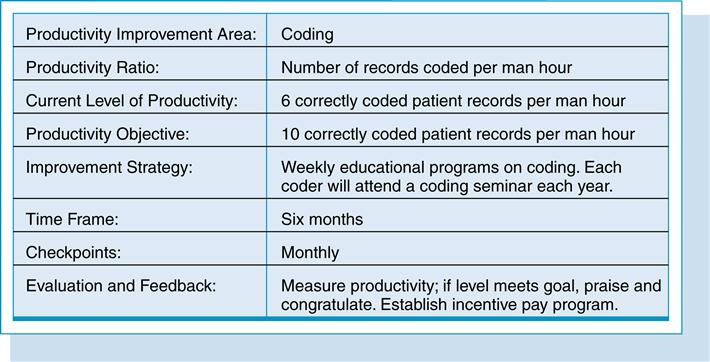
For the program to be useful, an organization needs a focused approach to improving productivity. A productivity improvement program needs well-defined goals. To be effective, as many employees as possible should be involved in the development of the program. Organizational goals should be integrated with employee goals. All employees should be part of the program and should be accountable for productivity improvement in their own work areas. Employees should share in the benefits of improved productivity and should be rewarded and reinforced for their contributions. Implementing a productivity improvement program is a six-step process.
1. Identify an area in the organization for improvement.
2. Establish a unit of measurement (productivity ratio) and measure current performance in that area.
3. Develop a measurable productivity objective.
4. Identify a strategy for meeting the objective.
5. Establish time frames and identify checkpoints.
An example of a productivity improvement program in an HIM department is shown in Figure 16-6.
Monitoring and improving performance
The department head or supervisor should develop a mechanism for analyzing the productivity of each employee and a means for summarizing overall section or departmental productivity. Depending on the specific management needs, reporting may be done on a daily, weekly, or monthly basis.
After overall productivity is established, management should review the areas that are in need of improvement. This improvement may be in the form of additional staff or training, improvement of work methods or individual work performance, or a change in the structure of the section or department. Time management and motivational techniques for employees may also prove to be beneficial in many cases.
Motivation
Managers in the workplace today often forget how important a role motivation plays with their employees. To be effective, managers need to understand what motivates an employee in the context of the job they perform in the department or facility. Greater productivity and increased employee morale is a natural result of a properly motivated employee. In general, motivation for better job performance depends on job satisfaction, individual recognition, personal achievement, and professional growth.
According to Kovach,3 managers should ask themselves the following 10 questions when attempting to provide a more positive motivational climate for employees:
1. Do you personally thank staff for a job well done?
2. Is feedback timely and specific?
3. Do you make time to meet with and listen to staff on a regular basis?
4. Is your workplace open, trusting, and fun?
5. Do you encourage and reward initiative and new ideas?
6. Do you share information about your organization with staff on a regular basis?
7. Do you involve staff in decisions, especially those that will affect them?
8. Do you provide staff with a sense of ownership of their jobs and the unit as a whole?
9. Do you give associates the chance to succeed?
Aside from motivational theories and information published by notable authors such as Douglas McGregor, Frederick Herzberg, and Abraham Maslow, managers must understand that they are dealing with human beings and that basically, motivation involves getting people to do something simply because they want to do it. The manager’s reward is productive employees.
Work simplification or methods improvement
An organizational goal is to provide the best service or make the best product with the least expenditure of resources while maintaining a healthy and contented workforce. The effectiveness of the individual employee depends on the effectiveness of the processes used. Work simplification, sometimes called methods improvement, is an organized approach to determine how to accomplish a task with less effort in less time or at a lower cost while maintaining or improving the quality of the outcome. It uses commonsense concepts to eliminate waste of time, energy, material, equipment, and space when performing work processes. Sometimes work simplification is misunderstood to mean work speed up. When work simplification tools are correctly used, the rate of production is enhanced by performing only the essential steps in the best way possible at a standard pace.
The fundamental objectives of work simplification are as follows:
The simplest means of performing the work is usually the easiest and most practical.
Questioning is fundamental to improving work processes. The first question that must be asked is, “Does this process assist in achieving the organization’s goals?” When the answer is no, the process should be eliminated. Remember to question the statement, “That’s the way it has always been done.” The questions of who, what, when, where, and how must be answered.
The philosophy of work simplification is that there is always a better way to perform every task. The statement that the process has always been done this way is a red flag that the process could use change and that the employee does not understand why the procedures are done in this way. The goal of a work simplification program is to increase efficiency through the elimination of unnecessary work and through the optimal structure of necessary work.
The individual who performs the tasks must be given significant attention when individual jobs are dissected. Employees need to be involved in the process because they are the experts in their own work processes. If they are involved in change, they are more likely to accept it. However, care must be taken so that the content of the job does not become oversimplified and boring.
The steps in the work simplification method are similar to those in the scientific method:
1. Identify a problem area or select a work process or function to improve.
2. Gather data on the problem.
3. Organize, analyze, and challenge the data gathered on the problem.
4. Formulate alternative solutions or improvements.
5. Select or develop the improved method.
6. Implement the improved method and evaluate the effectiveness of the improvement through follow-up.
Identifying a problem area or selecting a work process or function to improve
Identification of a problem is not an easy task. A competent manager must be able to differentiate between a symptom and its cause or problem. What appears to be the problem may only be a symptom. This step is essential because if the symptom’s cause is not correctly identified, the problem will not be solved, and the symptom may be only temporarily eliminated.
In health care, distinguishing between symptoms and diagnoses (problems) is a familiar process. The patient comes to the emergency department with the symptom of abdominal pain. On testing and evaluation, the patient is diagnosed with acute appendicitis. When the cause of the abdominal pain is identified, treatment can be initiated to remedy the symptom.
By use of the same approach of symptom versus diagnosis, common work symptoms can be examined to find the diagnosis or problem. For example, the symptom of poor productivity may be traced to the problem of inefficient work flow. High employee turnover may be a symptom of low morale caused by poor workload distribution.
The following list indicates potential problems that should be investigated:
• Duplication of work processes
• Overlapping of responsibilities
• Frequent delays and interruptions
• Poor workload distribution (congestion and clutter)
• Lack of instructions or procedures
• High absenteeism or turnover
• Complaints from customers and employees
• Apparent waste of materials, effort, personnel, time, and space
• Excessive time required to carry out an activity in comparison with results achieved
Managers need to be sensitive to cues from their employees and their surroundings. When managers are not responsive to these cues, a potential problem may develop into a crisis situation. After a sign has been recognized as a potential problem, the manager must proceed to investigate and move to resolution of the problem. Nothing is more discouraging to employees than to raise a concern and have no response from management. After a while, employees complain among themselves and fail to make management aware of problem areas.
Another approach to selecting an area of work to be simplified is to review areas with high labor requirements and a large number of diverse work activities and those in which excessive time is needed to perform the work, the costs are high, or the end product is inadequate.
Gathering data about the problem
Data collection methods vary with the type of problem and the work performed. Data-gathering methods include the collection of blank forms used in the process, completed forms, office or work layout, organizational charts, job descriptions, work logs, manuals/standards/procedures, interviews with employees, and observation. Additional facts may be obtained from supervisory staff.
The key to gathering data is to ask the right questions to find out how the work is being performed. The following are key questions to ask:
• Why is this process performed? How does it move the organization toward achievement of its goals?
• What work is currently being done and why is it being done?
• When (in what sequence) is the work being performed and why in this manner?
• Where is the work being performed and why there?
• At what rate does the work flow to the employee? Is the rate consistent?
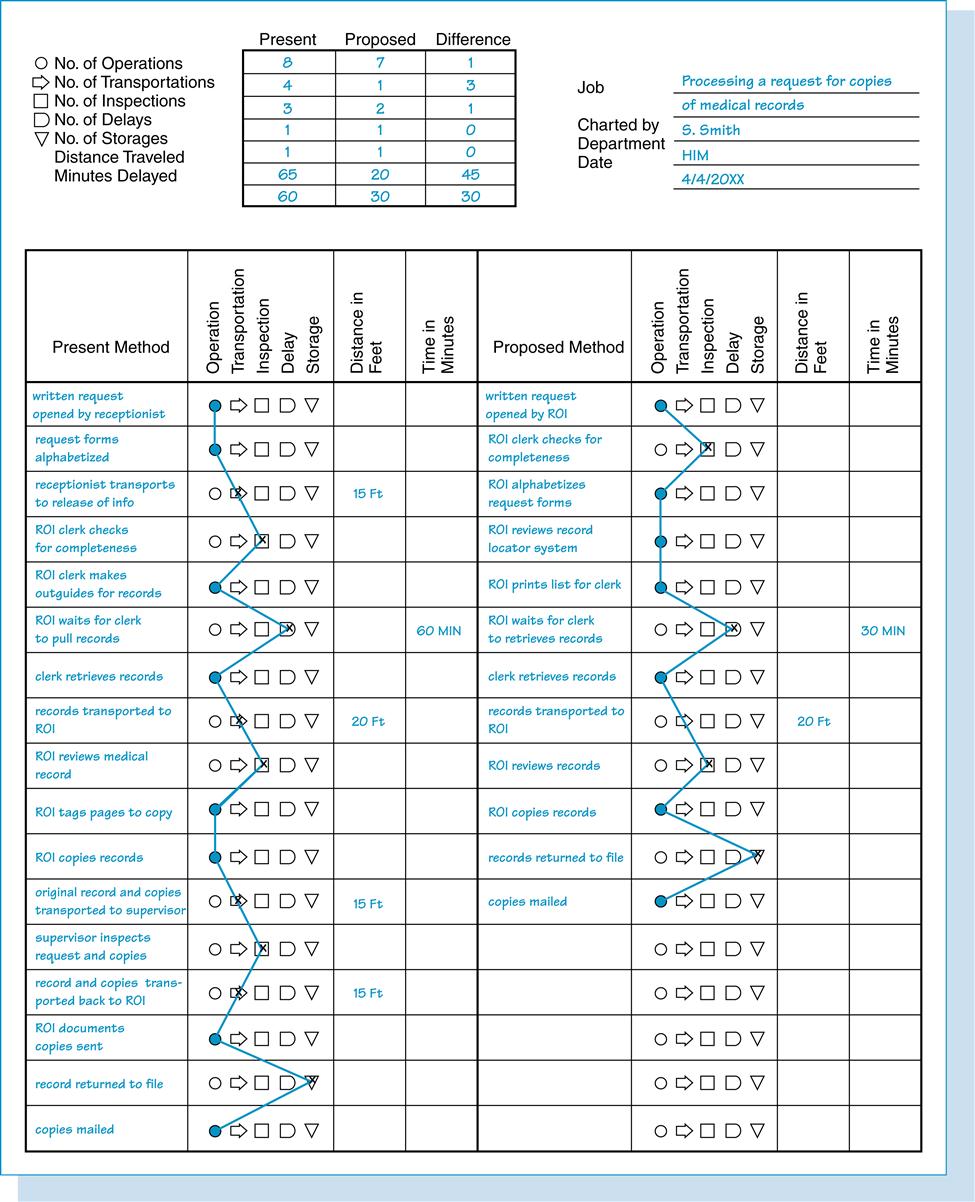
A flow process chart can be used to analyze procedures and to determine opportunities for improvement through eliminating, combining, or resequencing any part of the process.
Flow process chart
A flow process chart is a tool used to collect information on the steps of a work process and to analyze and improve the process. It is especially helpful in analyzing manual operations. The flow process chart is used to show the steps or actions involved with respect to a single person (job), a single material, or a single form.
There are several basic steps in constructing a flow process chart:
• Select the employee, material, or form to be followed.
• Determine the beginning and ending points of the process to be studied.
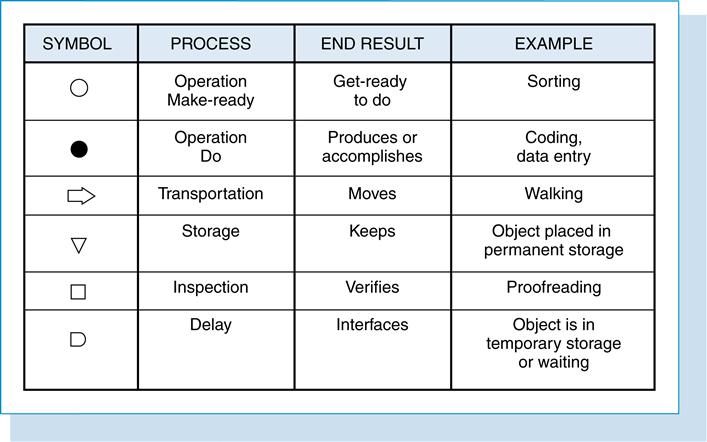
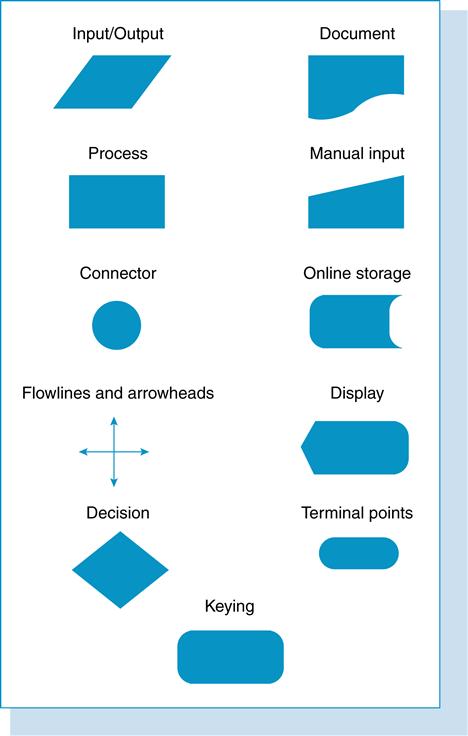
• Select the symbol that best describes the activity. The symbols used to represent each step in the process are shown in Figure 16-7. The symbols that represent each step are connected with a line to facilitate analysis.
Each step in the process should be subjected to the following questions:
• Is that particular step necessary or of value?
• Can the step be streamlined or combined with another step?

This analysis of the flow process chart can identify problems such as duplication of effort, too much travel time from one workstation to another, and delays in transferring work.
Figure 16-8 shows a completed flow process chart for a current and a proposed release-of-information function.
Flowcharts

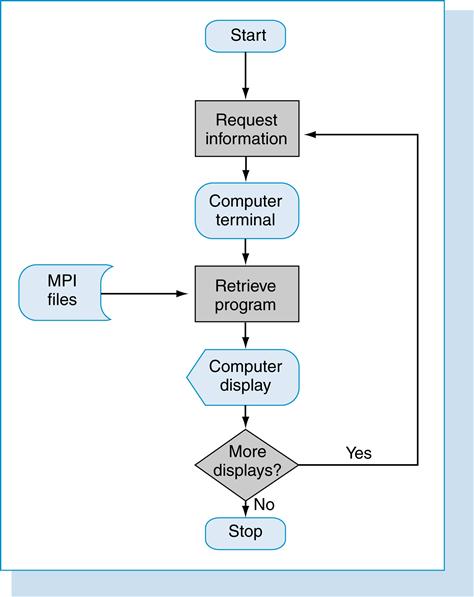
Additional types of flowcharts are used to verify and obtain information about how a procedure is being performed. Flowcharts are essentially road maps that show the logical steps and the sequence involved in a procedure. Flowcharts are used to depict all levels of operations from whole systems that involve many departments and people, as in a systems flowchart, to the work of one person or procedure, as in an operations or procedure flowchart. The systems flowchart depicts the flow of data through all or part of the system, the various operations that take place within the system, and the files that are used to produce various reports or documents. Figure 16-9 shows an example of a systems flowchart for the master patient index.
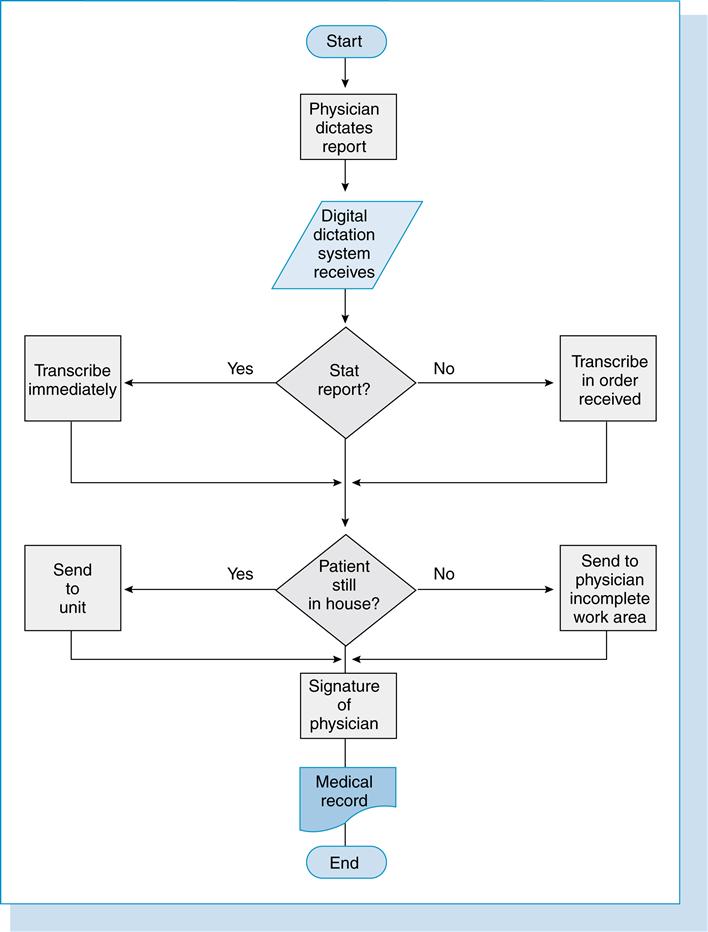
Operation or procedure flowchart
The operation flowchart is a graphical representation of the logical sequence of activities in a procedure. In addition, it points out the decision points encountered in carrying out that function. The operation flowchart should specify how a function is performed, not the methods used. This type of flowchart is a superb communication tool between employees and management (Figure 16-10).
Flowchart symbols and guidelines
The standard symbols shown in Figure 16-11 are used to construct flowcharts. When unique symbols are used, their meaning should be identified in a key or legend on the flowchart (Box 16-1).

The flowchart can be used for both planning and controlling activities. As a planning tool, the flowchart may be used to help develop a new procedure. The chart will show the linkage points among the various aspects of the task and will show areas that need to be changed. It can also be used to compare current and proposed procedures. As a control tool, the flowchart can be used to compare the actual work flow with the original procedure and also as a means of constant evaluation of processes.

Movement diagrams
The movement diagram, sometimes called a layout flowchart, represents graphically the physical environment in which the processes are performed. The purpose of a movement diagram is to depict the flow of work activities through the desks and equipment. A movement diagram can show movement of paper or an employee. This type of chart can be beneficial in identifying the problem of backtracking or bottlenecks in procedures. With a graphical display of the physical layout, a more efficient route for accomplishment of the task can be achieved.
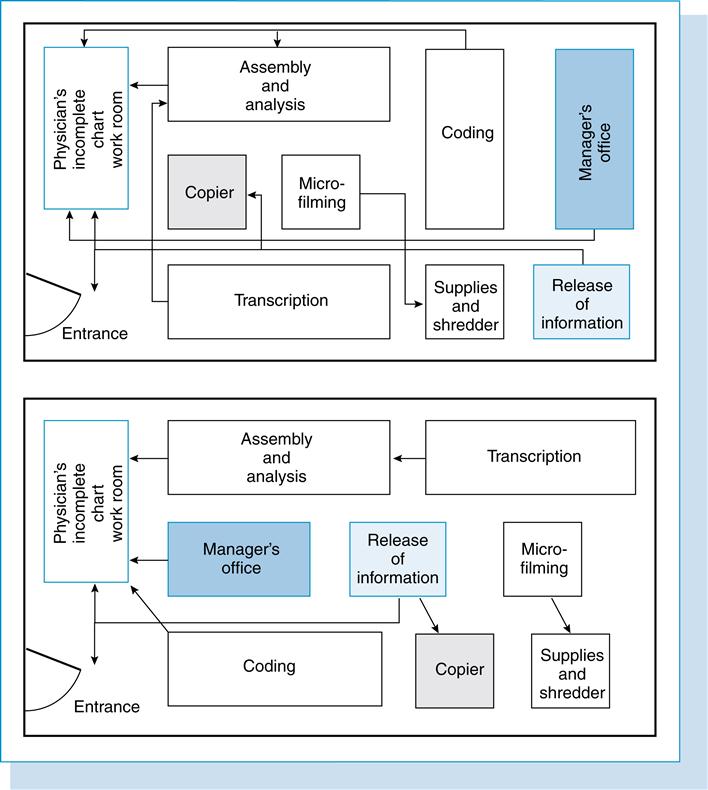
Movement diagrams or layout flowcharts are especially useful in the analysis of manual systems (Figure 16-12).
Organizing and analyzing data gathered on the problem
The third step of the process entails organizing and analyzing the facts or data obtained from step 2. As with all steps in work simplification, the employees who perform the work need to be included in this process.
Data can be organized in many ways. One is by chronological sequence of the work under study. Another is by problems or source of problems, such as the department or function in which they originate.
Formulating alternative solutions and improvements
By use of the fundamental belief of methods improvement that there is always a better way along with the information gathered, questioned, organized, and analyzed from the prior steps, several alternatives should come to mind. Employees who are close to the situation might not see the value of making changes, but their input must be acquired. Journal articles and conferences with colleagues within and outside the organization may stimulate some new and different thinking.
Selecting the improved method
To identify the best alternative for rectifying the problem, several decision-making tools are available.
Decision grid or matrix
The decision grid or matrix (Figure 16-13) is the most basic of the decision support tools. The alternatives are compared with one another by various criteria. The alternatives are listed down the left side. The elements or criteria are listed across the top. Examples of criteria frequently considered in selecting alternatives are cost, feasibility, desirability, acceptance, effect on productivity, and effect on quality.
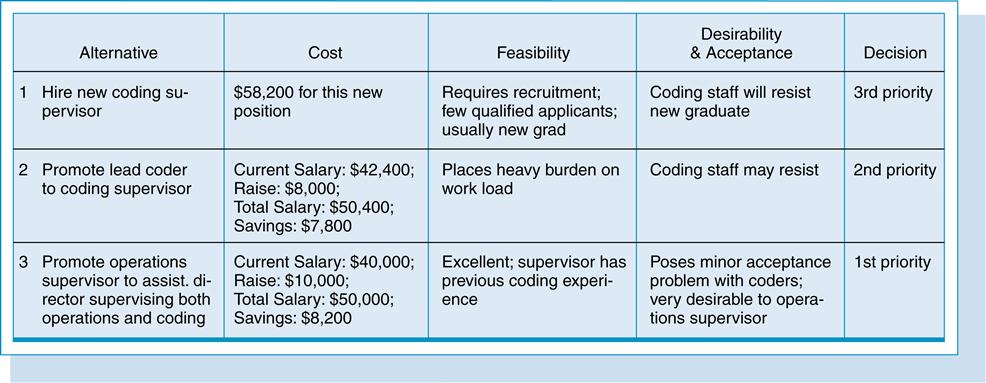

This grid may be used to arrive at a decision concerning any type of problem after the alternatives are defined and the criteria selected. Another option is to weigh the criteria. The element of cost may be weighted three times that of any other element. This would mean that cost is the first priority in this decision-making process. The grid’s primary advantage is that all relevant information can be displayed and viewed at the same time. This is useful when a committee or group is attempting to arrive at a consensus.
Decision table
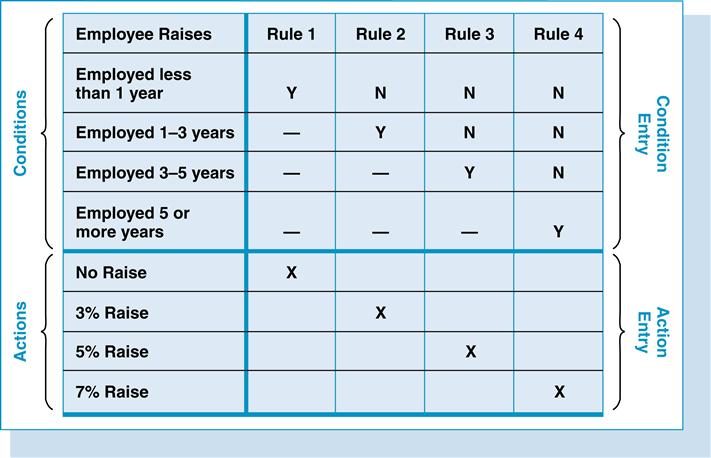
A decision table is an analytical tool that provides a means of communication of the logical sequence of a particular operation. This type of decision support tool can be used in situations in which the logic and sequential flow of data cannot be clearly shown on a flowchart. The decision table was originally designed to explain the logic found in computerizing a manual process.
A basic decision table is divided into four segments:
A decision table may be simple and characterize only a few conditions. It can, however, be complex and contain dozens of conditions and actions. Examples of the usage of decision tables in the HIM department may involve a complex process within the department or may assist in employee decisions. For example, in Figure 16-14, employees who are employed less than 1 year will receive no raises, whereas individuals who have been employed for 1 to 3 years will receive 3% raises.
Decision tree
Decisions are often linked to other decisions. In effect, sometimes one decision necessitates future decisions. A decision tree is used to chart alternative courses of action for solving a problem. It also depicts some of the probable consequences or risks resulting from each course of action. Decision trees are a valuable tool for evaluating decisions that are linked together over time with assorted potential outcomes. As an example, the transcription supervisor has an unanticipated heavy load of dictation. He or she has insufficient staff to handle the workload. The obvious alternatives in this situation include (1) hiring more transcriptionists, (2) paying overtime to current transcriptionists, (3) contracting work out to a transcription service, and (4) hiring temporary help (Figure 16-15).
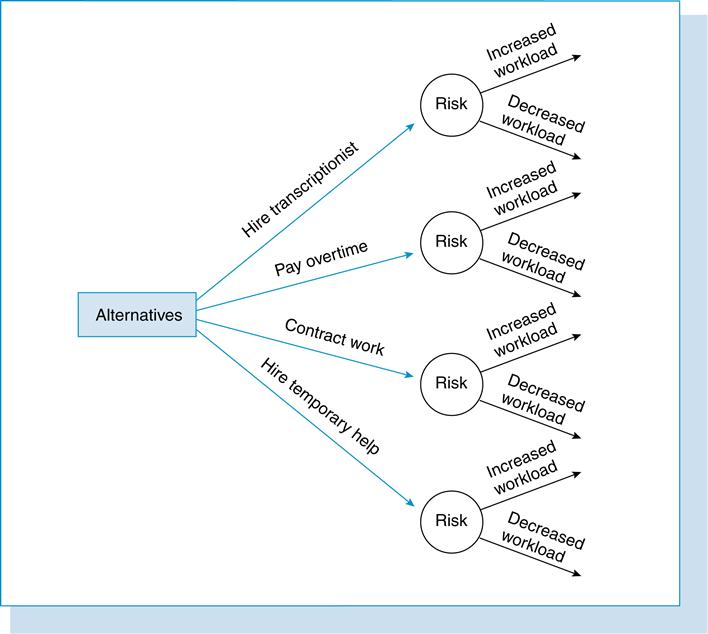
When this decision tool is used, the decision centers on the objective of making the wisest expenditure of money. This decision tool is effective when probabilities can be determined for the various outcomes. In this example, it would be helpful for the transcription supervisor to determine the probability of an increased demand for transcription services or the probability of continuation of the heavy load of dictation. After evaluating additional services rendered and considering previous year figures, the supervisor may estimate that there is a 70% probability that the workload will increase next year and a 30% probability that the workload will decrease. Monetary values have to come into play in evaluating the risks compared with the alternatives.
Implementing the improved method and evaluating the effectiveness of the improvement
Provided that the employees have participated in the entire process, this step should be easy and simple to apply. The improved method should result in a more simplified, better, faster, more convenient, and less costly method of performing the task. The purpose of the work simplification and the reasons for its importance should be made clear to every employee it affects.
To ensure success with the improved process, the new procedures should be documented and reviewed with all employees involved. People, by nature, tend to resist change. However, if employees realize that this change is part of their own efforts, resistance should be minimal. Sometimes it is helpful to demonstrate work simplification examples from other departments. If the employees can see results in reducing waste and accomplishing the work effectively, they will work together to meet the challenge that work simplification offers (Box 16-2).
Box 16-2
GUIDELINES FOR WORK SIMPLIFICATION
• As much as possible, reduce the distances traveled. Sometimes the movements of people and paper are costly and may be wasteful. Closely examine such movements and attempt to reduce them to the shortest distance possible. However, when movement is essential, it is typically a more efficient process to move the paper than to move the person. Some specific guidelines are as follows:
2. The quickest way to move small objects is usually by sliding rather than carrying.
Stay updated, free articles. Join our Telegram channel

Full access? Get Clinical Tree


