Statistics and data presentation
Valerie J.M. Watzlaf and Elaine Rubinstein
Objectives
Key words
Alternative hypothesis
Anesthesia death rate
Autopsy rate
Average daily inpatient census
Average length of stay
Bar graph
Bed turnover rate
Census statistics
Coefficient of variation
Community-acquired infection
Comorbidity
Confidence interval
Contingency table
Continuous data
Direct method of age adjustment
Discrete data
Dispersion
Fetal death rate
Frequency distribution
Frequency polygon
Gross death rate
Histogram
Hypothesis
Incidence
Incidence rate
Infant death rate
Infer
Inpatient bed occupancy rate
Interval data
Length of stay
Level of significance
Maternal death rate
Mean
Median
Mode
Morbidity rates
Mortality rates
Neonatal death rate
Net death rate
Nominal data
Nosocomial infection
Null hypothesis
Ordinal data
p value
Pearson correlation coefficient
Percentage
Percentage of occupancy
Pie chart
Postoperative death rate
Postoperative infection rate
Prevalence
Prevalence rate
Proportion
Random sample
Range
Rate
Ratio
Ratio data
Regression analysis
Sampling error
Standard deviation
Standardized mortality ratio
Stratified random sample
Systematic sampling
Test statistic
Tests of significance
Variance
Vital statistics
Weighted mean
Abbreviations
AIDS—Acquired Immunodeficiency Syndrome
ALOS—Average Length of Stay
ANOVA—Analysis of Variance
CV—Coefficient of Variation
dfb—Degrees of Freedom, Between Groups
dfw—Degrees of Freedom, Within Groups
DRG—Diagnosis-Related Group
HIM—Health Information Management
ICD—International Classification of Diseases
MSB—Mean Square Between Groups
MSW—Mean Square Within Groups
NCHS—National Center for Health Statistics
SMR—Standardized Mortality Ratio
SSB—Sum of Squares Between Groups
SSW—Sum of Squares Within Groups
Student Study Guide activities for this chapter are available on the Evolve Learning Resources site for this textbook. Please visit http://evolve.elsevier.com/Abdelhak.
When you see the Evolve logo  , go to the Evolve site and complete the corresponding activity, referenced by the page number in the text where the logo appears.
Overview of statistics and data presentation
Health care organizations continuously generate health care data. These data are used internally by patients, medical staff, nursing staff, and physical, occupational, and speech therapists and externally by state and federal regulatory agencies, the Joint Commission, and insurance companies, to name just a few. No matter who the user may be, statistics and data presentation focus on answering the user’s questions while complying with the standards of the health care facility. To accomplish this goal, various methods are used to calculate specific types of statistics. Different rates, ratios, proportions, and percentages are used to evaluate mortality, autopsy, and morbidity rates and census and vital statistics.
Organizing and displaying health care data are necessary. To choose appropriate methods of displaying and analyzing data, the health information management (HIM) professional must identify the level of measurement (nominal, ordinal, interval, or ratio) for variables and determine whether data are continuous or discrete. Measures of central tendency (mean, median, mode) and dispersion (variance and standard deviation) and tests of significance are used to describe and analyze data. It is also important for the HIM professional to understand basic principles of sample size determination and to be familiar with commonly used statistical tests such as analysis of variance (ANOVA), correlation, and regression.
This chapter explains basic and advanced health care statistics that are used in the health care field. Each statistic is defined and the formula for calculating each statistic is provided along with examples of how each statistic is used. Various methods of displaying data are described and illustrated.
Role of the health information management professional
Now more than ever, health care data are being collected to serve many purposes. One primary purpose is to establish health care statistics to compare trends in incidence of disease, quality and outcomes of care, and management of health information departments; another primary purpose is to conduct epidemiological research. The HIM professional’s goal is to collect, organize, display, and interpret health care data properly to meet the needs of the users. Data can be manipulated in many ways to demonstrate one result or another. HIM professionals need a broad base of knowledge to determine which data elements should be used and when data are being analyzed appropriately or inappropriately. To do this, an understanding of health care and vital and public health statistics is necessary. Furthermore, knowledge of statistical analysis is necessary so that HIM professionals can be the forerunners in data analysis. Because HIM professionals oversee a vast array of health data, it is imperative that the interpretation of the analysis and results of health care data start with them.
The HIM professional should assume the lead in recommending and using statistical tests that promote improvement in the analysis, use, and dissemination of health care data. The HIM professional fills many diversified roles and responsibilities, such as clinical vocabulary manager, data miner, or clinical trials manager.
In each of these roles, understanding and applying the methods used to collect, analyze, display, interpret, and disseminate data are essential. Responsibilities undertaken in these roles may vary from person to person. For example, the clinical trials manager may play a clearly visible role in cancer research study analysis and interpretation of the data, the clinical vocabulary manager may play a key role in developing vocabularies and standards that can be effectively used in the design of the electronic health record, and the data miner may determine the appropriate databases to use when analyzing clinical and financial data.
The HIM professional may assume other managerial roles in which statistics are used to assess productivity in coding, transcription, correspondence, and record analysis. The HIM professional should have sufficient knowledge and skills to do the following:
Health care statistics
Vital statistics
Vital statistics include data collected for vital events in our lives, such as births and adoptions, marriages and divorces, and deaths, including fetal deaths. Birth, death, and fetal death certificates are familiar reports to HIM professionals. Although each state can determine the format and content of its certificates, the National Center for Health Statistics (NCHS) recommends standard forms that most states have adopted. The purpose of the NCHS standard forms is to have a national uniform reporting system of vital statistics. These standard forms are revised periodically. The attending physician is responsible for the completion of birth, death, and fetal death certificates. The accurate completion of these certificates is supervised by the HIM department, and a copy of the birth or death certificate is kept in the medical record. A copy of the fetal death certificate is kept in the mother’s medical record.
When the certificate is complete, the original is sent to the local registrar, who keeps a copy and forwards the original to the state registrar. At each of these stages, the certificate is checked by the registrar to make sure it is complete. Individuals can obtain from the state registrar certified copies of birth, death, and fetal death certificates. Each state sends electronic files of birth and death statistics to the NCHS. The death statistics are then compiled in the National Death Index. The Death Index is a central computerized index of death record information used for research purposes by epidemiologists and other workers involved in health care research.1 The natality, or birth, statistics are compiled in the monthly vital statistics reports, and the data files are also available for purposes of research.
Refer to your state health data center or division of vital statistics to receive state-specific information on preparing and registering vital records.
Rates, ratios, proportions, and percentages
A rate is defined as the number of individuals with a specific characteristic divided by the total number of individuals or, alternatively, as the number of times an event did occur compared with the number of times it could have occurred.
A rate contains two major elements: a numerator and a denominator. The numerator is the number of times an event did occur. The number of events under study, or the numerator alone, conveys little information. However, when the numerator is compared with the denominator or the population of people in which the event could have occurred, a rate is determined. The results of a quality improvement study showed that 20 patients with diabetes had a stroke while taking a certain medication. What does this tell you? Should this medication be discontinued in this population? The data provided here include only the numerator. To compute a rate, the denominator is needed—for this example, total number of patients with diabetes who are taking the medication. This particular example included a sample size of 1000 patients. The rate is 20 in 1000 or 2 in 100. A rate is normally expressed in the following manner: 20 in 1000, 2 in 100, 1 in 100,000, 10 in 1,000,000, and so on.
However, rates are also commonly expressed as percentages by converting the rate into a decimal and then multiplying the decimal by 100. A percentage is based on a whole divided into 100 parts. In the preceding example, the rate could also be expressed as a percentage by taking 20/1000 = 0.02 × 100 = 2% or by taking 2/100 = 0.02 × 100 = 2%. This tells us that 2% of the patients with diabetes (in the study) had a stroke while taking a certain medication. To express a fraction, such as ⅕, as a percentage, the first step is converting the fraction into a decimal by dividing the numerator, 1, by the denominator, 5, to obtain 0.20. The decimal is then converted into a percentage by multiplying the decimal by 100, which can be accomplished by moving the decimal point two places to the right. The result of this process is 20%.
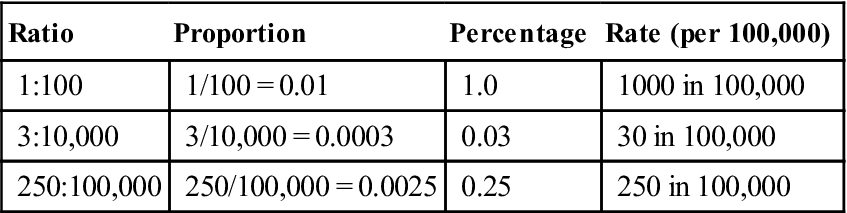
A proportion and a ratio are similar to a rate. A proportion, which is a part considered in relation to the whole, is normally expressed as a fraction—20/1000, 2/100, 1/100,000, 10/1,000,000, and so on. A ratio is a comparison of one thing to another, such as births to deaths or marriages to divorces. A ratio is expressed as 20:1000, 2:100, 1:100,000, 10:1,000,000, and so on. The number of physicians relative to patients or teachers relative to students is normally expressed as a ratio. For example, if a physician group practice has 10 physicians and 1000 patients, the ratio is 10:1000, which reduces to 1:100.
Table 10-1 summarizes examples of rates, proportions, ratios, and percentages.2,3
Table 10-1
EXAMPLES OF RATIOS, PROPORTIONS, PERCENTAGES, AND RATES
| Ratio | Proportion | Percentage | Rate (per 100,000) |
| 1:100 | 1/100 = 0.01 | 1.0 | 1000 in 100,000 |
| 3:10,000 | 3/10,000 = 0.0003 | 0.03 | 30 in 100,000 |
| 250:100,000 | 250/100,000 = 0.0025 | 0.25 | 250 in 100,000 |
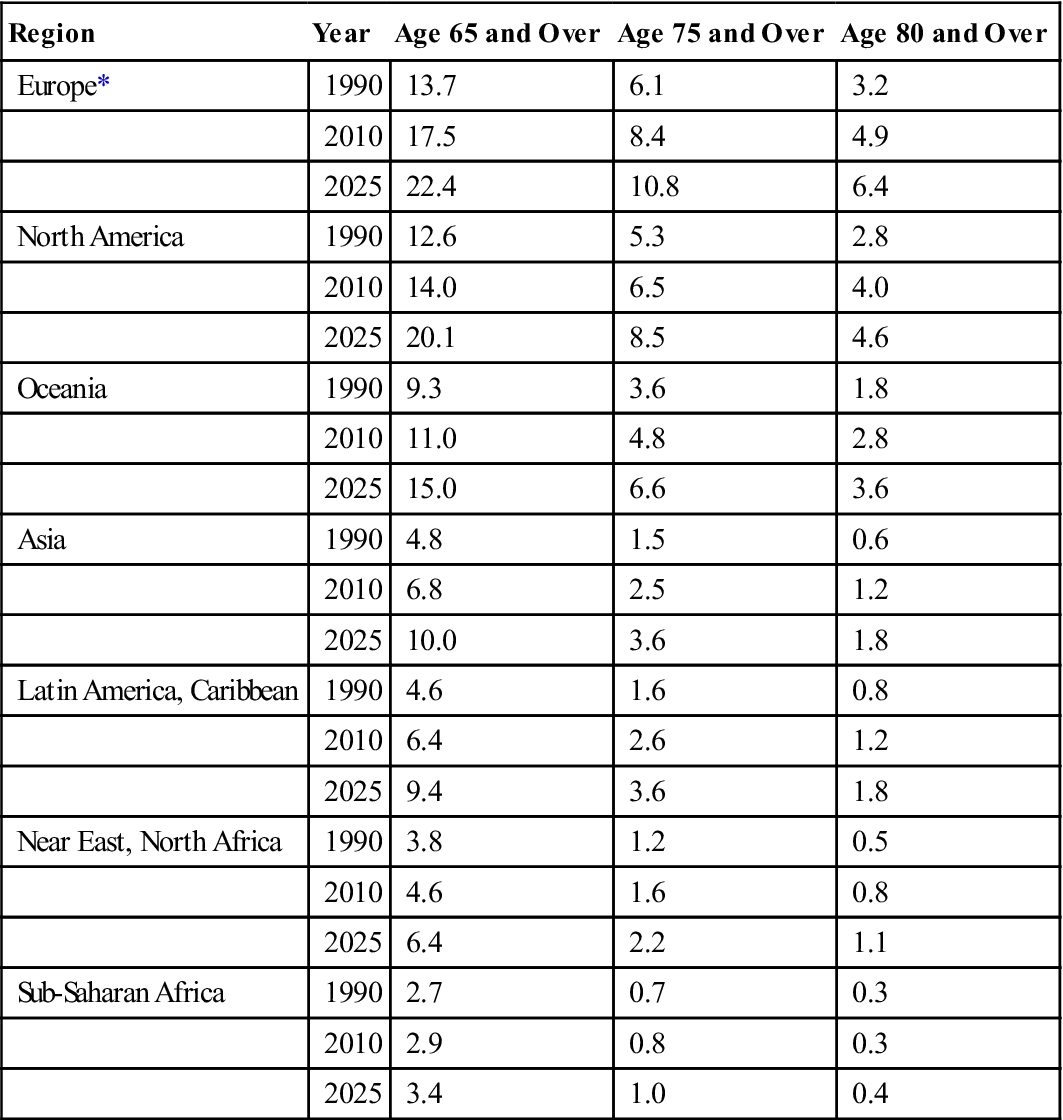
Once percentages are calculated, they can be compared across different subgroups, as seen in Table 10-2. This table concisely shows differences among geographic areas in the percentage of elderly people by age categories. It even allows a glance toward the future by projecting percentages for the years 2010 and 2025. Comparing percentages among areas shows that Europe has the highest percentage of population aged 65 years or older (13.7% in 1990) and that it should remain the world leader for at least the next 3 decades. North America and Oceania also have relatively high percentages of elderly people, which are projected to increase substantially from 1990 to 2025.4
Table 10-2
PERCENTAGE OF ELDERLY BY AGE (YEARS): 1990–2025
| Region | Year | Age 65 and Over | Age 75 and Over | Age 80 and Over |
| Europe* | 1990 | 13.7 | 6.1 | 3.2 |
| 2010 | 17.5 | 8.4 | 4.9 | |
| 2025 | 22.4 | 10.8 | 6.4 | |
| North America | 1990 | 12.6 | 5.3 | 2.8 |
| 2010 | 14.0 | 6.5 | 4.0 | |
| 2025 | 20.1 | 8.5 | 4.6 | |
| Oceania | 1990 | 9.3 | 3.6 | 1.8 |
| 2010 | 11.0 | 4.8 | 2.8 | |
| 2025 | 15.0 | 6.6 | 3.6 | |
| Asia | 1990 | 4.8 | 1.5 | 0.6 |
| 2010 | 6.8 | 2.5 | 1.2 | |
| 2025 | 10.0 | 3.6 | 1.8 | |
| Latin America, Caribbean | 1990 | 4.6 | 1.6 | 0.8 |
| 2010 | 6.4 | 2.6 | 1.2 | |
| 2025 | 9.4 | 3.6 | 1.8 | |
| Near East, North Africa | 1990 | 3.8 | 1.2 | 0.5 |
| 2010 | 4.6 | 1.6 | 0.8 | |
| 2025 | 6.4 | 2.2 | 1.1 | |
| Sub-Saharan Africa | 1990 | 2.7 | 0.7 | 0.3 |
| 2010 | 2.9 | 0.8 | 0.3 | |
| 2025 | 3.4 | 1.0 | 0.4 |
*Data exclude the former Soviet Union.
Source: U.S. Bureau of the Census: Center for International Research, International Data Base on Aging.
Mortality rates
Mortality rates are computed because they demonstrate an outcome that may be related to the quality of the health care provided. There are many types of mortality rates. Table 10-3 provides definitions and formulas for the most commonly used mortality rates.2,3
Table 10-3
| Rate | Formula |
| Gross death rate (hospital death rate) | 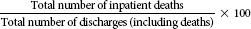 |
| Net death rate |  |
| Anesthesia death rate | 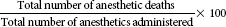 |
| Postoperative death rate | 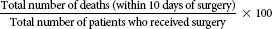 |
| Maternal mortality rate |  |
| Neonatal mortality rate |  |
| Infant mortality rate | 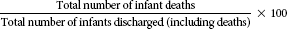 |
| Fetal Death Rates | |
| Early fetal death (abortion) rate | 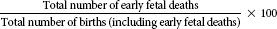 |
| Intermediate fetal deaths |  |
| Late fetal (stillborn) deaths | 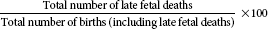 |
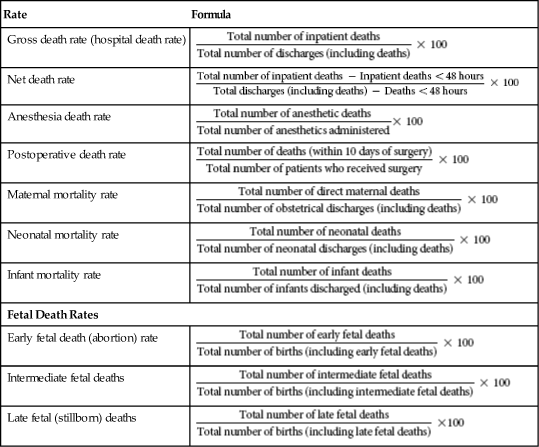
Note: The numerator and denominator in each formula must be for the same time period.
Gross death rate
The gross death rate is a crude death rate for hospital inpatients because it does not consider such factors as age, gender, race, and severity of illness, which also play an important part in death rates. The use of the gross death rate as a measure of quality in health care has been questioned because it does not take these factors into account. As long as the HIM professional is aware that other factors influence this rate and that they have not been taken into account in the calculation, the gross death rate can be a quick, useful means of analyzing mortality in hospital inpatients (see the following example of gross death rate).
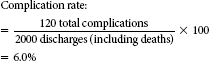
Example of Gross Death Rate
The discharge analysis report of Anywhere Health Care Facility shows 752 discharges (including deaths) for October 200X. Twelve deaths were also shown in the report.
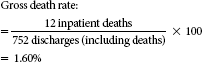
This means that 1.60% of total discharges from Anywhere Health Care Facility during October 200X ended in death or that the gross percentage of deaths, or the hospital death rate, for October was 1.60%.
Net death rate
The net death rate is different from the gross death rate because it does not include deaths that occurred less than 48 hours after admission to the health care facility. The net death rate is useful because it provides a more realistic account of patient deaths related to patient care provided by a specific health care facility. For example, a 90-year-old patient arrives at the emergency department with shortness of breath, chest pain, and arrhythmia. After being evaluated, the patient is admitted, and it is determined that he has had a severe myocardial infarction (see the example of net death rate).
Approximately 24 hours later, the patient has cardiac arrest and dies. This particular death would be included in the gross death rate but not the net death rate because it occurred less than 48 hours after admission. Reporting agencies sometimes request net death rates because they may provide a more realistic reflection of patient care provided than gross death rates do. However, net death rates still do not take into consideration other risk factors that may also affect death, such as age, gender, race, and so forth. Therefore, an important note is that health care facilities are not necessarily responsible for deaths that occur more than 48 hours after patients are admitted; on the other hand, health care facilities are not necessarily free of responsibility for deaths that occur within 48 hours of admission. For this reason, some health care facilities do not make use of or report the net death rate.
Another consideration when computing any mortality rate is a health care facility must decide whether newborn inpatients will be included in these calculations. This decision is up to the health care facility; however, if a facility decides that newborn inpatient deaths will be included in the numerator, all newborn discharges must also be included in the denominator.
Example of Net Death Rate
Inpatient deaths at Anywhere Health Care Facility for 200X totaled 50. Inpatient deaths that occurred less than 48 hours after admission to the facility totaled 15. Total discharges (including deaths) were 15,546.
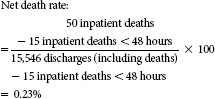
This means that 0.23% (fewer than 1%) of the deaths of discharges for 200X occurred more than 48 hours after admission to the health care facility, or that the net percentage of deaths or net death rate for 200X was 0.23%.
Anesthesia death rate
The anesthesia death rate can also be referred to as a cause-specific death rate because the death is determined by a physician or medical examiner to be due to a specific cause (e.g., an anesthetic agent). This rate indicates the number of deaths that are due to the administration of anesthetics for a specified period of time. If the recent anesthetic death rate is higher than the rate in previous periods, a focused evaluation may be necessary to determine why this is so (see the example of anesthesia death rate).
Example of Anesthesia Death Rate
Anywhere Health Care Facility performed 492 surgical procedures during November and administered 452 anesthetics. Deaths resulting from the administration of an anesthetic totaled two for the month.
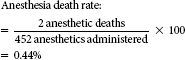
This means that 0.44% (fewer than 1%) of anesthetics administered resulted in a patient’s death, or that the anesthesia death rate for November was 0.44%.
Postoperative death rate
The postoperative death rate may be considered a cause-specific death rate as well. This death rate indicates the number of patients who die within 10 days of surgery divided by the number of patients who underwent surgery for the period; therefore, it expresses the number of deaths that may have resulted from surgical complications. In both the anesthesia and the postoperative death rates, other risk factors, such as age, gender, race, and severity of illness, are not considered. Therefore, if it is found that these rates are higher in certain periods than in others, specific evaluations are necessary to determine whether the increase is truly due to the anesthesia or surgery or to other risk factors (see the example of postoperative death rate).
Example of Postoperative Death Rate
Surgery was performed on 492 patients in the Anywhere Health Care Facility during November, and 27 of those patients died within 10 days of surgery.
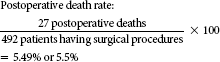
This means that 5.5% of the patients who underwent surgery died within 10 days of the procedure or that the postoperative death rate for November was 5.5%.
Maternal death rate
Death rates are further categorized according to the type of service or department, such as the maternal mortality or death rate. A maternal death results from causes associated with pregnancy or its management but not from accidental or incidental causes unrelated to the pregnancy. The maternal death rate is the number of maternal deaths divided by the number of obstetric discharges. Again, like all the rates described previously, the maternal death rate does not take into account any other risk factors. The maternal death rate is useful because maternal deaths are rare. Therefore, if there is even one maternal death in a period, it is necessary to examine the cause of death in more detail (see the example of maternal death rate).
Example of Maternal Death Rate
Anywhere Health Care Facility had a total of 752 discharges for October, including 120 obstetrical discharges (including deaths) and 1 maternal death.
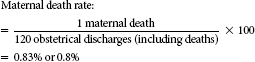
This means that 0.8% (fewer than 1%) of obstetrical patients discharged during October died, or that the maternal death rate for October was 0.8%.
Neonatal, infant, and fetal death rates
The formulas for these rates are given in Table 10-3. Neonatal and infant death rates are computed to examine deaths of the neonate and infant at different stages. A neonatal death is the death of an infant within the first 27 days, 23 hours, and 59 minutes of life. An infant death is death of an infant at any time from the moment of birth through the first year of life. Both of these figures are compared with the number of neonates and infants, respectively, who were discharged and died during the same period.
Fetal death rates are computed to examine differences in the rates of early, intermediate, and late fetal deaths. The definition of early, intermediate, and late fetal deaths may vary from state to state. These deaths are distinguished by the length of gestation or the weight of the fetus.
• Early fetal death (abortion) = less than 20 weeks of gestation or weight 500 grams or less
• Late fetal death (stillborn) = 28 weeks of completed gestation and weight more than 1001 grams
See the example of neonatal, infant, and fetal death rates.
Example of Neonatal, Infant, and Fetal Death Rates
Anywhere Health Care Facility developed the following discharge analysis report for 200X. A segment of the report shows the following:
Live births 127
Neonatal discharges 115
Neonatal deaths (before 28 days) 2
Infant discharges 50
Infant deaths (before 1 year and at or after 28 days) 5
Intermediate fetal deaths 13
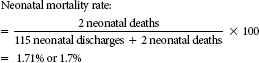
This means that 1.7% of the neonates discharged/died or that the neonatal mortality rate for 200X was 1.7%.
Note: Because the intermediate fetal death rate is most commonly used, an example of that rate is given.
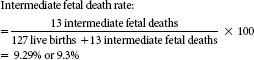
This means that intermediate fetal deaths made up 9.3% of live births (excluding the live births at or before 20 weeks’ gestation), or that the intermediate fetal death rate for 200X was 9.3%.
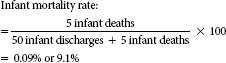
This means that 9.1% of infants discharged died, or that the infant mortality rate for 200X was 9.1%.
Using and examining mortality rates
Mortality statistics and trends are analyzed and used in many ways. When trends in mortality are examined, the possible reasons for differences in mortality rates should be considered. The influences can be grouped into three variables: time, place, and person. Changes over time include the following:
• Improvements in medical technology
• Earlier detection and diagnosis of disease
• In relation to place, the following factors influence mortality trends:
• International and regional differences in medical technology
Finally, the following characteristics of groups of people can also influence mortality:
All these factors must be taken into consideration when mortality trends are examined within the health care facility or across health care facilities in relation to the quality of care provided.5
When examining mortality rates within a specific population as in the gross and net death rates, it is important to show age-specific rates or to adjust for age. Mortality rates are routinely adjusted for age because it is the most important influence in relation to death. As a person ages, the likelihood that the person will die increases. Age-specific rates can be used, but it becomes difficult to make comparisons of data with four or more age levels or categories. Therefore, age adjustment is performed. Statistically, age adjustment removes the difference in composition with respect to age.1
Two methods can be used to perform age adjustment. One is the direct method of age adjustment, and the other is the indirect method of age adjustment or standardized mortality ratio (SMR). The calculations for these two methods are shown in Table 10-4.
Table 10-4
| Direct Method | Formula |
| Age-adjusted death rate (A) |  |
| Age-adjusted death rate (B) |  |
| Compare ages = adjusted death rates for populations A and B | |
| Indirect Method | Formula |
| SMR for population A | 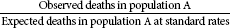 |
| SMR for population B | 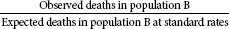 |
| Compare the two SMRs for populations A and B. |
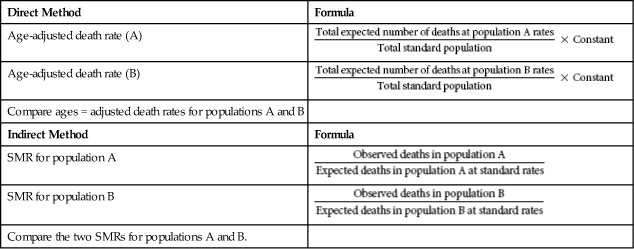
The direct method uses a standard population and applies the age-specific rates available for each population. The expected number of deaths in the standard population is then determined. To use the direct method of age adjustment, age-specific rates must be available for both populations and the number of deaths per age category should be at least five. The indirect method, or SMR, is used more often and can be used without age-specific rates and when the number of deaths per age category is small or fewer than five. Standard rates are then applied to the populations being compared to calculate the expected number of deaths, which is compared with the observed number of deaths.6
Because the SMR is used in most national and statewide mortality reports, it is explained in more detail here. For example, in Table 10-5, hospitals across a state are examined for death rates associated with the diagnosis-related group (DRG) 127—Heart Failure and Shock.
Table 10-5
DIAGNOSIS-RELATED GROUP 127 HEART FAILURE AND SHOCK
| Deaths | Medically Unstable During First Week: Major Morbidity | |||||||||||
| Hospital | Comments | Number of Patients | Average Admission Severity Score | Age 65 and over (%) | Actual Number | Expected Number | Statistical Rating | Actual Number | Expected Number | Statistical Rating | Average Stay (Days) | Average Charge ($) |
| 1 | √ | 268 | 2.5 | 85.1 | 23 | 21.03 | 35 | 25.12 | — | 7.9 | 15,420 | |
| 2 | 412 | 2.4 | 87.1 | 30 | 33.08 | 61 | 36.66 | — | 9.2 | 8149 | ||
| 3 | 201 | 2.2 | 87.1 | 17 | 12.16 | 9 | 14.52 | 9.4 | 7645 | |||
| 4 | 208 | 2.6 | 64.4 | 8 | 16.56 | + | 24 | 21.52 | 7.7 | 15,669 | ||
| 5 | 471 | 2.5 | 89.0 | 40 | 40.31 | 40 | 44.18 | 8.3 | 8193 | |||
| 6 | 90 | 2.6 | 78.9 | 9 | 7.49 | 12 | 9.35 | 9.0 | 14,766 | |||
| 7 | √ | 347 | 2.3 | 81.3 | 36 | 22.31 | − | 24 | 27.78 | 8.9 | 12,099 | |
| 8 | 291 | 2.1 | 90.0 | 20 | 18.15 | 20 | 20.97 | 8.7 | 9180 | |||
| 9 | 255 | 2.3 | 82.0 | 11 | 17.04 | 18 | 21.09 | 6.4 | 6292 | |||
| 10 | 477 | 2.2 | 85.5 | 32 | 29.55 | 32 | 36.78 | 8.4 | 12,039 | |||
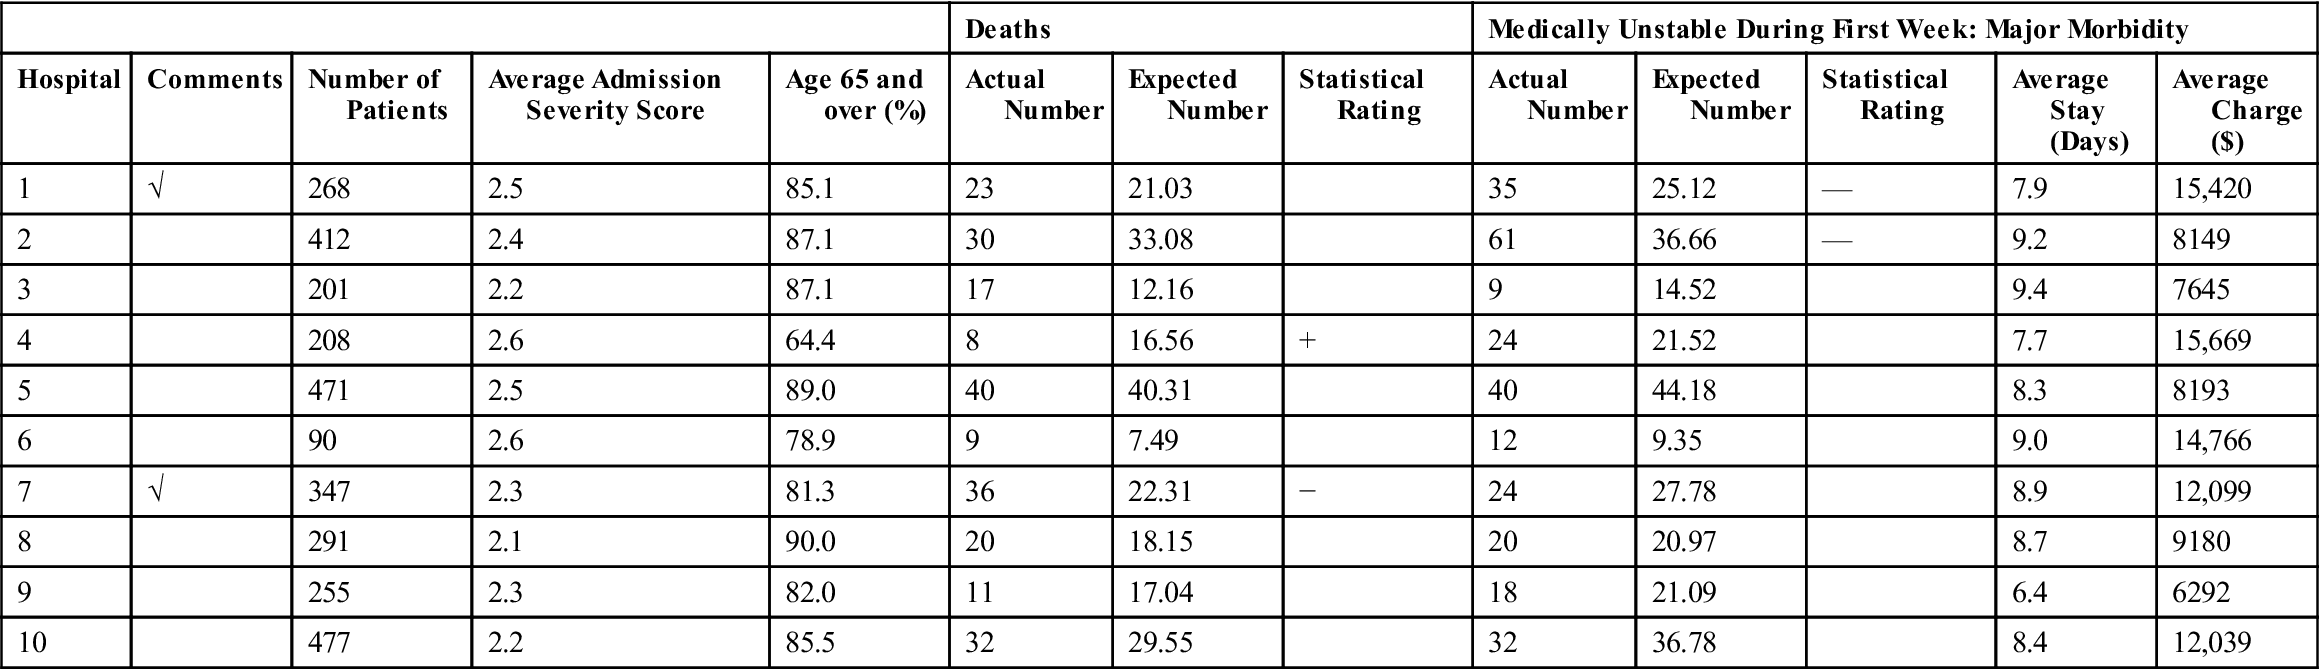
The actual or observed number of deaths in the hospital is compared with the expected number of deaths. The expected number of deaths is taken from a comparative national database adjusted for age and patient severity for each DRG. Table 10-5 shows a sample of the hospitals that treated patients included in DRG 127 and the actual and expected number of deaths. An SMR of 1 means that the number of observed deaths and the number of expected deaths are equal, and therefore the mortality rate is equal to what is expected from national norms. An SMR less than 1 means that the observed deaths are lower than the expected deaths, and therefore the mortality rate is lower than expected from national norms. An SMR of greater than 1 means that the observed deaths are greater than the expected deaths, and therefore the mortality rate is higher than expected from national norms (see the examples of use of SMR).
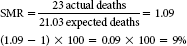
Example Use of Standardized Mortality Ratio (SMR)
For hospital 1, an SMR of 1.09 means that the hospital had a 9% higher mortality rate for DRG 127 than is expected from national norms. This is calculated as follows:
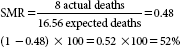
Example Use of Standardized Mortality Ratio
For hospital 4, an SMR of 0.48 means that the hospital had a 52% lower mortality rate for DRG 127 than is expected from national norms. This is calculated as follows:
The statistical rating column displayed in Table 10-5 is covered later in this chapter in the discussion of tests of significance.
Autopsy rates
Autopsy rates are computed so that the health care facility can determine the proportion of deaths in which an autopsy was performed. This enables the facility to examine why a higher or lower autopsy rate may be seen from one month to another. Autopsies are performed to determine the cause of death, to better understand the disease process, or to collect tissue samples, as in patients with Alzheimer’s disease. Autopsy rates can be further broken down to show the gross autopsy rate, or the rate of autopsies performed for total inpatient deaths; the net autopsy rate, or the rate of autopsies performed for inpatient deaths, excluding unautopsied coroner cases; and the adjusted hospital autopsy rate or the autopsy rate performed for all deaths of hospital patients whose bodies are available or brought to the hospital for autopsy (those not removed by coroners, medical examiners, and so on). Autopsies may be performed after the deaths of inpatients, outpatients, home care patients, skilled nursing care residents, patients who died at home, previous patients, and so on (see example of hospital autopsy rates). Table 10-6 presents the most commonly used autopsy rates.3
Table 10-6
| Autopsy Rate | Formula |
| Gross autopsy rate (ratio of inpatient autopsies to inpatient deaths) | 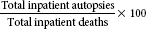 |
| Net autopsy rate | 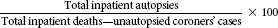 |
| Hospital autopsy rate (adjusted) Total hospital autopsies 100 | 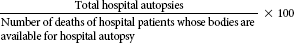 |
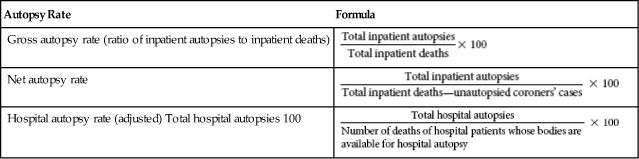
Note: Numerators and denominators in each formula must be for the same time period.
Example of Hospital Autopsy Rates
Anywhere Health Care Facility developed the following report regarding discharges, deaths, and autopsies during January 200X.
Hospital Statistics
Discharges (including deaths) 1000
Total deaths 56
Inpatient (including two coroner cases) 52
Outpatient 2
Home care 2
Autopsies 13
Inpatient 10
Outpatient 1
Home care 2
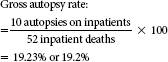
This means that 19.2% of the hospital inpatients who died during January received an autopsy, or that the gross autopsy rate was 19.2%.
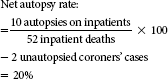
This means that 20% of the hospital inpatients who died during January received an autopsy within the hospital, or that the net autopsy rate was 20%.
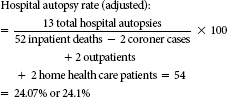
This means that 24.1% of all health care facility patients who died in January (inpatients, outpatients, and home care patients) received an autopsy within the hospital, or that the adjusted hospital autopsy rate was 24.1%.
Morbidity rates
Morbidity rates can include complication rates, such as community-acquired, hospital-acquired or nosocomial, and postoperative infection rates. They can also include comorbidity rates and the prevalence and incidence rates of disease.
Hospitals use each of these rates to study the types of disease or conditions that are present within the health care facility and to examine the quality of care provided by the facility. These rates can aid health care facilities in planning specific health care services and programs. Table 10-7 provides a summary of the more common morbidity rates and the formulas used to compute them.3
Table 10-7
| Definition | Formula |
| Complication (condition that occurs during hospital stay that extends length of stay by at least 1 day in 75% of cases)* | 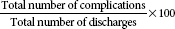 |
| Nosocomial infection rate (infection that occurs >72 hours after admission to hospital)* |  |
| Postoperative infection rate* | 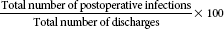 |
| Community-acquired infection rate (infection that occurs in community or <72 hours of admission)* | 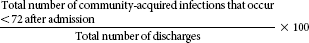 |
| Total infection rate (includes both nosocomial and community-acquired infections)* |  |
| Comorbidity (preexisting condition that will, because of its presence with principal diagnosis, increase the length of stay by at least 1 day in 75% of cases)* | 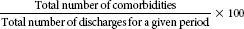 |
| Prevalence (number of people with specific disease at specified period of time; number of existing cases of disease) | 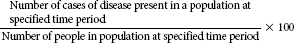 |
| Incidence (number of people with disease during specified time period; number of new cases of disease) | 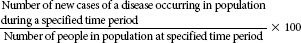 |
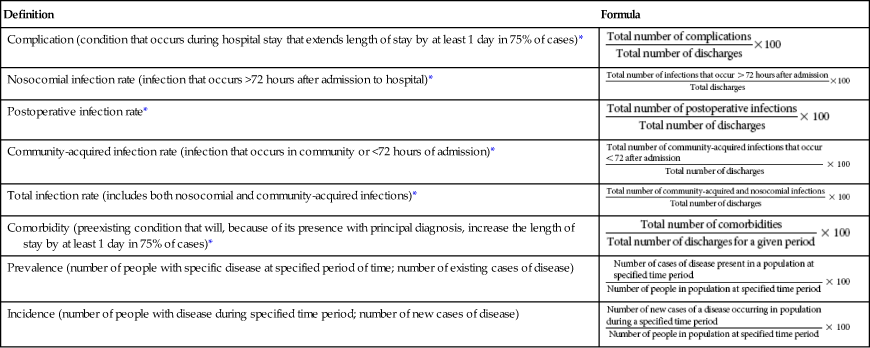
*Numerators and denominators in each formula must be for the same time period.
Complications include infections, allergic reactions to medications, transfusion reactions, decubitus ulcers, falls, burns, and errors of medication administration. The complication rates for any of these complications can also be computed by using the formula for complication rates listed in Table 10-7.
One of the most common complications is infections. Infection rates are computed so that the health care facility can determine when infections developed and, therefore, how they may be prevented. A nosocomial, or facility-acquired, infection rate includes infections that occur more than 72 hours after admission.7 Health care facilities may be more interested in this rate because it may show infections that occur as a result of the care that is provided in the facility. Further analysis of the nosocomial infection rate may show that other risk factors, such as age, compromising conditions such as cancer, the use of chemotherapy treatment, and the overall severity of the disease, may make an individual patient more susceptible to infection. Therefore, as with several of the mortality rates, other factors play a part in the development of the nosocomial infection. The postoperative infection rate is normally calculated to pinpoint how the infection may have developed. Postoperative infection rates are important to examine because the health care facility can determine which infections occur after surgery and are probably a result of the surgical procedure.
Distinguishing between nosocomial and community-acquired infections is important because community-acquired infections are typically present less than 72 hours before admission to the health care facility. Health care facilities may be interested in this rate because it demonstrates the infections that patients probably had before admission to the facility. If the facility finds that their community-acquired infection rate is high, they may need to develop community-wide prevention programs, such as administering a vaccine for pneumonia. Health care facilities can benefit from analysis of their total infection rate (both nosocomial and community-acquired infections) to determine the additional cost, length of stay, and overall effect the infections have on the quality of care provided to the patient.
Comorbidities are preexisting conditions, such as diabetes, hypertension, and osteoporosis. Analysis of the comorbidity rate is important because comorbidities can increase the length of stay and affect the outcome of care provided. Comorbidities include some of the other risk factors that affect mortality and morbidity rates.
Morbidity Data for Anywhere Health Care Facility During March 200X
Discharges (including deaths) 2000
Surgical operations 1543
Number of comorbidities 238
Number of complications 120
Nosocomial infections (includes postoperative infections) 22
Postoperative infections 8
Community-acquired infections 30
Stay updated, free articles. Join our Telegram channel

Full access? Get Clinical Tree


