Vulnerable Populations
Frances A. Maurer
Focus Questions
Are there groups that are at greater risk for diminished or no access to health care services?
What predisposing factors make some people more vulnerable than others?
What are some of the risks associated with vulnerable groups?
What are some of the most common health problems for vulnerable groups?
What impact does lack of health insurance have on people?
What types of social services are available for vulnerable groups?
Has cost containment affected services? If so, in what ways?
How can community/public health nurses help vulnerable groups access services?
Key Terms
Extremely poor
Food insecurity
Homelessness
In-kind payments
Migrant worker
National housing wage
Poverty
Poverty index
Runaways
Seasonal worker
Throwaways
Vulnerable population
Vulnerable populations
Within the population of the United States, there are aggregates or groups that run a disproportionately greater risk for poor health than the remainder of the population. These groups have certain characteristics, traits, or experiences that increase their vulnerability. All health care professionals, especially community health nurses, come in frequent contact with individuals and families at great risk.
Definition of Vulnerable Population
A vulnerable population is a group or groups that are more likely to develop health-related problems, have more difficulty accessing health care to address those health problems, and are more likely to experience a poor outcome or shorter life span because of those health conditions. There are a number of characteristics, traits, or circumstances that enhance the potential for poor health. Healthy People 2020 (U.S. Department of Health and Human Services [USDHHS], 2010) has identified certain groups as more vulnerable to health risks, including the poor, the homeless, the disabled, the severely mentally ill, the very young, and the very old. See the Healthy People 2020 box on this page for more information.

Objectives Relevant to Vulnerable Populations—Improve Access to Care
2. Increase the proportion of persons who have a specific source of ongoing care.
| Age Group | 2008 Baseline | 2020 Target |
| Children under 17 years | 94.3% | 100% |
| Adults 18 years and older | 81.3% | 89.4% |
Data from U.S. Department of Health and Human Services. (2010). Healthy People 2020. Washington, DC: Author. Available at http://www.healthypeople.gov. Refer to Chapters 7 8 10 23 24 25 27 28 31 32 and 33 for specific objectives related to specific vulnerable populations.
Not all people who are at risk for poor health would be considered vulnerable. To be considered vulnerable, a person or group generally has aggravating factors that place them at greater risk for ongoing poor health status than other at-risk persons. For example, a middle-aged obese man with a sedentary lifestyle and hypertension would be considered at risk for cardiac problems. If that man also had an income below the poverty level, no health insurance, and stressors related to living conditions, he would be more likely to be vulnerable to ongoing poor health status than a man with similar risk factors but with an adequate income and health insurance. The man in poverty would be more likely to experience difficulties obtaining and maintaining a relationship with a primary care provider, would have problems accessing tests and procedures for diagnosis and ongoing monitoring, and would have difficulty obtaining and paying for the appropriate medications.
Multiple Factors Increase Vulnerability
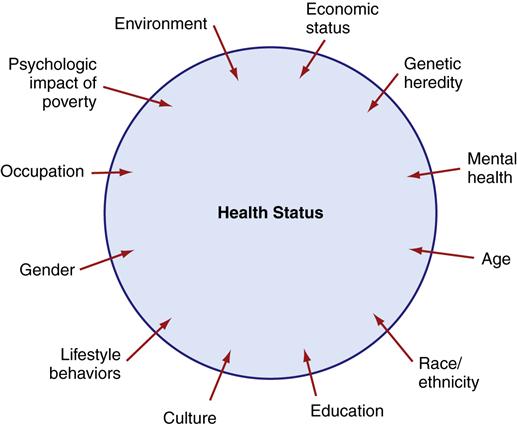
The more risk factors for poor health a person or group has, the more likely that person or group will be vulnerable. Figure 21-1 illustrates the interrelationships among multiple factors that affect health status. Some of these factors include lower socioeconomic status, lifestyle behaviors, the psychological impact of poverty, genetic inheritance, race, ethnicity, and gender, as well as those factors previously mentioned in the discussion. As noted in Chapter 7, a person or group can alter some but not all factors associated with health risks. For example, a person who smokes can stop smoking and reduce his or her risk for lung cancer and heart disease, but a person cannot alter his or her genetic heritage. Some lifestyle situations are more resistant to change and are not easily overcome. For example, someone living in poverty might be there as a result of multigenerational poverty, poor education, poor health, or sudden change in financial situation. Persons with sudden changes in financial situation (e.g., as a result of a loss of employment or a downturn in the economy) are more likely to easily improve their financial situations. Others in poverty face years of struggle and many roadblocks to improving their economic situations.
Nurses are accustomed to identifying risks associated with poor health and devising interventions to improve health status. Working with vulnerable populations, nurses must become adept at identifying risks that are amenable to intervention as well as those that require greater effort to overcome and those that are not alterable. This chapter identifies some of the most important factors associated with increased vulnerability and their relationship to poor health. Other chapters in this book address specific vulnerable groups, including children (Chapter 27), older adults (Chapter 28), sexually active adolescents (Chapter 24), individuals exposed to violence (Chapter 23), addicted individuals (Chapter 25), and the mentally ill (Chapter 33), and these groups are not discussed in detail in this chapter.
Poverty
The most important factor associated with health status is economic status. Poverty drastically increases a person’s or group’s vulnerability to poor health status.
Poverty Defined
When we think of the poor, we think of people living in poverty. People who are poor have difficulty providing the basic necessities of food, clothing, and shelter for themselves and their families. The United States has chosen to set a living standard it considers “adequate,” and persons who fall below this income are considered poor. This standard is called the poverty index or threshold.
The poverty index is derived by determining the costs of purchasing specific goods and services. It incorporates the cost of food for a minimum adequate diet (called the Economy Food Plan) and multiplies that cost by a factor of three to arrive at a basic subsistence standard. Adjustments are made to that figure for family size and age of household members (Table 21-1). In 2010, the poverty index for a family of four was $22,113. Any family of four whose income falls below this figure is considered to be poor, and any family whose income is above this level is considered not poor. However, the income standards used to set the poverty index are in dispute. Criticism of the income standards centers around conceptual and measurement issues.
Table 21-1
Poverty Threshold in 2010 by Family Size and Number of Related Children under 18 Years
| Family Unit* Size | Poverty Threshold |
| 1 | $11,344 |
| 2 | $14,602 |
| 3 | $17,552 |
| 4 | $22,113 |
| 5 | $26,023 |
| 6 | $29,137 |
| 7 | $36,635 |
| 8 | $35,879 |
| 9 or more | $43,845 |
*One or more adults and all related children.
From U.S. Bureau of the Census. (2010). Poverty threshold 2010. Washington, DC: Author. Retrieved September 7, 2011 http://www.census.gov/hhes/www/poverty/data/threshld/thresh10.xls
Criticisms of the Poverty Index
There are many specific concerns with the criteria used to determine the poverty index (Citro & Michael, 1995; Short et al., 1999; U.S. Bureau of the Census [Census Bureau], 2010). Website Resource 21A provides a summary of specific criticisms of poverty measurements. The major criticism of the current poverty index is that it is an inadequate measure of poverty and should include costs of food, clothing, and shelter.
Another criticism centers on the issue of in-kind payments. In-kind payments are governmental subsidies such as food stamps, public housing assistance, and vouchers provided by the Women, Infants, and Children (WIC) program that are not counted as income. Were these benefits counted as income, critics contend, the number of poor in the United States would be substantially lower (Lewit et al., 1997). The National Research Council performed an extensive review of the poverty index in 1995. The council found that including certain omitted items (such as in-kind payments) would have lowered the number of people categorized as living in poverty, but considering other factors (such as adequate adjustment for inflation of basic goods, work-related expenses, child care expenses, medical expenses) would have raised the poverty threshold. They recommended that a new poverty measure be adopted, one that better reflects the actual value of benefits and income and is more easily adjustable for changes in inflation and the cost of living (Citro & Michael, 1995).
The U.S. Census Bureau and the Bureau of Labor Statistics have developed a prototype index to be used in conjunction with the current poverty index. This index, the Supplemental Poverty Measure, addresses many of the major concerns with the poverty index. The federal budget for 2011 did not include funding for this project (Census Bureau, 2011a). At present the original index is still in use.
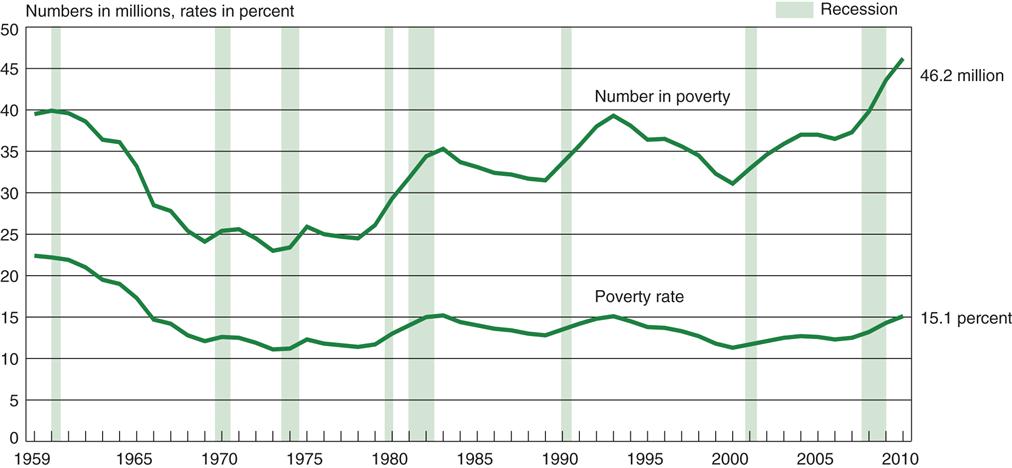
The incomes of 15.1% of all persons in the United States fell below the poverty level in 2010. This translates into 46.2 million, an increase of 6.6 million from 2008 (DeNavas-Walt et al., 2011). Of that group, 20.4 million (44%) had incomes of less than 50% of the poverty level. People with incomes at 50% or less of the poverty level are considered the extremely poor.
Fluctuations in the Poverty Level
The poverty level remained relatively stable from the 1970s through the mid-1980s. Since then, however, this country has experienced at least one period of high inflation, four episodes of substantial economic recession, and high unemployment, which have pushed a large number of families closer to the poverty index ceiling. Figure 21-2 provides an illustration of the fluctuations in poverty level and shows the impact of recession on the poverty level. According to the U.S. Census Bureau there are approximately 60.4 million people whose income is less than the poverty level or no more than 25% above the poverty level (DeNavas-Walt et al., 2011).
Proponents of changing the poverty index measures believe that the government’s reluctance to revise them is tied to the political implications of such a move. If the newer measures were adopted or inflation adjustments were done yearly, a substantial number of people might be added to the poverty rolls (Betson & Michael, 1997). No one in government wants to be held responsible for policies that could increase the size of the impoverished population.
Shrinking Middle Class at Risk for Poverty
The gap between rich and poor is widening, which leaves the poor relatively poorer in general terms. The middle class is shrinking, and some middle-class families have lost ground and slipped into a lower economic level. Although most Americans do not live in poverty, the trend toward increasing numbers of poor is a matter of concern. Americans who are relatively well off (median family income, $50,599) have become uneasy about their future status. In fact, the U.S. Census Bureau reports that the distribution of income has become more unequal over time. In 2010, the mean income of those in the top 20% was 15 times greater than the income of families in the lowest 20%. That same year the top 20% of households earned more than the combined income of the other 80% of households (DeNavas-Walt et al., 2011). The nation’s experience with economic slumps or recessions and the growing government budget deficit serve as uneasy reminders that many more American families could easily suffer economic reversals and join the poor.
Effects of Socioeconomic Status on Health
Socioeconomic status influences health status in many different ways. It is not sufficient to consider only access to health care; the general standard of living is also an important influence on a person’s level of health. Poor families have a harder time acquiring the basic necessities of food, clothing, shelter, and transportation. Diet, living conditions, and occupational hazards, as well as access to health care and the time frame in which medical care is sought, are all affected by income and, in turn, affect an individual’s health. Because of cost, the poor often have to make choices between medical care and other basic needs. Persons at or below the poverty level are 5 times more likely than those better off to delay seeking care because of cost and 3.5 times more likely not to get care at all (Kaiser Family Foundation [KFF], 2010; USDHHS, 2006). People below the poverty level are twice as likely to use the emergency room as those who are better off. Public health care practitioners must be aware of all the risks associated with poverty if they want to improve health status in poor populations.
Health Status Indicators and Poverty
Mortality figures are used as one means of measuring health status. The effects of income on mortality are measured directly and indirectly. Studies suggest a link between very poor economic status and early death (Hadley, 2005; Institute of Medicine [IOM], 2001)
Certain illnesses have been identified as being more common among people living in poverty than in middle-income and high-income groups (Braverman, 2011; USDHHS, 2006). These include anemia, arthritis, asthma, diabetes, hearing impairments, influenza, pneumonia, tuberculosis, and certain eye abnormalities (Briody, 2010; USDHHS, 2006). Adults 45 to 64 years of age who are below the poverty level are two to three times more likely to have three or more chronic conditions than are people with incomes of 200% or more above the poverty level (KFF, 2010). They are also more likely to experience severe headaches, migraines, low back pain, neck pain, and joint pain than are people in better economic circumstances (Braverman, 2011; USDHHS, 2006).
Impact on Health of Multiple Stressors Associated with Poverty
The poor and vulnerable groups live with inadequate resources and ongoing crises as they attempt to meet their and their families’ needs for food, clothing, and shelter. Many worry about the safety of their neighborhoods. These multiple unrelenting stressors can impact a person’s health, mood, and sense of well-being (Evans & Kim, 2010). People in poverty are more likely to report feeling hopeless, powerless, and unable to manage their problems. Depression is a commonly reported problem in vulnerable people. Research has suggested that adverse changes in income are associated with depressive symptoms (Heflin & Iceland, 2009). The stresses associated with poverty have other adverse effects on mental health. Adults with incomes at or below the poverty level are seven times more likely to have serious psychological distresses than those with higher incomes (200% or more of the poverty level) (Pratt & Brody, 2008; USDHHS, 2006).
Personal Perceptions of Individual Health
The poor are more likely than the nonpoor to see themselves as physically unwell. Health interview surveys are used to measure an individual’s perception of health status. In these surveys lower-income persons have consistently reported greater disability in terms of impairment of activities or confinement to bed, more worry and discomfort from illness, and higher dissatisfaction with their health status (Brooks-Gunn & Duncan, 1997; Cantor et al., 1998). About 72.3% of the poor report at least one limitation in activity, whereas only 44.1% of the persons with incomes at 400% of the poverty level do so. The poor perceive their health as poor or fair (21.8%) at almost three times the rate reported by the nonpoor (8.6%) (USDHHS, 2011).
Income Level and Access to Health Care
People who are poor are less likely to have health insurance, even if employed. Many do not qualify for health assistance programs. Because of their income level and uninsured status, many are asked to provide immediate payment when seeking health care services. These factors influence an individual’s ability to obtain health care when the need arises. Table 21-2 compares the use of various health care services by the poor, near poor, and nonpoor. Note that the poor make use of primary prevention services, such as dental care, childhood immunizations, and mammograms, less often than those with more economic resources. Acute care services, such as care in hospital emergency departments and hospitalization in short-stay facilities, are more commonly used by the poor, because they often delay seeking treatment until their condition requires more intensive care.
Table 21-2
Types of Health Care Services Used by Socioeconomic Status
| Poor | Near Poor | Nonpoor | |
| One to three health care visits to doctor’s office or emergency department, or home visits | 39.3% | 41.4% | 47.3% |
| No health care visits to office or clinic (children under 18 years) | 13.7% | 14.4% | 9.8-5.6%** |
| Vaccination rate, combined series (children 19 to 35 months) | 41% | 46%* | * |
| No usual source of health care (children under 18 years) | 8.6% | 8.3% | 4.6-2.1%** |
| No usual source of health care (adults 18 to 64 years) | 32.7% | 30.3% | 19.7-10.6%** |
| One emergency department visit during past 12 months (children under 18 years) | 32.3% | 23.8% | 18.9-16%** |
| Dental visits in past year (children 2 to 17 years) | 71.7% | 75.2% | 77.1-87.8%** |
| Dental visits in past year (adults 18 to 64 years) | 42.7% | 45.3% | 59.1-77.9 %** |
| Untreated dental caries | |||
| Children 6 to 19 years | 25.3% | 18.3% | 14.2-9.3%** |
| Adults 20 to 64 years | 41.7% | 22.2% | 16.2-11.5% |
| Mammogram (women over 40 years) | 51.4% | 55.8% | 64.4-79%** |
| One or more hospital stays in the past year | 8.9% | 6.9% | 5.6-4.5%** |
| Reduced access, did not get or delayed care due to cost during last 12 months | |||
| Medical care | 24.8% | 24% | 16.8-7.2%** |
| Prescription drugs | 20.5% | 18.8% | 12.2-4.1%** |
| Dental care | 30% | 27.8% | 17.9-6.8%** |
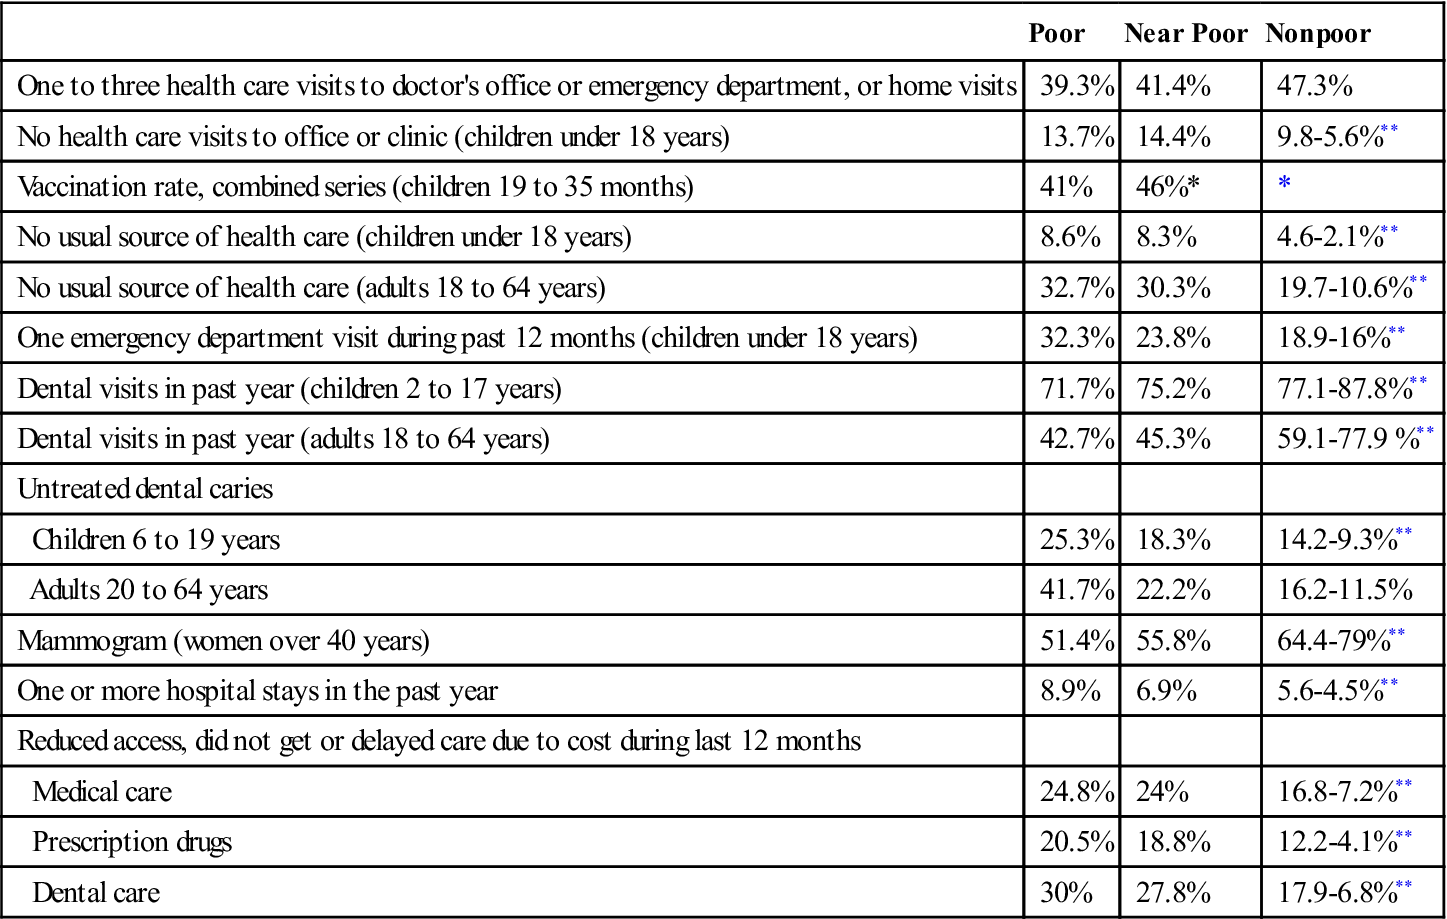
*Combined data for near poor and nonpoor in these categories.
**First rate is for 200 to 399% of poverty level; second rate for 400% or more of poverty level.
Data from U.S. Department of Health and Human Services. (2011). Health, United States, 2010. Washington, DC: U.S. Government Printing Office.
Race and ethnicity and their relationship to income and health status
In the United States, ethnic and racial minorities are more vulnerable to poor health status than the remainder of the population. They are also more likely to be poor, which illustrates the relationship between poverty and health. Healthy People 2020 is stressing the social determinants of health in order to reduce health disparities between subgroups of the U.S. population.
Mortality and Morbidity
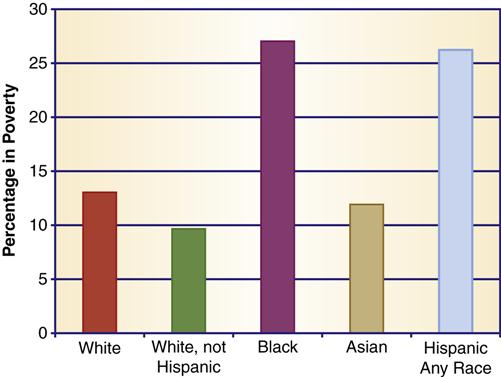
Two important indirect measures of the influence of income on health are (1) comparison of mortality rates for white and minority populations in the United States and (2) examination of the total mortality rates from illnesses that affect the poor to a greater degree than other income groups. Examining the differences between whites and minorities is an appropriate indirect measure of the effect of income on health because minorities are at greater risk for poverty. Approximately 15.1% of the population is classified as poor. When this group is broken down by racial composition, white Americans are found to bear less risk for poverty than other racial and ethnic groups (Figure 21-3). Blacks and Hispanics have double the risk for poverty than do white Americans (DeNavas-Walt et al., 2011).
The mortality rate for blacks is approximately 23% higher than that for whites. The death rate is 9.8 per 1000 persons for blacks and 7.6 per 1000 for whites (USDHHS, 2011). Mortality rates for the three leading causes of death show the same trend in racial disparity. Deaths from heart disease, stroke, and cancer are all higher in blacks than in whites. The severity of illness is also different. Blacks have a greater chance of high health care expenditures, a measure of more severe illness (see Chapter 10).
Some other racial/ethnic groups also have greater rates of poverty than the white population, and most experience health disparities. The life expectancy of African Americans is 4 years less than that of white Americans (USDHHS, 2011). American Indians, blacks, and Hispanics have a higher rate of diabetes than the white population (see Chapter 7, Figure 7-5). Other, more affluent racial/ethnic groups—for example, Chinese Americans and Japanese Americans—experience less health disparity and sometimes exhibit more favorable scores on health status measures than do white Americans (see Chapter 8).
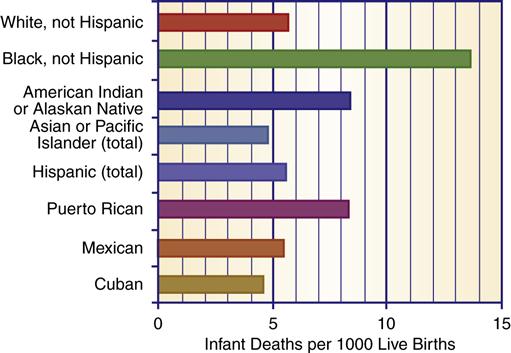
Infant mortality is another indicator of health status. Infant death rates are higher for blacks and some other minorities (Figure 21-4). In 2006, the black infant mortality rate was 13.5 per 1000 live births, which is 2.5 times higher than the white infant mortality rate (5.7 per 1000) (Morbidity and Mortality Weekly Report [MMWR], 2011). Note that Figure 21-4 illustrates different infant mortality rates for subsets within a certain racial/ethnic minority. For example, Puerto Ricans have a higher infant mortality rate, whereas Mexicans have a lower infant mortality rate.
Other Factors That Impact Racial/Ethnic Health Disparities
Many factors contribute to health disparities. Poverty is perhaps the most important factor, but other factors also play a role. Discrimination, the health care environment, and the specific health behaviors and beliefs of individuals and groups also affect health status. Research indicates that racial and ethnic minorities receive a lower quality of health care than nonminorities, even when conditions are comparable (insurance status, income, age, and severity of condition) (Russell, 2011; Smedley et al., 2002). Health behaviors and beliefs influence health because, among other things, they dictate how and when people seek health care services, what health practices they employ, and their diet and exercise behaviors.
Diet, Health, Socioeconomic Status, and Racial/Ethnic Influences
Income and nutritional status are positively correlated. Studies indicate that American Indians, Alaska Natives, Mexican Americans, and African Americans—all populations with greater levels of poverty than whites—have a significantly greater risk for nutritionally related diseases. Although some dietary choices are the result of cultural influences, income-related restrictions on diet choices play a greater role in nutritional deficiencies in all groups, especially minorities.
In studies of minority children, vitamin and mineral deficiencies are found to be relatively commonplace. Growth retardation in preschool children is a health indicator and might reflect the inadequacy of a child’s diet (USDHHS, 2000). In American Indian and Hispanic children, there is an increased incidence of linear growth stunting (Lewit & Kerrebrock, 1997; Trowbridge, 1984). Some studies find that all children in poverty show a greater incidence of growth stunting than do children from other economic environments (Brooks-Gunn & Duncan, 1997; USDHHS, 2000). Diet and weight relationships in minority children indicate greater deviation from average weights, either above or below the norm. Classic studies of minority populations in America found that many more children were either underweight or overweight with unbalanced diets (USDHHS, 2000; Yanochik-Owen & White, 1977). In 2008 the obesity rate for black and Mexican children was higher than for white children, and those children at or below the poverty level had a higher rate of obesity than children whose families had more income (USDHHS, 2011). Ogden and colleagues (2010) compared children between 2 and 19 years and found a higher rate of high body mass index among Hispanics, Mexican Americans, and African Americans as compared to white children of the same ages.
Obesity is at epidemic proportions in the United States. New studies indicate that adults of all economic levels have a similar risk for obesity. However, obesity is more common among Hispanic and African American men and women than among whites (USDHHS, 2011). First Lady Michelle Obama has made it her campaign to reduce obesity and improve healthy eating in the American population.
Diet-related health issues are more common in the poor. Adults below the poverty level have a greater risk of having high serum cholesterol levels than those whose income is above the poverty level (USDHHS, 2011). Anemia is a frequent health problem in low-income persons. Studies have found anemia to be especially prevalent in blacks, American Indians, and Mexican American children in poverty (Chong, 2007; USDHHS, 2000). Anemia and concomitant low weight gain in pregnancy are also more prevalent in minorities (USDHHS, 2000; Ural, 2011). Poverty doubles the risk of low weight gain during pregnancy (Ural, 2011). Several governmental programs have been designed specifically to support the health and diet needs of poor pregnant women and their children (see Chapter 24).
Poverty is correlated with food scarcity and hunger. Some people in this country still experience hunger and lack access to needed food. The federal government uses the term food insecurity to describe the condition of people who do not consistently have access to enough food to allow for active and healthy living (Children’s Defense Fund [CDF], 2005a, p. 18). In 2010, 17.2 million people were food insecure. Twenty-three percent of people with incomes below 130% of the poverty index experience food scarcity while only 7.4% with incomes at or above 185% of the poverty index experience food scarcity (Coleman-Jensen et al., 2011). Healthy People 2020 is committed to eliminating hunger in the American population.
The uninsured
Lack of health insurance increases a person’s risk for poor health and premature death (Hadley, 2005; IOM, 2001; Trossman, 2011; USDHHS, 2011). The uninsured are less able to access health care services and are more likely to forgo needed health care because of cost concerns (Hadley & Holahan, 2004). Uninsured Americans get about 55% of the medical care of people with insurance. People in poverty, the homeless, racial and ethnic minorities, and migrant populations are all at greater risk for no health insurance coverage, which increases their vulnerability to poor health.
Number of Uninsured
More than 49.9 million people, or 16.3% of the population, do not have health insurance (DeNavas-Walt et al., 2011). Others are without health insurance for some time during the calendar year. For example, adolescents over 18 and new unemployed college graduates might lose coverage under their parents’ plan. The U.S. Department of Health and Human Services (USDHHS, 2011) reports that 37% of the population younger than 65 years of age is uninsured at some point during a given year and 17.5% are uninsured throughout the year. The new health care reform legislation includes conditions that allow children to continue on their parents’ health plan until age 25.
The number of uninsured has increased as our economy—with large numbers of low-level entry jobs and fewer blue collar high-paying job opportunities—has left more people unemployed or underemployed and without employer-provided insurance. Even workers with health insurance plans are vulnerable to loss of coverage. An increasing number of employers are eliminating or reducing health insurance coverage to employees and their families (see Chapter 4). Workers who are between jobs and workers whose employers do not offer health insurance coverage are also at risk for having no insurance coverage. The Consolidated Omnibus Budget Reconciliation Act (COBRA) provides health insurance portability for workers who change jobs, but many find the premiums too costly. Only approximately 9% of eligible workers participate in the COBRA program. Individuals with no health insurance who try to find individual insurance plans find the costs too high. In 2007, the estimated cost of COBRA family health insurance was between $4704 (individual) and $12,680 (family) (Doty et al., 2009). No newer data are available, although the cost of insurance has continued to rise every year since that report. About 53% of adults who do not have health insurance cite cost as the major reason they are uninsured (Insurance Information Institute, 2007).
Employment Status and Health Insurance
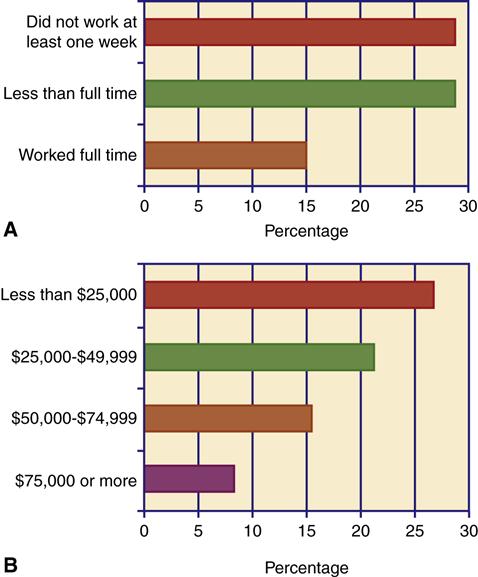
It is a misconception that most of the uninsured are unemployed (Figure 21-5). Most of the uninsured are workers or the dependents of employed persons. Low-income workers are three times less likely to have health insurance (26.9%) than those with higher incomes (8% of those with incomes over $75,000). Most workers without health insurance are employed in lower-paying jobs with few or no benefits. Many of the uninsured work in service industry positions, such as food or janitorial services. Many have to work two or three jobs to support their families. Unlike nonworkers in poverty, low-income workers are not covered by the Medicaid program.
Uninsured Children
Health care is especially important for children because delayed treatment or missed opportunities for health care services have lifelong consequences. Poor health in children also affects their educational progress. There are 7.3 million uninsured children in the United States (DeNavas-Walt et al., 2011). Expansion of health insurance for children has been a major goal of government. In fact, the uninsured rate among children dropped from 25% in 1997 to 12% in 2000 and to 9.8% in 2010. The rate decline is attributed to the State Children’s Health Insurance Program (CHIP) begun in 1997 (see Chapters 4 and 27). Despite the success of CHIP, eligible children have been missed. Approximately 28% of the 7.3 million uninsured children are eligible for CHIP (Georgetown University Health Policy Institute, 2009).
Impact of No Health Insurance on Health
The uninsured are more likely to be hospitalized for preventable conditions and to have no usual source of care (Hadley & Holahan, 2004; USDHHS, 2011). Because of delays in seeking health care, the uninsured are sicker when they seek treatment (Hadley, 2005; IOM, 2002a). For example, uninsured women delay regular screening for mammography (60%) and Pap smears (33%). Women with breast cancer who are uninsured have a 30% to 50% greater risk of dying than women with health insurance (IOM, 2007). The uninsured are less likely to receive early treatment for heart disease and diabetes. Even when diagnosed with heart disease or diabetes, they are less likely to use appropriate medications and follow-up services. Delayed care is expensive care. The estimated cost of uncompensated care provided to the uninsured by hospitals and other service providers is between $42.7 and $61 billion per year (Clemens-Cope et al., 2010; Families USA, 2009). The Institute of Medicine (IOM) (2003) estimated the actual economic costs of not having health insurance to be between $65 and $130 billion per year in health care costs, lost wages, and increased spending burdens on other public welfare programs. Many argue that money would be better spent in providing some kind of insurance coverage for the uninsured. That strategy would improve the health status of a vulnerable group and have an added benefit in reducing costs associated with delayed care.
Homelessness
Homeless people include persons from all walks of life: very poor men, women, and children, unskilled workers, farmers, housewives, social workers, health care professionals, and scientists. Some become homeless because of poverty or a failure of their family support systems. Others become homeless through loss of employment, abandonment, domestic violence, alcoholism, mental illness, social deviance, mental retardation, physical illness, or disability. Whatever the cause, the homeless are more vulnerable to health problems and reduced access to health care services.
Definition of Homelessness
Homelessness describes the existence of a person who has no fixed nighttime residence or who has a nighttime residence that is designed to provide temporary shelter or is a public or private place not intended to provide sleeping accommodations for human beings. This definition encompasses those persons who are literally homeless but does not include those who are living with relatives or in substandard housing. Homeless families who have had to move in with relatives or friends and rural homeless persons are not nearly as visible and are more likely to be omitted from federal programs designed to address issues relating to homelessness.
Number of Homeless
There are approximately 1.6 million people who are homeless in a given year (U.S. Department of Housing and Urban Development [HUD], 2011). Homelessness is not a permanent situation for most people. A national study reported that as many as 13.5 million adults have been homeless at some time in their lives (HUD, 2007). The growing shortage of affordable housing, declines in public assistance, and increase in poverty are largely responsible for increases in homelessness (National Coalition for the Homeless [NCH], July 2009a).
Characteristics of the Homeless
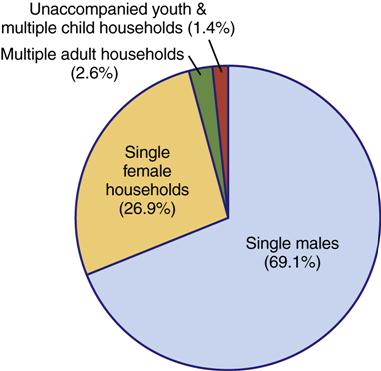
Homelessness is both an urban and a rural problem, but rural homelessness is harder to document. In rural areas, white, single or married women and their children are the largest groups of homeless persons (Fisher, 2005; NCH, 2009b). In urban areas, single men and single females with children are the two largest groups of homeless persons (Figure 21-6). It is always difficult to categorize homeless people, because each person might have several characteristics that place them in more than one risk group. For example, a veteran with a history of substance abuse and mental illness could be included in at least three subgroups of the homeless.
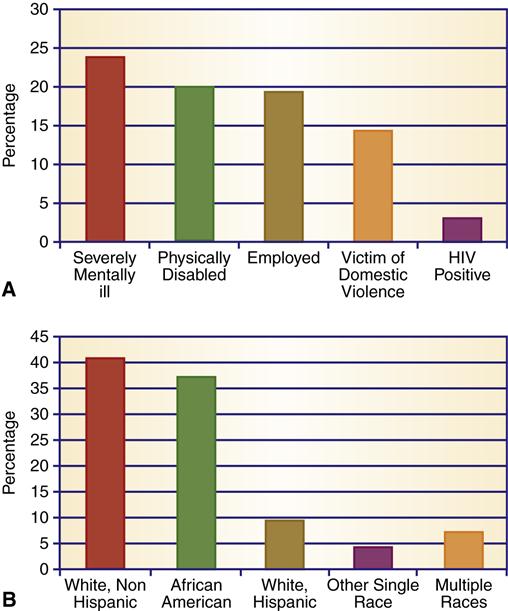
The racial and ethnic makeup of the homeless varies according to geographical location. Approximately 80% of urban homeless shelter users are white or African American (HUD, 2011) (Figure 21-7). Rural homeless people are more likely to be white, American Indian, or migrant workers (National American Indian Housing Council, 2007; NCH, 2009b). People in poverty, people with serious mental illness, and substance abusers are more likely to be homeless.
The Poor
Persons living at or below the poverty level are more vulnerable and more likely to become homeless than are those living above the poverty level. Between 7% and 9% of all poor people are homeless, but nearly all homeless people are poor. Any financial emergency, major illness, or job loss may result in homelessness.
Because African American, Hispanic, and American Indian populations are at greater risk for poverty, they are also at greater risk for homelessness. The National American Indian Housing Council (2007) reports that more than 90,000 American Indian families are homeless or in extremely poor living arrangements. The council states that there is an immediate need for 200,000 housing units. The council estimates that American Indians have a rate of substandard housing that is six times that of the general population. For example, approximately 60% of the houses on the Pine Ridge Indian reservation are infested with black mold (Pine Ridge Fact Sheet, 2009). Overcrowding is a major issue; some homes have as many as 25 people living in one dwelling. Many families live in cars, tents, or makeshift shelters.
Homeless Men
Single homeless men still make up the largest and most visible subgroup of the homeless population. Veterans comprise at least 10% of the homeless population (Homelessness Resource Center [HRC], 2010a). Homeless veterans have high rates of mental illness (45%) and substance abuse (70%); many confront both issues (HRC, 2010a). For some, homelessness becomes a long-term condition, with a few men reporting that they have been homeless for 30 to 50 years. Older homeless men are more likely to have been married at some time in their lives, whereas many younger homeless men have never been married.
Homeless Women
Homeless women are not as visible and are more difficult to count than men. Women with dependent children are the largest group of homeless women, followed by single women with substance abuse and/or domestic violence histories, and “bag ladies” (HUD, 2007;NCH, 2009a).
Bag ladies are alienated from the mainstream of society and use few resources. They are psychologically decompensated (emotionally and mentally separated from society) and socially decompensated (unable to interact with other people).
Homeless Families and Children
An increase in the number of homeless families has been reported in all areas of the United States. Families with children are the fastest growing group among the homeless population (NCH, 2009b). Families comprise the largest group of homeless in rural areas. Although some homeless families are two-parent units, most consist of one parent with an average of two or three young children.
Homeless mothers tend to be young, have less education, and have low employment rates. Domestic abuse has been cited as the primary cause of homelessness for mothers with children. The U.S. Conference of Mayors (2010) reports that half of the cities surveyed cited domestic violence as the primary cause of homelessness in that population. In San Diego, 50% of homeless women are victims of domestic violence (HRC, 2010b). Pregnant homeless women are especially vulnerable to multiple risk factors. They lack prenatal care, adequate nutrition, and basic necessities of life, which places both them and their unborn children at risk.
Homeless families tend to seek shelter, and women with small children receive priority for temporary housing. Two-parent families might “double up” with other families, live in tents in parks, or live in the family car. Once homeless, families have a difficult time finding a place to live because of the lack of available housing and the substantial down payments demanded for rental units. One or both parents might be employed on a full- or part-time basis, but their income is not sufficient to meet the minimal needs of their family members.
Data on homelessness indicate that 59% of the total homeless shelter population is youths under the age of 18. Most homeless children are preschoolers between infancy and 5 years of age (HRC, 2010b). Developmental testing of preschool children indicates that preschool homeless children exhibit significant developmental delay in all areas (NCH, 2006a). Many homeless children have attended preschool and school programs on a sporadic basis. They often have deficiencies in learning readiness, have reading and math delays, lack social interaction skills, and they experience long intervals between school attendance (National Center on Family Homelessness [NCOFH], 2009; U.S. Department of Education, 2006). Lost school time results in academic underachievement and gaps in learning and experience.
Homeless Teenagers
Approximately 1.6 million teenagers are homeless (Toro et al., 2007). HUD (2011) reports that unaccompanied minors comprise 1.1% of the urban sheltered population. Since most unaccompanied teens shun shelters, the actual number of homeless youth is difficult to quantify. Some are runaways, and others are “throwaways.” Runaway teens have significant psychological disturbances and a higher rate of drug abuse and contacts with the legal system than other youths. Studies of runaway youths reveal a high incidence of family violence and physical abuse. These homeless teenagers reported being victims of chronic, severe abuse, both physical and sexual, beginning at an early age (Paquette, 2010a). Throwaway children have parents who have severed all relationships with them; usually, rejection is preceded by months or years of failed relationships. Divorce, incestuous behaviors, or scapegoating might contribute to the desertion of the child.
Some homeless youths are separated from their families because shelter policies prohibit the admission of teenagers, especially older boys, in family shelters. Over 55% of cities report families had to break up to enter emergency shelters (U.S. Conference of Mayors [USCM], 2010). Some youth are homeless because they have been discharged from residential or institutional placements or have become too old for foster care (Paquette, 2010a).
Homeless youths adapt quickly to life on the street, where they are subject to criminal victimization, such as learning to solicit money and drugs through prostitution. They gravitate toward neighborhoods where they are tolerated, such as areas frequented by intravenous drug users and prostitutes. They engage in substance abuse and risky sexual practices (NCH, 2008).
Homeless youths, especially unaccompanied homeless youths, have more serious and complex health problems but are the most difficult population to reach. Their distrust and fear of persons in authority make it harder to provide health care and other services. They often have poor hygiene practices, receive inadequate nutrition, and are vulnerable to poor health, human immunodeficiency virus and acquired immunodeficiency syndrome (HIV/AIDS), other sexually transmitted diseases, substance abuse, and premature death (Rew, 2003; Woods et al., 2003). They are also at higher risk of mood disorders, suicide attempts, and conduct disorders (Paquette, 2010a).
Shelters and Food Assistance
Many religious organizations and advocacy groups have worked to help homeless people, but these efforts have not kept pace with the growing numbers and changing needs. In 2010 family homelessness rose 9% in urban areas in part fueled by home foreclosure rates. During 2011, most cities (77%) estimated the number of homeless would remain steady or increase (USCM, 2010). Despite a dramatic increase in shelter beds during the 1980s and 1990s, there are not enough shelters and transitional housing spaces for the homeless population (USCM, 2010). In almost all major cities, the estimated number of homeless people exceeds the available spaces. Twenty-seven percent of homeless families are turned away from shelters because there is no space. The majority of surveyed cities (62.5%) report that they have to issue vouchers for hotels because of a lack of shelter beds. Although rates of homelessness in rural areas are similar to rates in urban areas, there are few or no shelters in rural communities (NCH, 2009b).
In 2010, the requests for emergency food assistance increased by 24%. More than 43% of cities report that they have to turn away people due to lack of adequate food supplies (USCM, 2010). Cities report that the resources and budgets to meet those needs decreased at the same time that the need for food supplies increased. A majority of cities expect their budget for emergency food assistance to be reduced in the coming year, despite the increase in demand. Budget reductions and increased demand are tied to the current recession and state/city fiscal crisis (USCM, 2010).
Medical Problems Associated with Homelessness
Homelessness has a severe impact on a person’s health and well-being. Rates of acute and chronic health problems among the homeless are high (Box 21-1).
Stay updated, free articles. Join our Telegram channel

Full access? Get Clinical Tree


