Financing of Health Care
Context for Community/Public Health Nursing
Frances A. Maurer
Focus Questions
What sources provide funding for health care in the United States?
What has been the general pattern of expenditures for health care?
Are some groups at greater risk for diminished or no access to health care services?
How have Medicare and Medicaid affected health care delivery to the populations they serve?
What methods have been used to attempt cost containment in health care?
Has cost containment affected services? If so, in what ways?
How can nurses influence the costs and delivery of health care services?
Key Terms
Centers for Medicare and Medicaid Services (CMS)
Children’s Health Insurance Program (CHIP)
Consumer-directed high-deductible health plans (HDHPs)
Co-payments
Deductibles
Diagnosis-related group (DRG) system
Free market economy
Gross domestic product (GDP)
Health maintenance organizations (HMOs)
Medicaid
Medicare
Medicare Advantage
Medicare + Choice
Patient Protection and Affordable Care Act
Premium
Private insurance
Prospective payment
Retrospective payment
Risk groups
Self-insurance
Temporary Assistance for Needy Families (TANF)
Third-party payment
Uninsured
Universal coverage
Today’s nurses need to have a clear understanding of the finance mechanisms of the health care system in the United States. In the past, such topics were not considered relevant to the practice of nursing and were also considered irrelevant to the planning and distribution of good nursing care. The expectation was that people should be provided with the best and most appropriate nursing care and medical treatments regardless of their ability to pay.
Although universal access to care is admirable, it has never been a reality in this country. Only time will tell if the new Patient Protection and Affordable Care Act of 2010 (Affordable Care Act) can achieve the goal of universal health care. Debate rages about potential rationing of health care, but health care is already rationed by people’s ability to pay. A person’s financial status affects the quality and quantity of care she or he receives. Current events have served to highlight that problem to health care providers, the public at large, and individual consumers. The new Affordable Care Act attempts to address many of the issues presented in this chapter. Where it is relevant, that information will be presented in ITALICS to highlight present, ongoing or expected changes.
Relevance of health care financing to community/public health nursing practice
Why is the financing of health care services important to the community health nurse? Why not just continue providing appropriate care to a caseload or community and leave others to worry about financial costs and how to meet them? For one thing, nurses will find that nursing practice, to some extent, is shaped by those financial constructs. If a community health nurse is providing home visits to a client newly diagnosed with diabetes, the number of home visits allowed is limited by the government agency or private insurance company that finances the visits. A nurse assigned to provide skilled nursing care in the home to an individual (e.g., dressing changes) might find that the person requires other services such as nutritional health teaching or medication monitoring. These services might not be covered by the payer, especially if they are not related to the specific medical condition for which the visits are made. If, while on a home visit, a community health nurse discovers that other household members need or would benefit from nursing care, these members might not be covered by the insurance company, or, if they are covered, treatment of the problem identified might not be considered a reimbursable service by the payer.
Why should community health nurses care whether the needed services are paid for? Why not just provide the service while in the home? Although occasionally this solution is possible, more often, time constraints will not allow the nurse to do this. The nurse’s employing agency is reimbursed only for specific services provided to patients. Therefore, the agency will set a nurse’s patient load for the day on the basis of a reasonable time to perform those designated services. Nurses who routinely provide additional services to patients or care for other household members might fall behind in the agency’s caseload expectation. Nurses may not be covered in case of a malpractice claim because the additional service was not first sanctioned by the agency. Therefore, the community health nurse faces a dilemma: how to reconcile the ideals of good nursing care with the realities dictated by circumstances, the nurse’s employer, and the financial reimbursement system.
Relative magnitude of health spending in the united states
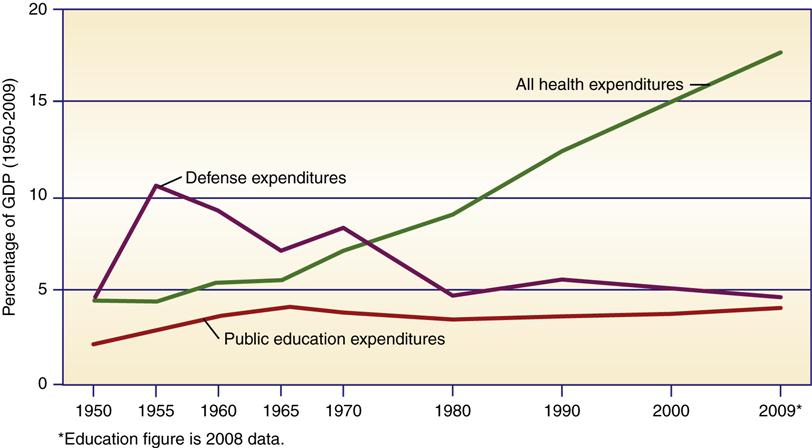
Since 1965, national expenditures on health care have risen steadily and are a serious concern. Yearly costs have risen from $12.7 billion in 1950 to $2.48 trillion in 2009 (Figure 4-1). Of even greater concern than escalating costs is the increase in health care expenditure as a portion of the national budget. The share of health care costs in the gross domestic product (GDP) continues to increase in comparison with other expenditures. The GDP is a monetary measure of the production of a country. Health care currently outstrips the combined costs of both defense and education (Figure 4-2).
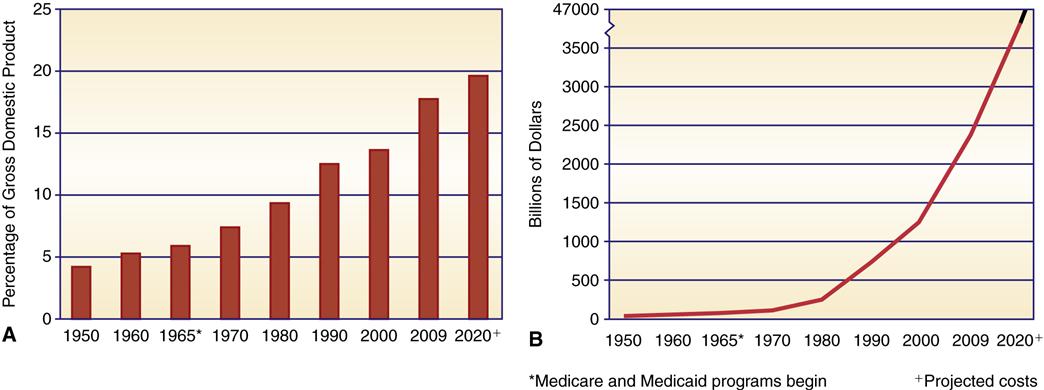
The increase in the proportion of the GDP (17.6%) devoted to health care means that individuals and families spend more on health care and have less to spend on food, clothing, housing, education, leisure, and other needs or interests. The personal cost of health care—what each American spends on health care services and products such as insurance premiums, medications, and physician and hospital services—has doubled every decade. The average yearly cost for every American was $8086 in 2009 (Centers for Medicare and Medicaid Services [CMS], 2011e). By the year 2020, it is estimated that health care costs will average $13,708.80 per year for each person in the country (CMS, 2011g).
Private- and Public-Sector Shares of Health Expenses
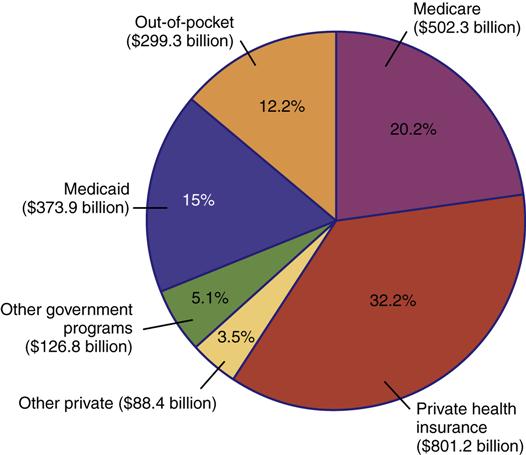
Governments at all levels provided 48.6% of the total health care costs in 2009 (Figure 4-3). Two large programs, Medicare and Medicaid, account for 35.2% of the country’s entire health expenses (U.S. Census Bureau, 2012g). In 1965, before Medicare and Medicaid, the federal share of health care expenses was roughly equal to the combined state and local contributions. By 1970, the federal share had doubled. Since the change to block grants, the federal share has been reduced and in 2009, the federal government paid approximately 62.6% of public-sector costs, while state and local governments paid 37.4% (U.S. Census Bureau, 2012h).
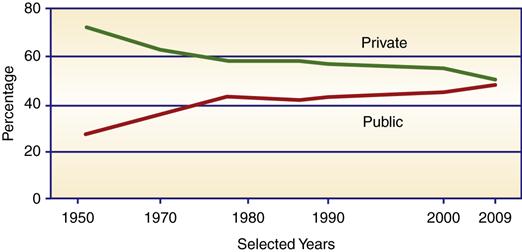
In 1965, the private sector accounted for 74% of all health care expenses. By 1975, after Medicare and Medicaid were well established, the private-sector share dropped to 57.5%. Today, the private-sector share of expenditure is 51.4%. The pattern of health expenditure is a reflection of age and social risk factors. Health care services provided to risk groups cost more than care provided to more healthy individuals. Risk groups are groups with a likelihood of accidents or illness because of low income or inability to easily access health care services. As social health programs make access and care available to these risk groups (e.g., older adults and the economically disadvantaged), these expenses escalate.
Priorities in Health Care Expenditures
By far, the largest amount of money is spent on personal health care and very little on public health. In Figure 4-4, expenditures for 2009 are broken down by type and source of funding. Personal health care services accounted for all but 16% of the entire health budget (U.S. Census Bureau, 2012g). Hospital care is the most costly category, and physicians’ and clinical services are the second highest cost area.
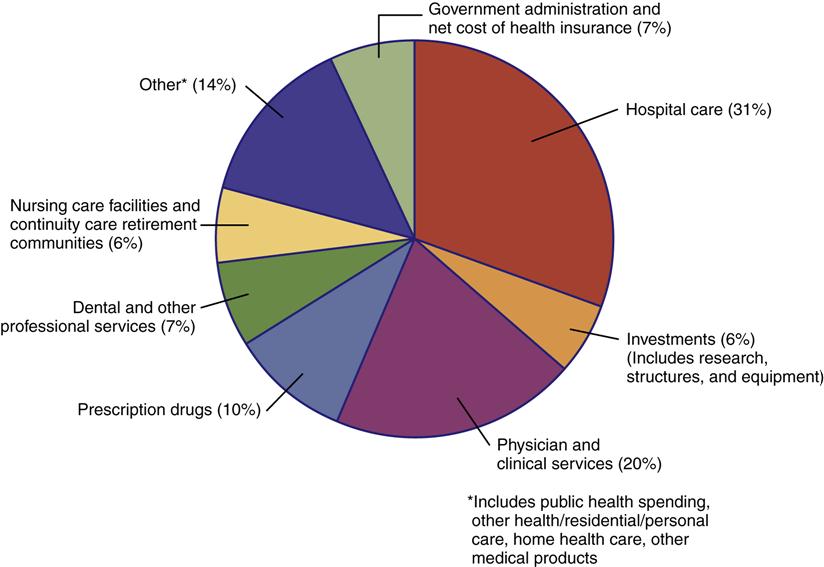
Public health, research, and construction together account for a mere 9% of the entire budget. Public health activities are subsidized wholly by the public sector. State and local governments bear the major costs of providing these services. Public health’s share of funding has remained relatively stable since the early 1970s. Government, especially the federal government, bears the major responsibility for research. Most of these funds are used or distributed by the National Institutes of Health. The private-sector invests much of the construction funds for building projects.
Cost Increases Affect the Entire Economy: You and Me
Health care expenditures are particularly significant in the economy because they are very extensive. As health care expands its share of the country’s GDP, other industries lose ground. For example, for every 1% increase in GDP of health care, there is a corresponding 1% loss in revenues to other industries. Eventually, everyone is affected by increases in health care costs. Government agencies must pay for increases in services that they are pledged to provide. Government expenses are ultimately the responsibility of the taxpayer. As federal and state health care costs have escalated, the increased expense has been passed on to individual taxpayers via income tax and other taxes. Insurance companies pass on increases in expenses to employers. Employers, in turn, usually pass on the extra costs to their employees by increasing the employees’ share of health insurance contributions. Those without health insurance pay out of pocket, which refers to personal and direct payment for health care. No one escapes the consequences of increases in the cost of health care services.
Reasons for the increase in health care costs
There are three basic factors responsible for the escalating costs of health care. The first is inflation. As a generic factor, inflation affects the costs of all types of goods and services and has played a significant role in cost increases. Between 1950 and 1990, there were several periods of heavy inflation. The net effect was a dramatic increase in the cost of basic goods and services such as food, fuel, electricity, telephone, construction, labor, and insurance. As inflation increases prices, the health care industry’s costs for these goods and services are also increased, and these higher expenses are passed on to the consumer. Inflation helps explain increases in the overall monetary expenditure for health care but does little to explain health care expenditure increases in the share of the GDP. These are more closely related to other factors:
• Growth in the number of older adults in the population
• Growth of specialties in medical care
• Reimbursement mechanisms and administrative costs
Increased demand for services is primarily the result of federal programs (Medicare and Medicaid) and an aging population. Before these programs were instituted, cost was a rationing factor for the poor and older adults who were in need of health care. Medicare and Medicaid reduced the access barrier and created a greater demand for health care among groups for which it was previously restricted. At the same time, the growth of the older adult population created an additional demand for services. Even without Medicare, the number of older adults requiring health care services has grown, and, as more and more baby boomers reach old age, the need for health care services is expected to increase even more. By the year 2030, older adults are expected to represent 20% of this country’s population. In comparison, in 2010, 13% of the population, or 40.3 million persons, were 65 years of age or older (U.S. Census Bureau, 2012j).
Technological advances in medicine have been enormous and expensive. Development costs of new procedures, drugs, and equipment are high, and new technologies generally require more skilled technicians and professional operators. Advances in medical treatment have also created an increased demand for services because refinements frequently increase the number of patients who can be successfully treated. Sultz and Young (2011) substantiated the impact of new technology on rising health care costs. They suggested that better planning could reduce some of these costs and rescue utilization. More stringent research is needed to determine whether higher-cost technologies are more beneficial and cost effective. Ginsburg (2011) contends that technology’s impact on cost is a mixed bag. Some procedures cost more, whereas others reduce costs over time. For example, computed tomography (CT) scans cost more compared with radiographs, but they have reduced the need for exploratory surgery.
Groups at risk for increased costs and fewer services
To further complicate matters, as health care costs have escalated, government and private industries have made efforts to contain expenditures. These efforts have resulted in actions that have either limited access to health care or have reduced available services to certain segments of the population. Three specific groups have been particularly hard hit by escalating costs and reductions in services: Older adults, children from low-income groups, and a growing population of medically indigent individuals. The medically indigent are those who do not have health insurance coverage, do not qualify for government health care assistance, and are unable to pay health care costs on their own.
In 2010, 46% of the aged were 75 years or older (U.S. Census Bureau, 2012j). Older adults, especially those who are frail, are at increased risk for disability, chronic disease, and need for expanded health care services. As discussed later in this chapter, the services they receive under Medicare are limited and require co-payments.
Children in low-income families are another risk group. The percentage of children below the poverty level rose from 17.9% in 1980 to a high of 22% by 1993 (Lewit et al., 1997; U.S. Census Bureau, 2002). During that same time, the social service and health care assistance programs designed to assist them were, in many instances, cut back. By 1993, a growing economy increased employment opportunities, and the state Children’s Health Insurance Program (CHIP) contributed to increased access to health insurance and a decline in the number of children from low-income families. Currently, one of every five children (14.8 million) in the United States lives in poverty and one of every 10 children is uninsured (DeNavas-Walt, Proctor, & Smith, 2011; U.S. Census Bureau, 2012a, 2012b).
In 2010, approximately 50.4 million persons were medically indigent (DeNavas-Walt, Proctor, & Smith, 2011). Those in this group are uninsured, with no health insurance, including government-sponsored medical insurance. They are the “working poor.” Their income makes them ineligible for government assistance but is not sufficient for them to purchase their own health care services or insurance.
The uninsured and underinsured contribute to escalating health care costs because those individuals delay seeking care in a timely manner for acute and chronic conditions and forgo or delay preventive care. The result of these behaviors is increased severity of illnesses, more complications of illnesses, and greater use of emergency rooms (Institute of Medicine [IOM], 2007; U.S. Department of Health and Human Services [USDHHS], 2011), actions that increase the eventual cost of treatment. Chapter 21 provides a more detailed discussion of the impact of poverty and lack of health insurance on the health status of individuals.
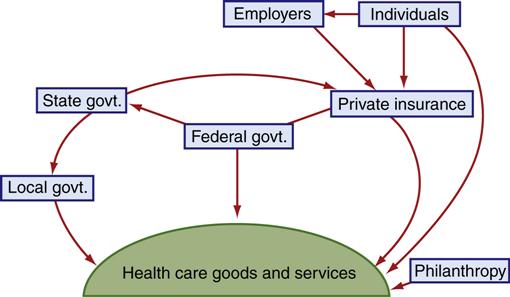
Health care financing mechanisms
Currently, health care financing in the United States is very complex. Services are paid for by a variety of sources and methods rather than by a single funding source (Figure 4-5). Health insurance is a voluntary arrangement developed and managed by commercial insurance companies, Blue Cross and Blue Shield, and managed care organizations. Employers provide insurance for many of their workers. Health care for the poor is provided for by local, state, and federal funding, primarily through Medicaid. State and local health departments provide some direct services, most of them concentrated in the area of preventive health services (well-baby clinics, family planning, immunizations). Senior citizens are usually covered under the Medicare program, and some might also have additional insurance to supplement Medicare coverage. The federal government provides directly funded care to a variety of groups, including military personnel and their families, armed services veterans, and American Indians. Individuals might also pay for health care services directly.
Insurance and government-funded programs are examples of third-party payment, in which a third party (i.e., someone other than the recipient of care) directly pays for all or part of the health care services provided. The third party might be a private insurance company or government. Frequently, the client has no idea of the exact costs of the services provided and sometimes never sees the bills.
Self-Payment
Self-payment, or self-insurance, is a method by which a person or a family essentially assumes the financial cost of all medical services. This was the most common method of purchasing services before the 1930s. Currently, however, it is the least common method of payment, primarily because individuals are extremely wary of the financial burden posed by chronic or catastrophic illnesses. Today, self-payment costs are usually co-payments (a consumer share of the cost for a particular service) and deductibles (the amount a consumer must pay up front before insurance assumes any cost for services). Additional out-of-pocket costs are for services not provided by insurance plans. Private out-of-pocket costs make up 12% of the total expenditures for health care (Figure 4-6). The percentage of self-payment expenditures have doubled since 1996 as managed care and other insurance providers increase the co-payments and deductibles required by their policies.
Health Insurance
Health insurance gradually replaced self-payment. Since 1970, it has been the most common means of paying medical costs. Private health insurance premiums and health insurance payments for health services accounted for $801.2 billion in 2009, or 32.2% of the total health care budget for that year (CMS, 2011f).
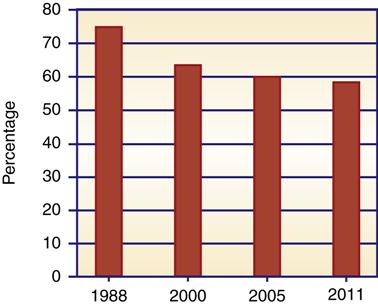
Employer-Provided Health Insurance
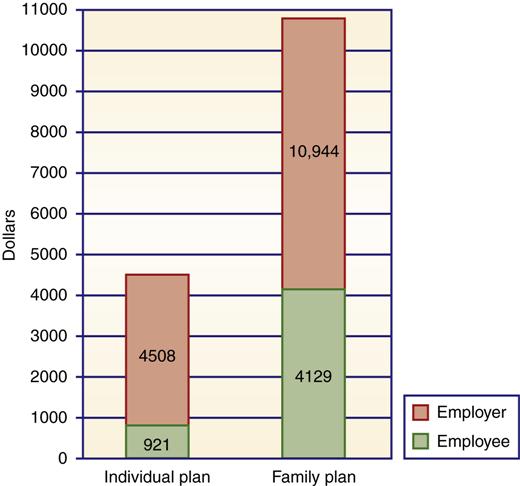
The most common form of health insurance is employer-provided insurance, in which employees and their families are covered through employers (Table 4-1). Usually, the employer pays some or all of the cost of insurance for workers. Employer-provided health insurance is an expected (but not universal) benefit for employees. This type of coverage appears to be eroding (Figure 4-7). By 2011, more than 41% of workers were not covered (Kaiser/Health Research and Education Trust [HRET], 2011). Employees of small companies are less likely to have employer-sponsored health insurance. Only 48% of firms with nine or fewer employees offer health insurance plans, whereas almost all companies with 100 or more employees do so (Kaiser/HRET, 2011).
Table 4-1
Types of Insurance Coverage for Individuals
| Enrolled (n) | ||
| Type | Millions | % |
| Employment-based | 169.2 | 55.3 |
| Medicare | 44.3 | 14.5 |
| Medicaid | 48.6 | 15.9 |
| Military* | 12.8 | 4.2 |
| Individual | 30.1 | 9.8 |
| Uninsured | 49.9 | 16.3 |
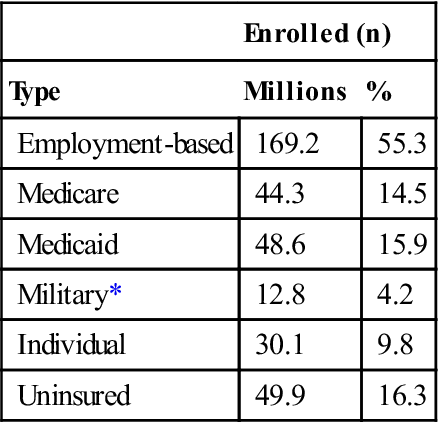
*Includes TRICARE and CHAMPVA.
Data from U.S. Bureau of the Census. (2010). Income, poverty, and health insurance coverage in the United States: 2010. Current Population Reports P60-239. Washington, DC: U.S. Department of Commerce, Economics and Statistics Administration.
Employers’ costs of insurance have risen over the years as premium costs have increased. Employers paid on average $1767 in premiums for a single employee in 1981 and $5429 in 2011 (Kaiser/HRET, 2011). Premiums increased 43% between 2007 and 2011. Rising costs have forced employers to reexamine the cost of offering health insurance benefits. Hefty insurance costs are directly related to decreases in the number of employer-offered plans during the same period.
Cost-containment strategies are becoming routine in employer-provided group health insurance plans as employers costs continue to escalate. General Motors (GM), for example, had $5.3 billion in health care costs in 2005 (Pennsylvania Department of Health, 2008). The Centers for Medicare and Medicaid Services (CMS), the federal agency in charge of the two programs in its name, reports that employer cost-containment strategies include reimbursement for generic-only prescriptions; increasing reliance on second opinions for surgery; provisions for preadmission testing to eliminate the greater costs incurred for these hospitalization services; and increased reliance on outpatient surgery. Health maintenance organizations (HMOs), the most tightly controlled health insurance and service providers, and other managed care plans (preferred provider organizations [PPOs], and point-of-service plans) are offered to employees as an alternative or exclusive health plan. By 2011, almost 97% of employees in employer-sponsored plans were in managed care (Kaiser/HRET, 2011).
Recently, employers have started to offer consumer-directed high-deductible health plans (HDHPs) as a means to control their health insurance costs. These plans are called consumer directed plans because the health care consumer decides how to use the money in the account. There are two types of HDHPs. One type is an HDHP with a health reimbursement option in which employees pay a high initial deductible and the employee is reimbursed for portions of the health care costs in excess of the deductible by a health insurance plan usually provided by the employer. The second type of HDHP plan is a health savings account. In this plan, an employer usually pays a certain amount into a health account, and the employee has the option of adding more. The employee usually picks the insurance plan or opts just to pay for health care costs from the health savings account.
In HDHPs, the employee’s deductible costs range from $1100 to $5800 per single employee and as much as $2300 to $11,600 for family coverage (Nathan, 2009). HDHPs are best suited for young healthy individuals and their families. Many employees, however, do not have an option because that may be the sole plan offered by the employer. HDHPs accounted for 23% of employer offered health plans in 2011 and their popularity with employers is growing (Kaiser/HRET, 2011).
Employers have also become more involved in their benefits programs, increasing self-funding of health benefits, using noninsurance program administrators to monitor costs, and requiring employees to shoulder more of the cost of health insurance. Some employers have eliminated family coverage or have made the employee premiums so high that lower-wage employees cannot afford family coverage. On average, employees are required to pay 18% of the premium cost for individuals and 28% of the premium cost for a family plan (Figure 4-8). The employee share of health premiums and cost sharing (deductibles and per-episode costs) has increased as employers have reduced their contributions to health plans. This action by employers places additional families at risk for poor access to health care. The average annual premium for an employee with family coverage is $4129; deductibles average another $1521 for PPOs and $627 for hospital costs (Kaiser/HRET, 2011).
The current political debate centers on whether health insurance coverage should be mandated for all firms with employees. Most small business leaders are opposed to employer-mandated health insurance, claiming the net effect would be a loss of jobs, increasing costs to consumers, and some business failures. Proponents argue that it is sound business practice to provide coverage because it will attract a more stable workforce. There have been some moves in the direction of employer-mandated health insurance for workers, and several states have passed legislation requiring such benefits (Davis & Schoen, 2003; Krisberg, 2007). Massachusetts, for example, has enacted expanded coverage for all citizens. Employers have the option of providing health insurance or paying into a state insurance pool (Lee, 2007). Pennsylvania, California, Oregon, and Vermont have enacted similar plans (Health Care Financing and Organization, 2007; Krisberg, 2007). The new Affordable Care Act will require employers to provide health insurance to employees or pay a fee to help finance subsidies for those without access to affordable care. These fees will then be used to offset the cost of coverage for persons who must purchase their health insurance privately through the state medical health insurance exchanges (Kaiser Family Foundation [KFF], 2009).
Other Health Insurance Options
There are several non–employer-related methods of purchasing health insurance. Medicare is a government insurance program designed primarily for use by older Americans. Medicare will be addressed later in this chapter. In addition, individuals can purchase health insurance on their own.
Privately Purchased Health Insurance
Approximately 9.8 million individuals have private insurance and purchase their own health insurance (DeNavas-Walt et al., 2011). Private purchase individuals do not have access to a sponsored insurance program. They are more likely to purchase private health insurance if their income is adequate and they are regularly employed.
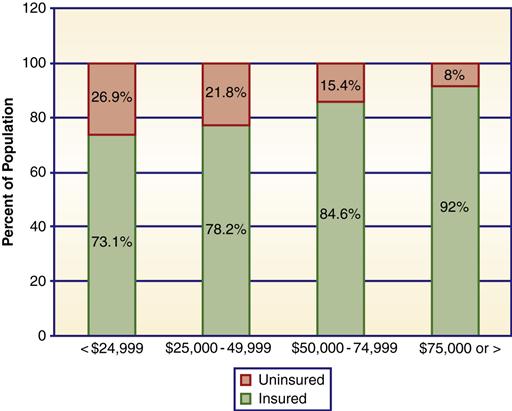
Most uninsured families have low incomes (Figure 4-9). For these families, cost is a deterrent to seeking health care. Unlike with employer-provided health insurance, the premium cost (the price charged by the insurance carrier) is paid totally by the individual. Where not regulated by state laws, premiums for an individual cost $5000 or more (Congressional Budget Office [CBO], 2008). Family coverage costs even more. For individuals from low-income and marginally middle-income groups, these premium costs are unaffordable. For example, Collins and colleagues (2008) reported that 43% of people whose income was 200% or less of poverty level found it very difficult to find affordable health insurance.
Compared with group insurers, private health insurers can more easily discriminate on the basis of the characteristics of an individual. Insurers charge higher premiums for persons living in urban environments, smokers, older persons, and females (compared with males in the same age group) and for those with preexisting conditions. Unless state laws prohibit it, insurers can deny insurance coverage to individual applicants. Denial rates average approximately 33% of applicants in states with no guaranteed coverage guidelines. In response to insurance selection practices, and in an effort to make privately purchased health coverage feasible for more individuals, approximately half of the states have attempted reforms. These efforts include the following:
• High-risk insurance pools for otherwise uninsurable individuals
• Establishment of an insurer of last resort, usually Blue Cross or Blue Shield
• Guaranteed issuance of insurance to all who apply
• Guaranteed renewal of insurance to all
• Limits on deniability due to preexisting conditions
All states now operate high-risk pools for persons who must self-insure due to the Pre-Existing Insurance Plan created by the Affordable Care Act (Anderson, 2011). Risk pools are temporary through 2014 when consumers will have access to health coverage through insurance exchanges. The Affordable Care Act lowers premiums by 40% in 18 states where the high risk pool is administered by the federal government. It bans insurers from discriminating against persons with preexisting medical conditions. Some states had risk pools and mandated premium restrictions prior to the Affordable Care Act. In the past, if an insurance carrier decided a state’s requirements caused too great an expense, it could choose not to operate in that state. In addition, a portion of the bill which takes effect in 2014 will prohibit higher insurance rates for preexisting conditions.
Insurance Portability
The Health Insurance Portability and Accountability Act (HIPAA) passed by the federal government in 1996 has made limited efforts to improve access to health insurance for individuals. The law guarantees access to private insurance for individuals who have just left a qualified group insurance plan, requires the renewal of insurance coverage, and authorizes federally tax exempt medical savings accounts that can be used to pay health insurance premiums for self-employed individuals. These federal reforms did not address affordability of premiums or allow medical savings accounts or tax-exempt premiums for other groups such as the unemployed or the employed with no employer health insurance plan.
Rutgers (2011) reported that the health portability act has reduced insurance providers’ use of preexisting conditions to deny coverage. The act does not limit the amount an insurer can charge. Substantial premium costs have undercut the intent of the portability act. Many individuals simply cannot afford to purchase coverage (Patel & Rushefsky, 2006).
Health Care Assistance
Health care is funded in a number of ways for people who cannot afford to pay for services and do not have health insurance. Health care assistance is another third-party payment mechanism in which payment is provided by a government program (either federal or state) or private charity. The most familiar program of this type is Medicaid, which provides service to approximately 47.4 million persons at a cost of $373.9 billion, or 15% of the entire health care budget (CMS, 2011f; U.S. Census Bureau, 2012d). Details of this program are discussed later in the chapter. Both state and local health departments provide a variety of health services. Most of these services are aimed at poor populations, and most are prevention oriented, although some direct services to ill persons might be available. Funds to support these services are a mix of federal, state, and local monies (see Chapter 29).
Private charity provides a variety of services to the needy. Nonprofit organizations usually target special health care needs or special risk groups. Philanthropic gifts to hospitals assist with payments for persons without insurance, and many health care providers offer some free care. Spontaneous fundraisers meet expensive special needs such as liver or heart transplantation for certain individuals. It is difficult to quantify the actual dollars provided by charitable organizations and events for direct health care services to individuals. Philanthropic activities accounted for 0.8% of the total health budget in 2010, or approximately $19.8 billion (Giving USA, 2011). That amount includes both direct care to individuals and contributions to research and facilities development. It is safe to say that charitable contributions make up a minuscule portion of the health care budget.
Lack of Health Insurance
More than 50.4 million persons are not covered by health insurance or assistance of any kind and are unable to pay for health care services on their own (DeNavas-Walt et al., 2011). Others are without health insurance at some time or other during a calendar year. Most of the uninsured are “the working poor”—workers attempting to provide a living for themselves and their dependents at low-paying jobs with few benefits. They and their dependents make up an estimated 80% of the medically indigent (Hoffman, 2012). In 2010, 28 million workers were uninsured, most of whom (78%) were full-time workers (DeNavas-Walt et al., 2011). The remainder of the uninsured are individuals who are currently unemployed or uninsurable and others who fall outside the eligibility requirements for Medicare or Medicaid (e.g., some of the homeless, some older adults, and children).
Many of the uninsured work in a service industry such as food or janitorial service. Those jobs require few skills and little education, offer fewer benefits, and are generally low paying. Service-type jobs are increasing, which places more workers at risk. By 2010, there were 19.2 million service jobs (U.S. Census Bureau, 2012i). Most of those employed in service positions receive no health insurance benefits. When the uninsured need health care, they are limited in their options. They must pay at the time of service or find a health care provider who is willing to defer payment. Many delay seeking care, hoping their health conditions will improve on their own.
Underinsurance and Associated Financial Risk
In addition to those with no medical insurance, there are millions who are underinsured. These individuals have insurance plans that require large out-of-pocket expenses or limit coverage of catastrophic illnesses. Workers who change jobs and cannot afford insurance under the portability act are at risk. Medicare enrollees are at risk because Medicare pays for less than 50% of their total health care costs. The number of underinsured is difficult to measure. Estimates vary. Some estimates indicate that 26% to 34% are underinsured. Those who are underinsured risk less access to health care and poorer health because of their insurance status (Patel & Rushefsky, 2006; IOM, 2007). Hoffman (2012) reported that the underinsured are at financial risk in a crisis and that over half the bankruptcies in this country are associated with medical bills or debts or health problems.
Level of Health Related to Medical Insurance
The medically indigent (uninsured) have greater health risks (Geyman, 2008; Hoffman, 2012; Inglehart, 2002). These families have a harder time acquiring the basic necessities of food, clothing, shelter, and transportation, and their medical needs force them to make hard choices about exactly what services they can afford. Studies show that the uninsured include a larger number of people in fair-to-poor health, with a greater incidence of chronic illness and early death (IOM, 2007). They are less likely to seek care early, make fewer visits to physicians, and are less likely to be hospitalized than are insured individuals (Patel & Rushefsky, 2006; Hoffman, 2012). Because they delay care, their health problems are usually more severe when they do seek care (Sultz & Young, 2011). The uninsured overuse hospital emergency departments because they have no personal health care provider (Kaiser Commission on Medicaid and the Uninsured (KCM&U), 2009). The cost of such care is assumed either by the hospital or by government programs. Emergency department care is a more costly form of service than care at clinics or physicians’ offices. The American Hospital Association (AHA) reported that the cost of uncompensated care in hospitals has doubled every 5 years. The estimated costs of uncompensated care (for hospitals and other providers) is between $42.7 and $61 billion dollars (Clemans-Cope, Garrett, & Buettgers, 2010; Families USA, 2009).
Uninsured Children: A Special Concern (CHIP Program)
Although there are fewer uninsured children than uninsured adults in most states, they are an aggregate of special concern to health professionals. The cost of providing access and treatment to children is low, and the long-term benefits to health care costs are high. Untreated illnesses and lack of preventive services create or exacerbate health problems that persist throughout life. Treatment of the chronic conditions that result is far more costly than the services that could have prevented such problems.
The number of uninsured children has declined since the Children’s Health Insurance Program (CHIP) was established in 1997. The CHIP expands health insurance coverage to uninsured children from low-income groups, who are not already covered by other types of assistance programs such as Medicaid. It is funded by federal grants to participating states, which design and administer the program. In 2009, the cost of the program was 11.1 billion dollars (CMS, 2011f). Before 1997, approximately 25% of children were not covered by any insurance program, including Medicaid. Since the inception of the CHIP, the percentage of children without health benefits has declined to 9.8% (DeNavas-Walt et al., 2011).
Problems with the CHIP program has included the variability in income standards for eligible families and also variability in available health care services in the various states. The Affordable Care Act will set standard criteria for services and eligibility as discussed in the Medicaid section later in this chapter. For additional information on the CHIP, see Chapters 21 and 27.
Publicly funded programs for health care services
Medicare and Medicaid are the two programs that provide a major portion of health care services to populations that have been identified as having greater need (older adults) or having fewer resources (poor families) than the majority. Specific costs and benefits change periodically. Rather than concentrating on current benefits, this discussion focuses on exploring each program’s basic purpose, evolution, and beneficiaries. A brief comparison of covered and excluded services for each program is given, and examples and costs are used to illustrate points under discussion. This information is important to community health nurses because many of their clients are covered by these programs. Nurses need to know what services clients can expect if they are enrolled in these programs.
Medicare
Medicare was created in 1965. It was an attempt to ensure that adequate medical care would be available to older adults and some persons with chronic illnesses and that the price of such services would not be so prohibitive that individuals would have to forgo basic care. It has significantly improved access to health care services for eligible persons, and it has helped reduce the level of poverty among older adults.
Medicare is federally funded and is financed by a tax on wages. Every citizen who is currently working provides a portion of her or his salary to the Medicare program. Employers and employees contribute an equal percentage of wages to fund Medicare. The contribution levels for both employer and employee have risen, so that both pay 1.45% of the worker’s salary into the Medicare Insurance Fund. Medicare’s budget increased from $4.7 billion in 1967 to $519 billion in 2010 (KFF, 2010b).
Medicare has evolved into an important source of income for health care providers. It furnishes more than 29% of total income to hospitals and 21.6% of all income to physicians (CMS, 2011f). Physicians in certain medical specialties commonly exceed the 21% average Medicare income level. These include thoracic surgeons, internists, and radiologists.
Beneficiaries
The primary beneficiaries of Medicare are older adults who contributed to the system during their working life or the spouses of the contributors. In 1972, Congress extended coverage to persons under age 65 years with long-term disabilities or end-stage renal disease. In 2010, there were 47.5 million persons receiving Medicare benefits, 39.6 million of whom were seniors and 7.9 million of whom were persons with disabilities (U.S. Census Bureau, 2012f).
Benefits
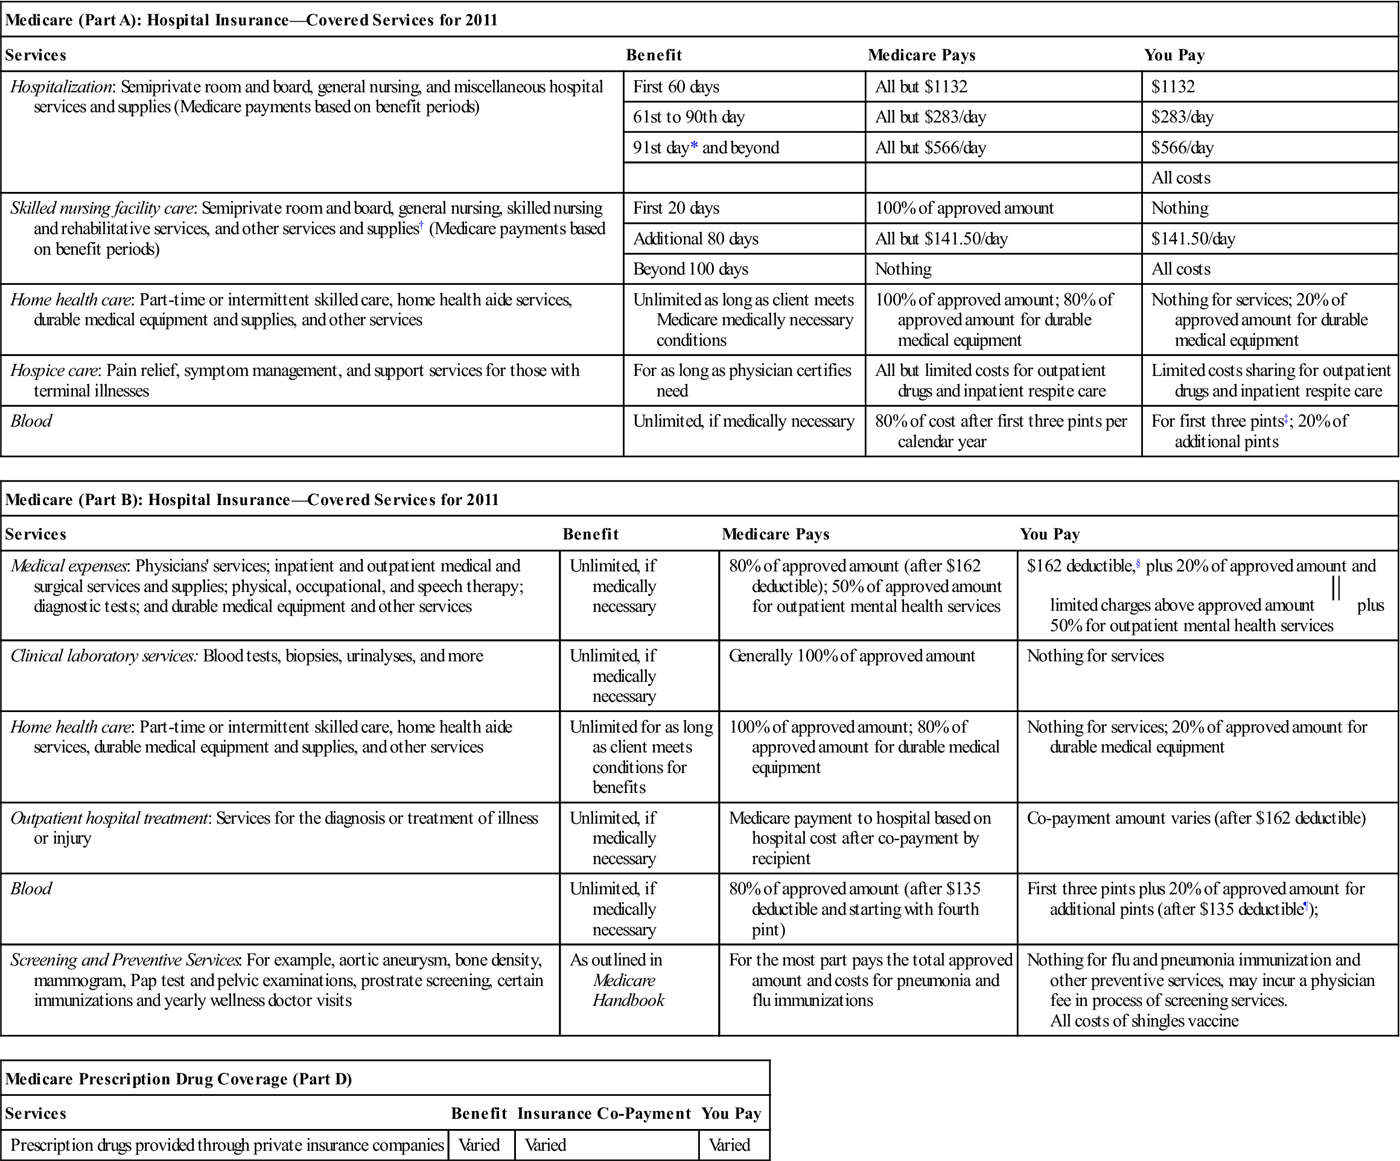
Medicare is divided into four parts: Part A is hospital insurance, Part B is supplementary medical insurance, and part D covers prescription drugs. All contributors are covered by Part A. Part B and Part D are voluntary and are limited to those who choose to participate and pay a premium deducted from their Social Security checks. Part C is Medicare managed care, called Medicare Advantage. There are currently 11 million persons (23% of Medicare enrollees) enrolled in Medicare Part C. Most Medicare recipients who use Part A opt to participate in Part B coverage. Part D, which began in 2003, has a 60% participation rate (KFF, 2010b). The cost of premiums has steadily increased, and voluntary contributions currently pay for only 25% of the total cost of Part B benefits; the rest is financed by the federal government. Benefits under Part A, Part B, and Part D are listed in Table 4-2.
Table 4-2
| Medicare (Part A): Hospital Insurance—Covered Services for 2011 | |||
| Services | Benefit | Medicare Pays | You Pay |
| Hospitalization: Semiprivate room and board, general nursing, and miscellaneous hospital services and supplies (Medicare payments based on benefit periods) | First 60 days | All but $1132 | $1132 |
| 61st to 90th day | All but $283/day | $283/day | |
| 91st day* and beyond | All but $566/day | $566/day | |
| All costs | |||
| Skilled nursing facility care: Semiprivate room and board, general nursing, skilled nursing and rehabilitative services, and other services and supplies† (Medicare payments based on benefit periods) | First 20 days | 100% of approved amount | Nothing |
| Additional 80 days | All but $141.50/day | $141.50/day | |
| Beyond 100 days | Nothing | All costs | |
| Home health care: Part-time or intermittent skilled care, home health aide services, durable medical equipment and supplies, and other services | Unlimited as long as client meets Medicare medically necessary conditions | 100% of approved amount; 80% of approved amount for durable medical equipment | Nothing for services; 20% of approved amount for durable medical equipment |
| Hospice care: Pain relief, symptom management, and support services for those with terminal illnesses | For as long as physician certifies need | All but limited costs for outpatient drugs and inpatient respite care | Limited costs sharing for outpatient drugs and inpatient respite care |
| Blood | Unlimited, if medically necessary | 80% of cost after first three pints per calendar year | For first three pints‡; 20% of additional pints |
| Medicare (Part B): Hospital Insurance—Covered Services for 2011 | |||
| Services | Benefit | Medicare Pays | You Pay |
| Medical expenses: Physicians’ services; inpatient and outpatient medical and surgical services and supplies; physical, occupational, and speech therapy; diagnostic tests; and durable medical equipment and other services | Unlimited, if medically necessary | 80% of approved amount (after $162 deductible); 50% of approved amount for outpatient mental health services | $162 deductible,§ plus 20% of approved amount and limited charges above approved amount  plus 50% for outpatient mental health services plus 50% for outpatient mental health services |
| Clinical laboratory services: Blood tests, biopsies, urinalyses, and more | Unlimited, if medically necessary | Generally 100% of approved amount | Nothing for services |
| Home health care: Part-time or intermittent skilled care, home health aide services, durable medical equipment and supplies, and other services | Unlimited for as long as client meets conditions for benefits | 100% of approved amount; 80% of approved amount for durable medical equipment | Nothing for services; 20% of approved amount for durable medical equipment |
| Outpatient hospital treatment: Services for the diagnosis or treatment of illness or injury | Unlimited, if medically necessary | Medicare payment to hospital based on hospital cost after co-payment by recipient | Co-payment amount varies (after $162 deductible) |
| Blood | Unlimited, if medically necessary | 80% of approved amount (after $135 deductible and starting with fourth pint) | First three pints plus 20% of approved amount for additional pints (after $135 deductible¶); |
| Screening and Preventive Services: For example, aortic aneurysm, bone density, mammogram, Pap test and pelvic examinations, prostrate screening, certain immunizations and yearly wellness doctor visits | As outlined in Medicare Handbook | For the most part pays the total approved amount and costs for pneumonia and flu immunizations | Nothing for flu and pneumonia immunization and other preventive services, may incur a physician fee in process of screening services. All costs of shingles vaccine |
| Medicare Prescription Drug Coverage (Part D) | |||
| Services | Benefit | Insurance Co-Payment | You Pay |
| Prescription drugs provided through private insurance companies | Varied | Varied | Varied |
2011 Part A monthly premium: None for most beneficiaries; persons who did not contribute during employment years might purchase by paying a premium.
2011 Part B monthly premiums: $115.60 (premium might be higher if you enroll late or have income over $85,000).
*This 60-reserve-days benefit might be used only once in a lifetime.
†Neither Medicare nor private Medigap insurance will pay for most nursing home care.
‡Blood paid for or replaced under Part B Medicare during the calendar year does not have to be paid for or replaced under Part A.
§Once client has had $162 of expenses for covered services in 2011, the Part B deductible does not apply to any further covered services received for the rest of the year.
 Federal law limits charges for physician services.
¶Blood paid for or replaced under Part A Medicare during the calendar year does not have to be paid for or replaced under Part B.
From Medicare and you. (2011). Washington, DC: U.S. Department of Health and Human Services, Centers for Medicare and Medicaid Services.
Stay updated, free articles. Join our Telegram channel

Full access? Get Clinical Tree


