Introduction
This chapter is linked to the data collection section of the web program.
‘All research relies on data to underpin new discoveries or discussions of well-established trains of thought. Whether we term them data, evidence, findings or outcomes, they provide the reader with insight into a research project and allow us to critically assess the project itself’ (Serrant-Green 2008: 3).
Now your research is becoming really interesting because you are at the stage of interacting with your participants, particularly if you are undertaking your research study within a qualitative paradigm. The data collection stage is crucial to the success of your research study. If you collect poor data or the wrong data, then your results will be meaningless or, worse, false. Importantly, it is crucial when writing your research proposal to be very clear about what data you are going to collect as well as how you are going to collect them.
Data collection is simply the formal term for how we gather information. There are many different ways of doing this for both quantitative and qualitative research studies and it is essential that you choose the method that is best suited to your needs. In other words, it must be able to answer your research question or allow you to prove/disprove your hypothesis.
It is also important to bear in mind that, as Cormack (2000) points out, no method of collecting data is perfect because every method has its limitations and strengths. Your role as a researcher is to select or adapt a method which is as near perfect as possible for your particular research study, and then you must be able to discuss the strengths and weaknesses of the method you have chosen as well as giving a rationale for why you chose it.
Once you have selected your data collection method, you will need to construct a data collection plan so that you can determine step-by-step:
- how you intend to collect the data;
- the sequence in which the data will be collected;
- the time and cost of collecting the data.
This will include the actual use of your data collection instrument(s), but you will also need to configure within your plan how much time you will require for:
- identifying potential subjects for your sample (see chapter 7);
- explaining the study to your participants;
- obtaining their consent
(Burns & Grove 2005).
Once you start your data collection – including the points mentioned above – you may find that practicalities will intrude and that you have to modify your plan. For example, you may find that potential participants need longer to reach a decision as to whether or not they wish to take part, or you may find that interviews are so exhausting that you need longer between them to analyse the data and/or to recover from the previous interview. Interviews can be mentally draining because you have to listen attentively, whilst at the same time thinking of your next question, trying to work out the direction the interview is taking or assessing if the interviewee is fit enough to continue, and so on. Depending on the subject matter, the interview can also be emotionally draining for both the interviewer and the interviewee; the interviewer later faces the same emotions when he/she transcribes the interview.
Another point that is very important to bear in mind when thinking about data collection is the importance of ensuring its consistency, particularly in research studies where there is interaction between the researcher and the participants (Burns & Grove 2005). If more than one person is going to take on the role of data collector (e.g. interviewer), it is important to ensure that there is consistency between them as regards interviewing technique, questions asked and approach to participants. This is known as interrater reliability. In addition, it is important that all the data collectors receive the same information about your research study, that they are familiar with the data collection instruments you are using and that they have received adequate and equal training (Burns & Grove 2005).
Collecting data
One way of characterising the differences between quantitative and qualitative research is by means of the methods that we use (Dodd 2008). In essence, methods of obtaining data for quantitative research studies include tests/experiments and questionnaires, as well as an examination of existing databases (electronic or otherwise). Whereas, methods of obtaining data for qualitative research include interviewing, observations and focus group work (Dodd 2008).
No matter what type of research is being carried out, all researchers need to think about (and later perform during the conduct of the actual study) four tasks concerning the process of data collection when writing the research proposal. These are:
- selecting the subjects;
- collecting data consistently;
- maintaining research controls – criteria of sample participants, methodological controls, elimination/admission of bias;
- solving problems/conflicts that may arise and jeopardise your study throughout the duration of the research project
(Burns & Grove 2005).
If you have been lucky with the design of your research study, you may have decided to use an established data collection instrument (there are many available for both quantitative and qualitative research studies). However, you may not find something that is suitable for your particular research study, in which case you may decide to develop your own data collection instrument. If you do, it is very important that you test it rigorously, systematically and honestly before the study begins. This will enable you to determine whether the instrument can collect the data you require. In addition, it will allow you to identify any parts that are difficult for participants to understand and/or to answer.
Another benefit of pre-testing your data collection instrument is that it allows you to estimate how long it will take to collect the data using that instrument, which, of course, has a bearing on the time allowance in your data collection plan. In fact, for this very reason, it is often considered a good idea to pre-test all the data collection instruments that you may be using (Polit & Hungler 1999).
So, now it is time for us to look at the selection of data collection instruments and methods for use in both the quantitative and qualitative research paradigms.
Quantitative research – data collection
‘The fundamental principles guiding data collection in quantitative research are that data are derived in a way that is independent of the expectations of the observer and that the data are true representations of a phenomenon’ (Botti & Endacott 2005: 188).
According to Botti & Endacott (2005) there are just two approaches to answering quantitative research questions, namely:
- descriptive; and
- experimental.
Descriptive quantitative research is concerned with the observation of phenomena that occur without any interference on the part of the researcher – there is no manipulation of the observed phenomena. Experimental quantitative research, on the other hand, is concerned with the manipulation of phenomena in order to observe the effects that this manipulation or interference has on other phenomena.
The methods of data collection for both types of quantitative research have many similarities. In theoretical terms, quantitative data collection is underscored by four principles:
Empiricism is observation and measurement – and whatever is observed or measured must be able to be replicated by others. Replicability is important because it ensures that any results found in the research can be repeated in replication studies by other researchers. Measurement requires the explicit definition of data collection tools and of instruments that have been used to measure the phenomena, whilst objectivity is essential in order to eliminate any biases arising in the data collection and interpretation (Botti & Endacott 2005).
In practice, there is a variety of techniques that can be used to collect data in a quantitative research study. However, all of them are geared to numerical collection.
These numerical data can be collected by means of:
In quantitative research, the data are collected and recorded systematically, and these are then organised so that they can be entered into a computer database (Burns & Grove 2005).
Variables
The term ‘variable’ occurs at several points in this and previous chapters and is a very important element of quantitative research, so before we turn to the different data collection methods, a few words about variables are in order, because these are often what are being measured during the collection of data, particularly when using scales and other physiological measurements in experimental research.
When you look at many experimental quantitative research studies you will find that the phenomenon of interest is linked to various differences between people or within people, both before and after certain events or treatments. This phenomenon is what we call a ‘variable’. There are two types of variables that we use in quantitative research, namely:
- independent variables;
- dependent variables.
An independent variable is the experimental factor in the research study that is manipulated by the researcher, whilst the dependent variable is what is being studied to see if the experimental factor has had any effect (Lanoë 2002). For example, if you want to study the effects of two ways of reducing a high temperature in a baby (e.g. tepid sponging and anti-pyretic drug) in order to see which is the more effective, then the different ways of trying to reduce temperature would be the independent variables, and the rate of reduction of temperature would be the dependent variable (i.e. it is dependent on the effectiveness of the independent variables).
Observation
In quantitative research, the observation must be structured so that there is a defined purpose to it. The first step in structured observational measurement is to define what is to be observed. A definition of observational measurement is ‘the use of structured and unstructured observation to measure study variables’ (Burns & Grove 2005: 744).
Once the decision has been made as to what is to be observed, the next step is to decide how the observations are to be made, recorded and coded. Observations can be made in a laboratory or a natural setting, and each can give rise to its own problems. For example, a laboratory is an artificial setting and may alter the behaviour of the participants, either making them more constrained and inhibited than they otherwise would be, or giving them licence to overact and adopt a false persona.
Within a natural setting, the same problems of influencing behaviour can arise if the participants are aware that they are being observed. If they are not aware that they are being observed, then there are problems linked to privacy and ethics (see chapter 6). Making observations using a data collection instrument/tool can lead to varying degrees of structure that are imposed by you the researcher – for example, there may be an unstructured observation of interactions between participants (more of a qualitative study), or there may be a more structured collection of data by tabulating such quantitative concepts as frequency of an action or degree of response to an action or treatment (definitely a quantitative study).
Polit & Hungler (1999: 314) discuss a serious problem that can arise from the use of observation as a data collection tool, namely its vulnerability to observer bias. They detail a number of biases which can affect the validity and reliability of objective observations:
- emotions, prejudices, attitudes and values, which may unconsciously colour what the observer is witnessing;
- personal interest and commitment, which may cause the observer to see what he/she wants to see;
- anticipation of what is to be observed naturally, which affects what the observer has actually seen;
- making too hasty decisions on what has been seen before all information has been gathered.’
Polit & Hungler (1999) conclude that it is probably impossible to eliminate observation biases altogether, but the aim should be to minimise them as far as possible.
In most cases, a category system is developed for organising and sorting the behaviour or events that are being observed. The categories that are to be observed should be mutually exclusive. The observer may use checklists as an aid to the structured observation (Burns & Grove 2005).
Checklists are techniques to indicate whether or not a behaviour or event/happening occurred during the observation. Usually the checklist contains a number of defined behaviours/happenings/events that it has previously been decided will be the units of data that the researcher is interested in for a particular research project. A mark is usually then placed against that behaviour, happening or event, if they do occur. Behaviour that does not appear on the checklist is ignored.
Interviews
Although interviews are usually associated with qualitative research, they can have a role to play in quantitative research as well. In the case of quantitative research, the interview will be totally structured, with the interviewee being able to choose a response (usually one word) from a series on the interview form. Often the reply can be a simple ‘yes’ or ‘no’, or it may be a number. Alternatively, the interviewee may be asked to choose one item from a list. These replies can then be coded and entered into a database for statistical analysis. The interview may well be linked to a checklist.
In quantitative research, an interview is often used in these cases because of the poor return rate of postal questionnaires and checklists.
Questionnaires
Questionnaires may seem to be an easy option for a researcher, but actually are very difficult to devise and use correctly. However, they can be useful for collecting data on simple and well-defined issues.
The design of questionnaires should be carefully planned and piloted to ensure that they provide:
- the required data;
- data that can be analysed and used;
- an unbiased response.
Questionnaires should ideally be developed from a pilot study (see chapter 5).
There are two types of questions that you can include, depending on whether it is going to be a quantitative or a qualitative questionnaire. These are:
- closed questions – usually quantitative;
- open-ended questions – usually qualitative.
Often, we are warned against putting ‘leading’ questions in questionnaires. All questions are ‘leading’ in some respect though, but some lead more than others. However, they all lead towards an answer.
If you wish to construct your own reliable and valid questionnaire in order to collect high quality data, you have to accept that this is a subtle and sophisticated art. It is all too easy to devise a poor questionnaire, but much more testing to devise a high-quality one, but it is essential that you do, because poorly designed questionnaires produce poor quality data. Lydeard (1991, cited in Mathers & Huang 2004) describes the steps necessary in the process of developing a questionnaire for use as a research tool:
- Define the area of investigation.
- Formulate the questions.
- Choose the sample and maximise the response rate.
- Pilot and test for validity and reliability.
- Recognise sources of error.
Hagerty & Patusky (1995) describe the process of developing a questionnaire that they went through in order to measure ‘sense of belonging’ through a number of steps:
- The area of investigation was defined by reviewing the relevant literature.
- The questions were formulated from a number of sources, including a literature review and clinical experiences, and statements by people who participated in earlier focus group interviews.
- The process of sampling and piloting was undertaken with community college students and clients diagnosed with major depression in hospital.
- A third group of Roman Catholic nuns were subsequently sampled.
- Details of how the response rate was maximised (e.g. paying respondents for completed questionnaires) are also given.
- A good description of how the validity and reliability testing of the questionnaire was established is also included, for example, a panel of experts assessed content validity, and retest reliability was examined through the studies with the three subject groups.
- Finally, some consideration was given to the possible sources of error in the whole process of developing the instrument.
If you come across a detailed description of how a particular questionnaire was developed such as the one above, you can have confidence in the rigour of the study. But it also gives you some idea of what you have to do if you are developing your own questionnaire, so our advice would be, wherever possible, use an accepted questionnaire, or failing that, to discuss what you want to achieve with an experienced researcher.
In any research study which has used a self-developed instrument for data collection, sufficient detail should be given to allow for an appraisal of how it was developed before it was applied in the study. However, what is important is that you recognise that whether or not a questionnaire is an appropriate data collection method depends on the research question that has been asked. Indeed, you should always ask whether the method of collecting data was appropriate whenever you come across a research paper or a paper describing evidence-based care. You also need to ask whether the research methodology the researchers used was the right one for the research question that was being asked. This is why it is important that the authors of a research paper state what the research question or hypothesis is at the very beginning of the paper, in order for you to be able to decide whether or not they are using the correct research methodology and method of data collection.
Finally, when you become involved in a research study yourself, you must make sure that you know exactly what your research question is (or hypothesis is if it is experimental quantitative research), and also that it is the correct question for what you want to achieve.
Summary of questionnaires
- Careful questionnaire design is essential in quantitative and qualitative research for the collection of good quality data.
- You should look for evidence that research methods have been piloted and modified accordingly.
Scales
Scales are a very common data collection tool for quantitative research studies because they lend themselves to the simple collection of data from a very large sample/population; they also give rise to statistics.
You now know that quantitative research involves numbers, and we can define the numerical values with respect to the following measurement scales:
- nominal scales;
- ordinal scales;
- interval scales;
- ratio scales.
Nominal scales
A nominal scale is a type of measurement which has only a limited number of possible outcomes which cannot be placed in any order that represents what are considered to be intrinsic properties of the measurements.
On a nominal scale, numbers are present in order to establish identity only (e.g. male or female). Nominal scales classify data into distinct categories in which there is no implied ranking. Note that ranking means placing objects, etc. in order – 1st, 2nd … 30th and so on. In nominal scales:
- Values are assigned to categories, e.g. in a sample, there are 50 men and 39 women.
- The categories cannot be placed in ranks of 1st, 2nd, 3rd and so on.
- The numbers assigned have no intrinsic meaning – for example, you may give each of the participants in your research study a number (1, 2, 3, 4 …), in order to make it easier for you to analyse data from your research.
Data that are collected here represent categories of a particular variable, for example, gender, where females could be categorised as ‘1’ and males as ‘2’. These numbers have no numerical significance.
Ordinal scales
An ordinal scale is a type of measurement that classifies data into distinct categories. Here ranking (or ordering) is implied and utilised in the research study. In these scales, the relative values of data are defined in terms of being less than, equal to or greater than other data on the scale.
In ordinal scales:
- Numbers are assigned to categories that correspond to order/ranks (1st, 2nd, and so on).
- Responses on the scale can be ranked from high to low, or vice versa.
- The distance between the first and second category does not have to be the same as that between the second and third, or the third and fourth categories.
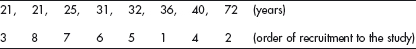
For example, you may want to rank the ages of participants in your research study, and you could do it as an ordinal scale with the nominal numbers (which are assigned when the participants are recruited for the research) below the ages:
Stay updated, free articles. Join our Telegram channel

Full access? Get Clinical Tree


