CHAPTER 19 After reading this chapter, you should be able to do the following: • Identify the key elements of a focused clinical question. • Discuss the use of databases to search the literature. • Screen a research article for relevance and validity. • Critically appraise study results and apply the findings to practice. • Make clinical decisions based on evidence from the literature combined with clinical expertise and patient preferences. Go to Evolve at http://evolve.elsevier.com/LoBiondo/ for review questions, critiquing exercises, and additional research articles for practice in reviewing and critiquing. Consider the case of a nurse who uses evidence from the literature to support her practice: Developing a focused clinical question will help Nancy to focus on the relevant issue and prepare her for subsequent steps in the evidence-based practice process (see Chapters 1, 2, and 3). A focused clinical question using the PICO format (see Chapters 2 and 3) is developed by answering the following four questions: 1. What is the population I am interested in? 2. What is the intervention I am interested in? 3. What will this intervention be compared to? (Note: depending on the study design, this step may or may not apply.) 4. How will I know if the intervention makes things better or worse (identify an outcome that is measurable)? As you recall from Chapters 1, 2, and 3, most evidence-based practitioners use the simple mnemonic PICO to help recall all of the requirements for a well-designed clinical question (Table 19-1). TABLE 19-1 USING PICO TO FORMULATE CLINICAL QUESTIONS Data from Wenner R, Askari SK, Cham PMH, et al: Duct tape for the treatment of common warts in adults: a double-blind randomized controlled trial, Arch Dermatol 143(3):309–313, 2007. 1. Therapy category: When you want to answer a question about the effectiveness of a particular treatment or intervention, you will select studies that have the following characteristics: http://www.casp-uk.net/wp-content/uploads/2011/11/CASP_RCT_Appraisal_Checklist_14oct10.pdf. 2. Diagnosis category: When you want to answer a question about the usefulness, accuracy, selection, or interpretation of a particular measurement instrument or laboratory test, you will select studies that have the following characteristics: • Cross-sectional study design (see Chapter 10) with people suspected to have the condition of interest • Administration to the patient of both the new instrument or diagnostic test and the accepted “gold standard” measure • Comparison of the results of the new instrument or test and the “gold standard” When studies are in this category, you use a diagnostic test appraisal tool to evaluate the article. A diagnostic tool can be accessed at http://www.casp-uk.net/wp-content/uploads/2011/11/CASP_Diagnostic_Appraisal_Checklist_14oct10.pdf. 3. Prognosis category: When you want to answer a question about a patient’s likely course for a particular disease state or identify factors that may alter the patient’s prognosis, you will select studies that have the following characteristics: When studies are in this category, you use a prognosis appraisal tool (sometimes called a cohort tool) to evaluate the article. A prognosis tool can be accessed at http://www.casp-uk.net/wp-content/uploads/2011/11/CASP_Cohort_Appraisal_Checklist_14oct10.pdf. 4. Harm category: When you want to determine whether or not one variable is related to or caused by another, you will select studies that have the following characteristics: When studies are in this category, you use a harm appraisal tool (sometimes called a case-control tool) to evaluate the article. A harm tool can be accessed at http://www.casp-uk.net/wp-content/uploads/2011/11/CASP_Case-Control_Appraisal_Checklist_14oct10.pdf. There are two important reasons for applying clinical categories to the professional literature. First, knowing to which category a clinical question belongs helps you search the literature efficiently (see Chapter 3). Second, these structured tools, based on study research design, help you to systematically appraise the strength and quality of evidence provided in research articles. The literature is organized into electronic indexes or databases. Chapter 3 discusses the differences among databases and how to use these databases to search the literature. One or two sessions with a librarian will help you focus your search to your clinical question. You can also learn how to effectively search databases through a Web-based tutorial located at www.nlm.nih.gov/bsd/disted/pubmed.html#qt. Using the PubMed database (www.pubmed.gov), Nancy uses the search function and enters the term “bed alarms.” This strategy provides her with 92 articles. She does a quick scan and realizes that many of the articles do not answer her clinical question, many are not research studies, and some articles are about alarms other than bed alarms to prevent falls. She recalls that the PubMed database has a clinical queries filter option that finds citations that correspond to a specific clinical category. She reenters the search term “bed alarm” and selects the therapy option (which will only yield articles that use an experimental study design). Her search yields four individual articles with a controlled study design. A careful perusal of the list of articles and a well-designed clinical question help Nancy to select the key articles. Once you have searched and selected the potential articles, how do you know which articles are appropriate to answer your clinical question? This is accomplished by screening the articles for quality, relevance, and credibility by answering the following questions (D’Auria, 2007; Miser, 2000): 1. Is each article from a peer-reviewed journal? Articles published in peer-reviewed journals have had an extensive review and editing process (see Chapter 3). 2. Are the setting and sample of each study similar to mine so that results, if valid, would apply to my practice or to my patient population (see Chapter 12)? 3. Are any of the studies sponsored by an organization that may influence the study design or results (see Chapter 13)? Nancy reviews the abstract of the articles retrieved from her PubMed citation lists and selects the following article: “Effects of an Intervention to Increase Bed Alarm Use to Prevent Falls in Hospitalized Patients: A Cluster Randomized Trial” (Schorr et al., 2012). This study was published in 2012 in Annals of Internal Medicine, a peer-reviewed journal. This is a clinical intervention trial that has an experimental design and is a therapy category study. Nancy reads the abstract and finds that the objective of the study was to investigate whether an intervention aimed at increasing bed alarm use decreases hospital falls on one unit compared to usual care (the placebo). The setting of the study was in an urban academically affiliated community hospital. The study authors received funding for this investigation from the National Institute on Aging, and Nancy finds that there were no funding or conflict of interest issues noted. Nancy decides that this study is worth evaluating and selects the therapy category tool. Applying study results to individual patients or to a specific patient population and communicating study findings to patients in a meaningful way are the hallmark of evidence-based practice. Common evidence-based practice conventions that researchers and research consumers use to appraise and report study results in clinical practice are identified by four different types of clinical categories: therapy, diagnosis (sensitivity and specificity), prognosis, and harm. The language common to meta-analysis was discussed in Chapter 11. Familiarity with these evidence-based practice clinical categories will help Nancy, as well as you, to search for, screen, select, and appraise articles appropriate for answering clinical questions. In articles that belong to the therapy category (experimental, randomized controlled trials [RCTs], or intervention studies), investigators attempt to determine if a difference exists between two or more interventions. The evidence-based language used in a therapy article depends on whether the numerical values of the study variables are continuous (a variable that measures a degree of change or a difference on a range, such as blood pressure) or discrete, also known as dichotomous (measuring whether or not an event did or did not occur, such as the number of people diagnosed with type 2 diabetes) (Table 19-2). TABLE 19-2 DIFFERENCE BETWEEN CONTINUOUS AND DISCRETE VARIABLES Generally speaking, therapy studies measure outcomes using discrete variables and present results as measures of association as illustrated in Table 19-3. Understanding these measures is challenging but particularly important because they are used by nurses and other health care providers to communicate to each other and to patients the risks and benefits or lack of benefits of a treatment (or treatments). They are particularly useful to nurses because they inform decision making that validates current practice or provides evidence that supports the need for change in clinical practice. TABLE 19-3 MEASURES OF ASSOCIATION FOR TRIALS THAT REPORT DISCRETE OUTCOMES For example, patients with heart failure (HF) generally have a poor quality of life because they often require frequent hospital admissions to manage the worsening of their disease; in fact, it is the most common diagnosis in patients older than 65 years admitted to hospitals, and it is estimated that more than $39.2 billion is spent annually on the management of HF (American Heart Association, 2012). One of the HF management goals is to reduce the number of inpatient admissions to the hospital. Investigators asked the following focused clinical question: “In patients with chronic heart failure, does a telephone intervention by nurses reduce admission for worsening HF?” (GESICA Investigators, 2005). In this RCT, participants with HF were randomized to receive usual HF care (the control group) or an intervention that consisted of a phone call every 2 weeks to monitor patients and make therapeutic recommendations as to medications, diet, or physical activity. The data for the primary study endpoint is described in Table 19-4. From the calculated study data in Table 19-4, it can be concluded that a telephone intervention by nurses is effective in reducing hospitalization for worsening HF. But with so many calculated values (e.g., relative risk [RR], relative risk reduction [RRR], absolute risk reduction [ARR]), it could be difficult for you to know which one of these numerical variables is most important (see Table 19-3 for definitions). TABLE 19-4 INTERPRETATION OF MEASURES OF ASSOCIATION
Strategies and tools for developing an evidence-based practice

Evidence-based tool #1: Asking a focused clinical question
Patient population
What group do you want information on?
Adults with common warts
Intervention (or exposure)
What event do you want to study the effect of?
Duct tape
Comparison
Compared to what? Better or worse than no intervention at all, or than another intervention?
Physical methods (e.g., cryotherapy) or no intervention at all (e.g., placebo)
Outcomes
What is the effect of the intervention?
Wart resolution
Evidence-based tool #2: Searching the literature
Evidence-based tool #3: Screening your findings
Evidence-based tool #4: Appraise each article’s findings
Therapy category
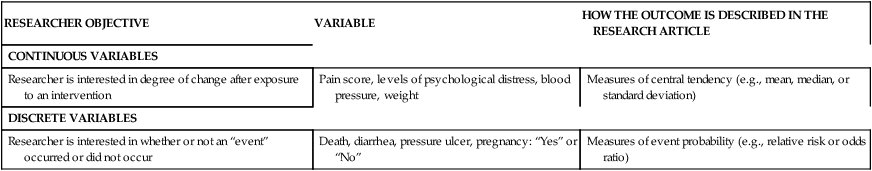
RESEARCHER OBJECTIVE
VARIABLE
HOW THE OUTCOME IS DESCRIBED IN THE RESEARCH ARTICLE
CONTINUOUS VARIABLES
Researcher is interested in degree of change after exposure to an intervention
Pain score, levels of psychological distress, blood pressure, weight
Measures of central tendency (e.g., mean, median, or standard deviation)
DISCRETE VARIABLES
Researcher is interested in whether or not an “event” occurred or did not occur
Death, diarrhea, pressure ulcer, pregnancy: “Yes” or “No”
Measures of event probability (e.g., relative risk or odds ratio)
MEASURE OF ASSOCIATION
DEFINITION
COMMENT
Control event rate (CER)
Proportion of patients in control group in which an event is observed
The CER is calculated by dividing the number of patients who experienced the outcome of interest by the total number of patients in the control group.
Experimental event rate (EER)
Proportion of patients in experimental treatment groups in which an event is observed
The EER is calculated by dividing the number of patients who experienced the outcome of interest by the total number of patients in the experimental group.
Absolute risk reduction (ARR), also called risk difference or attributable risk reduction
This value tells us the reduction of risk in absolute terms. The ARR is considered the “real” reduction because it is the difference between the risk observed in those who did and did not experience the event.
Arithmetic difference in risk of outcome between patients who have had the event and those who have not had the event, calculated as EER − CER
Relative risk (RR), also called risk ratio
Risk of event after experimental treatment as a percentage of original risk
The RR is calculated by dividing the EER/CER.If CER and EER are the same, the RR = 1 (this means there is no difference between the experimental and control group outcomes). If the risk of the event is reduced in EER compared with CER, RR < 1. The further to the left of 1 the RR is, the greater the event, the less likely the event is to occur.
If the risk of an event is greater in EER compared with CER, RR > 1. The further to the right of 1 the RR is, the greater the event is likely to occur.
Relative risk reduction (RRR)
This value tells us the reduction in risk in relative terms. The relative risk reduction is an estimate of the percentage of baseline risk that is removed as a result of the therapy; it is calculated as the ARR between the treatment and control groups divided by the absolute risk among patients in the control group.
Percent reduction in risk that is removed after considering the percent of risk that would occur anyway (the control group’s risk), calculated as EER − CER/CER
Clinical question: In patients with chronic heart failure, does a telephone intervention by nurses reduce admission for worsening heart failure (HF)?
TREATMENT
TOTAL NUMBER OF PATIENTS
NUMBER OF PATIENTS WHO WERE ADMITTED
NUMBER WHO WERE NOT ADMITTED
Nurse intervention group
760
200
560
Usual care group
758
235
523
TOTALS
1518
435
1083
Calculations Made from Study Results
Experimental event rate (EER)
200/760 = 0.26 or 26%
Interpretation: The EER is the proportion of patients in the experimental group who experienced the primary outcome, hospitalization. The interpretation is that 26% of the patients who received the nurse intervention were hospitalized.
Control event rate (CER)
235/758 = 0.31 or 31%
Interpretation: The EER is the proportion of patients in the control group who experienced the primary outcome, hospitalization. The interpretation is that 31% of the patients who received the usual care were hospitalized.
Absolute risk reduction (ARR)
31%−26% = 5%
Interpretation: The RR is helpful in telling us if the risk of an event is reduced or increased. It is helpful to know by how much the event is reduced given that we now know that hospitalization occurs in those who do and do not receive the intervention. In this case 5% of the patients who received the intervention are spared hospitalization.
Relative risk (RR)
EER/CER
Interpretation: We can easily calculate the relative risk, but the study authors have already provided that information. The RR for hospitalization is 0.80. Recall from Table 19-3 that if the RR < 1.0, the risk of an event is reduced. In this case the intervention reduces the risk of hospitalization. The actual interpretation is that the risk of hospitalization is 0.80 times less than for participants who did not receive the intervention.
Relative risk reduction (RRR)
RRR = 1.0 − RR
1.0 − 0.80 = 0.20 or 20%
Interpretation: The RRR is helpful in telling us how much of the baseline risk (the control group event rate) is removed as a result of having the intervention. In this case the nurse intervention reduced hospitalization by 20% relative to the control group.![]()
Stay updated, free articles. Join our Telegram channel

Full access? Get Clinical Tree


