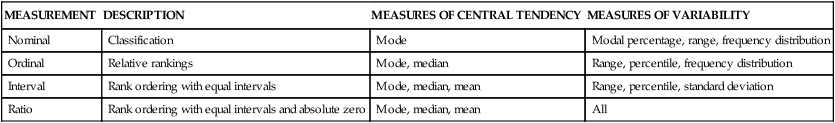
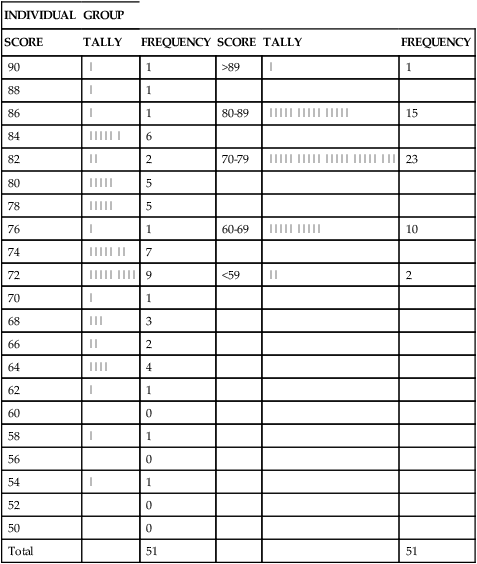
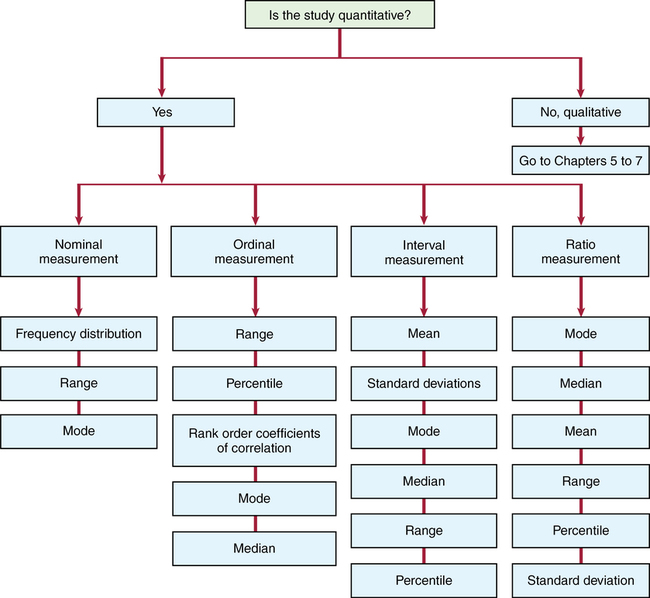
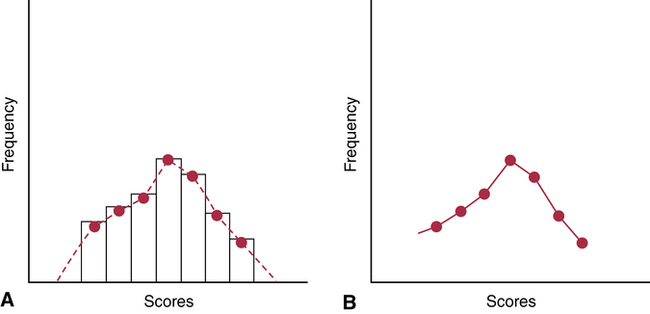
CHAPTER 16 Susan Sullivan-Bolyai and Carol Bova After reading this chapter, you should be able to do the following: • Differentiate between descriptive and inferential statistics. • State the purposes of descriptive statistics. • Identify the levels of measurement in a research study. • Describe a frequency distribution. • List measures of central tendency and their use. • List measures of variability and their use. • Identify the purpose of inferential statistics. • Explain the concept of probability as it applies to the analysis of sample data. • Distinguish between a type I and type II error and its effect on a study’s outcome. • Distinguish between parametric and nonparametric tests. • List some commonly used statistical tests and their purposes. • Critically appraise the statistics used in published research studies. • Evaluate the strength and quality of the evidence provided by the findings of a research study and determine their applicability to practice. Go to Evolve at http://evolve.elsevier.com/LoBiondo/ for review questions, critiquing exercises, and additional research articles for practice in reviewing and critiquing. Procedures that allow researchers to describe and summarize data are known as descriptive statistics. Descriptive statistics include measures of central tendency, such as mean, median, and mode; measures of variability, such as range and standard deviation (SD); and some correlation techniques, such as scatter plots. For example, Alhusen and colleagues (2012; Appendix B) used descriptive statistics to inform the reader about the subjects’ personal characteristics (93% African American, 67% with less than a high school education) and clinical characteristics (84% initiated prenatal care by 14 weeks’ gestation, and 32% were first pregnancies). The measurement level is determined by the nature of the object or event being measured. Understanding the levels of measurement is an important first step when you evaluate the statistical analyses used in a study. There are four levels of measurement: nominal, ordinal, interval, and ratio (Table 16-1). The level of measurement of each variable determines the type of statistic that can be used to answer a research question or test a hypothesis. The higher the level of measurement, the greater the flexibility the researcher has in choosing statistical procedures. Every attempt should be made to use the highest level of measurement possible so that the maximum amount of information will be obtained from the data. The following Critical Thinking Decision Path illustrates the relationship between levels of measurement and appropriate choice of descriptive statistics. TABLE 16-1 LEVEL OF MEASUREMENT SUMMARY TABLE Nominal measurement is used to classify variables or events into categories. The categories are mutually exclusive; the variable or event either has or does not have the characteristic. The numbers assigned to each category are only labels; such numbers do not indicate more or less of a characteristic. Nominal-level measurement can be used to categorize a sample on such information as gender, marital status, or religious affiliation. For example, Alhusen and colleagues (2012; Appendix B) measured marital status using a nominal level of measurement. Nominal-level measurement is the lowest level and allows for the least amount of statistical manipulation. When using nominal-level variables, typically the frequency and percent are calculated. For example, Alhusen and colleagues (2012) found that among their sample of pregnant women 54% were single, 34% were partnered, and 10% were married. A variable at the nominal level can also be categorized as either a dichotomous or categorical variable. A dichotomous (nominal) variable is one that has only two true values, such as true/false or yes/no. For example, in the Thomas and colleagues (2012; Appendix A) study the variable gender (male/female) is dichotomous because it has only two possible values. On the other hand, nominal variables that are categorical still have mutually exclusive categories but have more than two true values, such as marital status in the Alhusen and colleagues study (single, partnered/not married, married, other). In many areas in the social sciences, including nursing, the classification of the level of measurement of scales that use Likert-type response options to measure concepts such as quality of life, depression, functional status, or social support is controversial, with some regarding these measurements as ordinal and others as interval. You need to be aware of this controversy and look at each study individually in terms of how the data are analyzed. Interval-level data allow more manipulation of data, including the addition and subtraction of numbers and the calculation of means. This additional manipulation is why many argue for classifying behavioral scale data as interval level. For example, Alhusen and colleagues (2012) used the Maternal-Fetal Attachment Scale (MFAS), which rates 24 items related to attachment on a 5-point Likert scale from 1 (definitely no) to 5 (definitely yes) with higher scores indicating greater maternal-fetal attachment. They reported the mean MFAS score as 84.1 with a standard deviation (SD) of 14.2. One way of organizing descriptive data is by using a frequency distribution. In a frequency distribution the number of times each event occurs is counted. The data can also be grouped and the frequency of each group reported. Table 16-2 shows the results of an examination given to a class of 51 students. The results of the examination are reported in several ways. The columns on the left give the raw data tally and the frequency for each grade, and the columns on the right give the grouped data tally and grouped frequencies. TABLE 16-2 Mean, 73.1; standard deviation, 12.1; median, 74; mode, 72; range, 36 (54-90). When data are grouped, it is necessary to define the size of the group or the interval width so that no score will fall into two groups and each group will be mutually exclusive. The grouping of the data in Table 16-2 prevents overlap; each score falls into only one group. The grouping should allow for a precise presentation of the data without serious loss of information. Information about frequency distributions may be presented in the form of a table, such as Table 16-2, or in graphic form. Figure 16-1 illustrates the most common graphic forms: the histogram and the frequency polygon. The two graphic methods are similar in that both plot scores, or percentages of occurrence, against frequency. The greater the number of points plotted, the smoother the resulting graph. The shape of the resulting graph allows for observations that further describe the data. The mode is the most frequent value in a distribution. The mode is determined by inspection of the frequency distribution (not by mathematical calculation). For example, in Table 16-2 the mode would be a score of 72 because nine students received this score and it represents the score that was attained by the greatest number of students. It is important to note that a sample distribution can have more than one mode. The number of modes contained in a distribution is called the modality of the distribution. It is also possible to have no mode when all scores in a distribution are different. The mode is most often used with nominal data but can be used with all levels of measurement. The mode cannot be used for calculations, and it is unstable; that is, the mode can fluctuate widely from sample to sample from the same population.
Data analysis: Descriptive and inferential statistics

Levels of measurement
MEASUREMENT
DESCRIPTION
MEASURES OF CENTRAL TENDENCY
MEASURES OF VARIABILITY
Nominal
Classification
Mode
Modal percentage, range, frequency distribution
Ordinal
Relative rankings
Mode, median
Range, percentile, frequency distribution
Interval
Rank ordering with equal intervals
Mode, median, mean
Range, percentile, standard deviation
Ratio
Rank ordering with equal intervals and absolute zero
Mode, median, mean
All
Descriptive statistics
Frequency distribution
INDIVIDUAL
GROUP
SCORE
TALLY
FREQUENCY
SCORE
TALLY
FREQUENCY
90
|
1
>89
|
1
88
|
1
86
|
1
80-89
||||| ||||| |||||
15
84
||||| |
6
82
||
2
70-79
||||| ||||| ||||| ||||| |||
23
80
|||||
5
78
|||||
5
76
|
1
60-69
||||| |||||
10
74
||||| ||
7
72
||||| ||||
9
<59
||
2
70
|
1
68
|||
3
66
||
2
64
||||
4
62
|
1
60
0
58
|
1
56
0
54
|
1
52
0
50
0
Total
51
51
Measures of central tendency
![]()
Stay updated, free articles. Join our Telegram channel

Full access? Get Clinical Tree


Data analysis: Descriptive and inferential statistics
 .
.
Get Clinical Tree app for offline access
