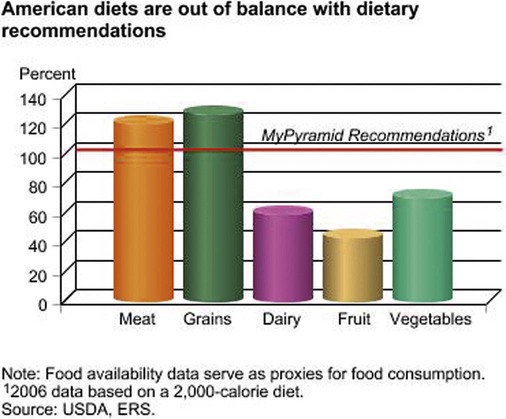
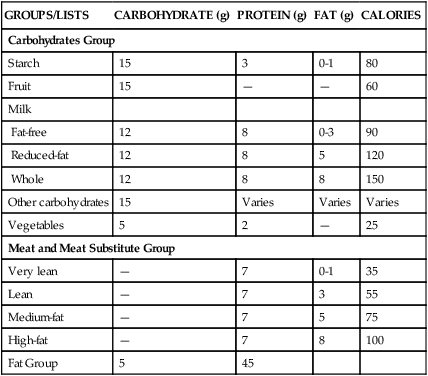
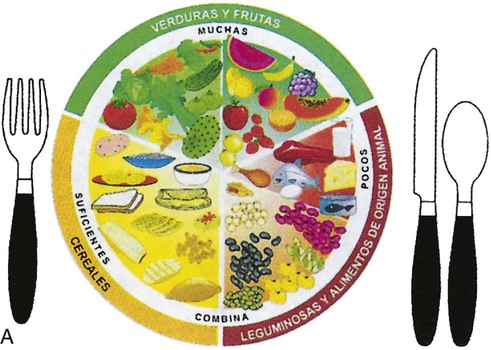
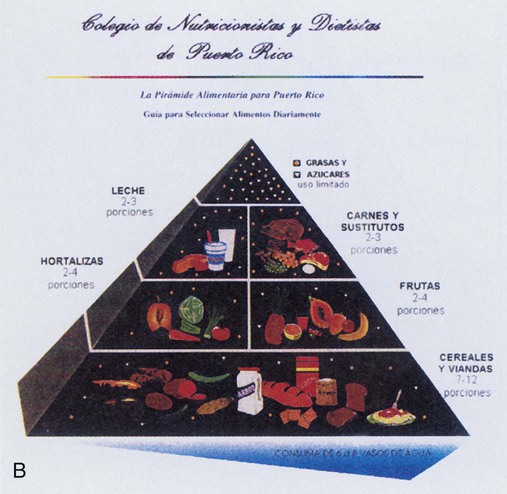
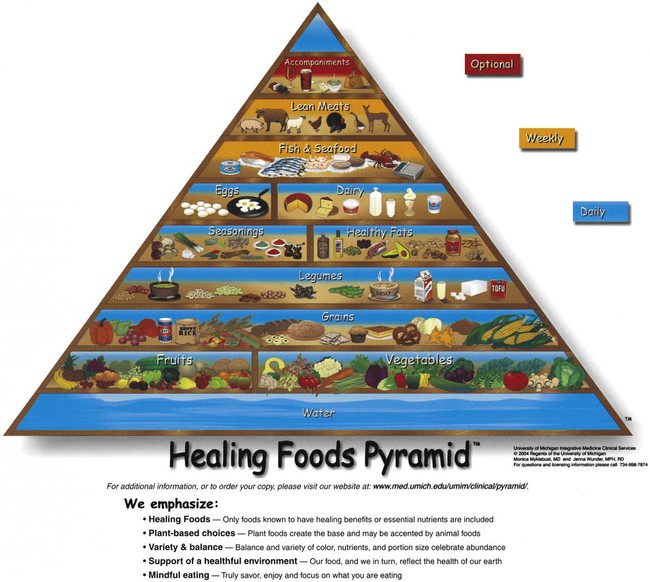
Healthy People 2020 offered the following recommendation: The recommended overarching goals for Healthy People 2020 continue the tradition of earlier Healthy People initiatives of advocating for improvements in the health of every person in our country. They address the environmental factors that contribute to our collective health and illness by placing particular emphasis on the determinants of health. Health determinants are the range of personal, social, economic, and environmental factors that determine the health status of individuals or populations.1 As presented in Chapter 1, wellness is a lifestyle through which we continually strive to enhance our level of health. Health is the merging and balancing of physical, intellectual, emotional, social, and spiritual dimensions. Considering these dimensions in relation to personal and community nutrition broadens our understanding. The physical health dimension is represented by the food guides presented in this chapter. By following the recommendations of the food guides, we may reduce the risk of diet-related diseases. Consumer decisions about food purchases and application of food safety recommendations depend on reasoning abilities that reflect the intellectual health dimension. The emotional health dimension may affect the ability to be flexible when adopting suggested guideline changes. If we (or our clients) have problems doing so, will we view ourselves as “failures”? Social health dimension is tested as we (and our clients) interact with family and friends when we attempt to follow the guidelines. Can we be role models for others without being perceived as threats? Many religions stress personal responsibility for caring for one’s body, which embodies the spiritual health dimension. Part of that responsibility includes the foods we choose to eat. Our food preferences, food choice, and food liking affect the foods we select to eat. Although these terms reflect similar food-related behaviors, they are different.2 Food preferences are those foods we choose to eat when all foods are available at the same time and in the same quantity. Factors affecting preferences include genetic determinants and environmental effects. Genetic factors include inborn desires for sweet and salty flavors. One study of taste receptors notes that because of genetic taste markers, some people experience the taste of vegetables such as broccoli and Brussels sprouts as bitter and therefore avoid such foods, whereas other people find this flavor enjoyable.3 Consumption of cruciferous vegetables, such as broccoli and Brussels sprouts, may be associated with a decreased risk of developing certain cancers.3 If some people avoid them because of perceived bitter taste, will they be more at risk for cancers? Environmental effects are learned preferences that are the result of cultural and socioeconomic influences. We often adjust our choices to match those around us. Because we are around our families the most, their influence is the most significant factor in the choices we make; therefore, the dietary patterns we experience as children affect us throughout our lives4 (see the Cultural Considerations box, Ethnic Food Preferences and Foodborne Illness). In fact, even the food a mother eats prenatally affects the preferences of her child in the future.5 Food liking considers which foods we really like to eat. We may want to eat foods that enhance our health, but we like to eat chocolate cake, for example. We constantly weigh all the factors of preference, choice, and liking when we select the foods we eat. Ultimately, these three types of food behaviors greatly affect individual nutritional status.2 These three food behaviors may be covertly manipulated when the food industry develops and markets foods that appeal to our possible genetic preferences of sweet and/or salty.3 These preferences are reinforced by repeated consumption and through advertising promoting the taste and “having fun” when consuming these products.6 Marketing promotions and product availability may influence selection by consumers because of convenience, including accessibility, cost, or time saving, often with no consideration of nutritional value. Food liking evolves from, and may be the result of, repeated exposures. While some are able to moderate their consumption of less-nutrient-dense food products, others cannot, thereby impacting their nutritional status and health determinants.6 The nutritional status of our communities is a reflection of our individual nutritional health. Perhaps the most significant factor affecting the nutritional status of communities is economics. Having sufficient funds to purchase adequate food supplies is a necessity. Public health nutrition efforts to prevent nutrient deficiencies include the U.S. government’s Food Stamp Program. This program provides individuals and families below certain income levels with coupons to purchase nutritious foods. Another such effort is the Special Supplemental Nutrition Program for Women, Infants, and Children (WIC). The WIC program provides nutrition counseling, supplemental foods, and referrals to other health care and social services to women who are pregnant or breastfeeding and to infants and children up to the age of 5 who are at nutritional risk. Both programs have a significant impact on improving the nutritional status of those who participate. Additional government programs are discussed in Chapters 12 and 13. The recommendations are still needed as four of the ten most common leading causes of death in the United States are diet-related disorders including heart disease, cancers, stroke (cerebrovascular disease), and diabetes mellitus.7 In response to the dietary recommendations, the U.S. Department of Agriculture (USDA) and U.S. Department of Health and Human Services (HHS) developed in 1977 the Dietary Guidelines for Americans. These guidelines are updated every 5 years and are intended for healthy Americans older than 2 years of age. The Dietary Guidelines for Americans are based on the latest scientific knowledge about diet, physical activity, and other health issues. This knowledge is used to formulate lifestyle and dietary pattern recommendations that will contain adequate nutrients, promote health, maintain active lifestyles, and decrease the risk of chronic diseases. As such, the Dietary Guidelines serve as the foundation of federal nutrition policy and education.8 The American public consumes insufficient amounts of certain nutrients such as vitamin D, calcium, potassium, and dietary fiber, even though excessive energy intake has led to a majority of Americans being overweight or obese. The current, Dietary Guidelines for Americans 2010 (hereafter referred to simply as Dietary Guidelines), focuses on the goals of “good health and optimal functionality across the life span” with consideration of the malnutrition (deficiency of nutrient intake) and weight issues of the population-at-large.8 Consequently, to attain these goals a lifestyle (behavioral) approach is suggested. This approach centers on a total diet concept. To implement a total diet concept that is balanced in energy and nutrient content, dietary patterns would emphasize portion size and consumption of plant foods such as vegetables, beans, fruits, whole grains, nuts and seeds, and increased intake of low-fat dairy products and moderate amounts of poultry, lean meats, and eggs.8 In addition, lower intake of foods with added sugars and solid fats supports energy balance goals. Listed in Box 2-1 are the four major actions that if implemented would assist everyone to practice health-promoting nutrient consumption and be physically active. Additional details of the Dietary Guidelines are available at www.dietaryguidelines.gov. • In the morning, choose dry cereals and bread products (e.g., English muffins) that contain whole grains, and alternate or mix these with less-fiber favorites. If no time can be found for breakfast, stock up on portable juices and portable fruit, such as apples or bananas, which can be eaten on the way to class or work. Bring fruit in backpacks or briefcases for a quick snack. • Be creative with vending machine selections. Choose lower-fat and lower-sugar selections such as raisins, bagel chips, pretzels (rub off the excess salt), popcorn, and even some plain cookies or crackers. Some vending machines stock small cans of tuna fish, yogurt, and fruit. Contact the staff responsible for filling the vending machines to request healthier selections. • If lunch and dinner are on the run and fast-food drive-throughs are the only option, select lower-fat items such as grilled chicken sandwiches or plain hamburgers without the sauce. Don’t order french fries or milkshakes (unless they are low fat) every time, but instead alternate with salads and low-fat milk, juice, or water. • Perhaps lunch and dinner are in a college or employee cafeteria. Try to select turkey, chicken (without the skin), fish, and lean beef dishes. Include whole grain bread, a grain (rice or pasta), several vegetables, and salad. Try fruit for dessert; it is good with frozen low-fat yogurt, if available. • Maybe your clients don’t really eat “meals” but eat snacks throughout the day. This is called grazing. It is possible to graze and follow the Dietary Guidelines by choosing wholesome foods instead of candy bars and soda. High-quality grazing foods often available include bagels (with a little cream cheese), yogurt, fruit, pretzels, pizza (but not daily because of the high-fat content of the cheese), and dry cereals with milk. The next time your clients are food shopping or grabbing a snack or meal, encourage them to stop a moment and consider the best choices available (Box 2-2). How do we and our clients implement the recommendations of the Dietary Guidelines on an everyday basis? In the past, the Food Guide Pyramid filled this purpose, but it has been replaced by the MyPlate Food Guidance System designed to guide us through our food selections to meet the goals of the Dietary Guidelines.9 The creation of MyPlate took into account the present patterns of consumption of Americans plus the recommendations of the Dietary Guidelines and the Dietary Reference Intakes (DRIs). The result is a total diet that meets the nutrient needs from foods while limiting dietary components that are often eaten in excess. A tool to use in conjunction with MyPlate is the Nutrition Facts labels on food products. MyPlate is an Internet-based interactive tool providing recommendations based on a person’s age, sex, and activity level. Individuals can go directly to the website (www.MyPlate.gov) and enter their own data to receive personalized guides to the food group servings to meet their needs. The food groups include grains, vegetables, fruits, milk and dairy products, and meat and beans (Figure 2-1). MyPlate is intended for adults; a MyPlate for Preschoolers (ages 2 to 5), MyPlate for Kids (ages 6 to 11), and MyPlate for Moms (pregnancy and lactating) are also available (available at http://www.choosemyplate.gov). For individuals who do not have a computer or access to one, or don’t have computer skills, hard-copy print materials are available. By following the interrelated recommendations of MyPlate, the following results can be expected:9 • Increasing intake of vitamins, minerals, dietary fiber, and other essential nutrients, especially those often low in typical diets • Lowering intake of saturated fats, trans fats, and cholesterol and increasing intake of fruits, vegetables, and whole grains, decreasing risk for some chronic diseases • Balancing intake with energy needs, preventing weight gain, and/or promoting a healthy weight The recommendations represent the following four themes: 1. Variety: Eat foods from all food groups and subgroups. 2. Proportionality: Eat more of some foods (fruits, vegetables, whole grains, fat-free or low-fat milk products) and less of others (foods high in saturated or trans fats, added sugars, cholesterol salt, and alcohol). 3. Moderation: Choose types of foods that limit intake of saturated or trans fats, added sugars, cholesterol, salt, and alcohol. The simple MyPlate symbol reminds us and our clients to make healthy food group choices. The significant concepts of the symbol are highlighted in Figure 2-1. Not all health professionals view the recommendations of MyPlateas the most sound to improve and maintain health. Some cite the increasing incidence of diet-related disorders as evidence that MyPlate recommendations do not meet our health goals. These disorders include type 2 diabetes, obesity, and syndrome X. Syndrome X, or metabolic syndrome, is a group of heart disease risk factors including abdominal obesity, glucose intolerance, high blood pressure, and abnormal blood lipid levels. Perhaps the pyramid is not being followed correctly, resulting in continuing diet-related disorders. Research supports that the dietary intake of most Americans is unbalanced when compared with the recommendations of MyPlate. Intake of meats and grains is higher than recommendations, while consumption of dairy, fruits, and vegetables is lower (Figure 2-2).10 If it is being followed, then the emphasis on complex carbohydrates from grains and the use of animal-derived foods (dairy and protein sources) as the foundation of our dietary intake do not provide the expected health benefits. One of the first alternative pyramids to address these concerns was developed by Dr. Walter Willett, chairperson of the Department of Nutrition at the Harvard School of Public Health. Based on accumulated scientific research, this pyramid—the Healthy Eating Pyramid—changes the focus of food selection and distinguishes between whole and refined grain foods as well as highlights plant sources of protein, such as nuts and legumes, which contain healthful plant oils (Figure 2-3). Animal-derived foods are pushed high up on the Healthy Eating Pyramid to reflect that they are foods to be consumed occasionally. For example, red meat is to be used sparingly or infrequently. Fish, poultry, and eggs are to be consumed zero to two times a day. This is different from the traditional pyramid, which groups animal and plant sources of protein together (meat, poultry, fish, dry beans, eggs, and nuts) with suggested servings of two or three times a day without distinguishing between the nutrient content of these foods. In addition, the Healthy Eating Pyramid includes recommendations for daily exercise and weight control (Figure 2-3).11 Alternative (Figure 2-4) and ethnic food pyramids are also available, providing specific food selections conforming to the general pyramid categories. These recognize that traditional dietary patterns of other cultures also offer opportunities to decrease the risk of diet-related disorders. The Asian, Mediterranean, and Latin American Diet Pyramids are accessible from the Oldways Preservation & Exchange Trust website (www.oldwayspt.org). These pyramids differ from MyPyramid in the number of servings of animal foods, legumes, nuts, and seeds recommended.12 Vegetarian and soul food pyramids have been created as well. Other countries and commonwealths have food guides reflecting their national food supply, food consumption patterns, and nutritional status. Examples of the food guides for Mexico, and Puerto Rico are shown in Figure 2-4. Although the shapes of the guides may differ from MyPyramid of the United States, all recommend similar distributions of food category servings.13 Ethnic food guides may be useful when caring for clients from other countries. Perhaps you have noticed banners and brochures in your local supermarket that proclaim “Fruits & Veggies—More Matters” and other posters advising increased consumption of fruits and vegetables (Figure 2-5). These banners are part of the National Fruit & Vegetable Program. This program represents the first partnership of government, not-for-profit agencies, and private industry to improve the health of Americans. By increasing consumption of fruits and vegetables by all age groups, the program may reduce the risk of certain cancers, diabetes, stroke, and high blood pressure.14 Research shows that about 75% of Americans adults do not consume five or more servings of fruits and/or vegetables a day, which means that only 25% are eating the minimum suggestion. Only 10% follow the recommendations of the Dietary Guidelines to eat seven or more servings of fruits and/or vegetables a day.10 Therefore, most Americans do not meet the recommended five servings of fruits and vegetables a day, even though this amount is the minimum number recommended by MyPyramid. By focusing on only fruits and vegetables, the “Fruits & Veggies” campaign becomes an easy way to decrease intake of fats because fruits and vegetables are naturally low in fat. With seven or more servings of fruits and vegetables each day, increased consumption of fiber, vitamin C, and beta carotene will occur. These nutrients, in addition to their functions as essential nutrients, are recognized as having the potential to reduce the risk of developing heart disease and certain cancers. Fruits and vegetables are also excellent sources of antioxidants and phytochemicals, for which potential health benefits are continually being uncovered. The food guides refer to eating a number of servings of specific foods daily. But what is a “serving”? A resource for serving sizes is the Exchange Lists for Meal Planning, published jointly by the American Dietetic Association (ADA) and the American Diabetes Association15 (see Appendix A). Serving sizes may differ by weight or volume from the portion sizes we receive in restaurants or serve ourselves at home. Foods are divided into different groups or lists: carbohydrates, meat and meat substitutes, and fats. Each list or exchange contains sizes of servings for foods of that category, and each serving size provides a similar amount of carbohydrate, protein, fat, and kcal. The carbohydrate group is subdivided into lists of starch, fruit, milk, other carbohydrates, and vegetables. The meat and meat substitute group is sorted by fat content (Table 2-1). TABLE 2-1 EXCHANGE GROUP NUTRIENT VALUE From American Diabetes Association and American Dietetic Association: Exchange lists for meal planning (revised), Alexandria, Va, 1995, American Dietetic Association. Guidelines for individuals with diabetes, published by the ADA, deemphasize prescribed calculated kcaloric diets only using the exchange lists.16 The focus is now on adapting dietary intake to meet individual metabolic nutrition and lifestyle requirements (see Chapter 19). Following are criteria used to evaluate future dietary guidelines and recommendations: • Consider the source of the nutrition advice. Are the recommendations from a federal government agency? If so, the work of these agencies is usually reviewed by health and nutrition professionals before release to the public. If the advice is from a private nonprofit group, is the group nationally recognized? A number of well-respected organizations are devoted to prevention and treatment of specific diseases, such as the American Heart Association, American Cancer Society, and American Diabetes Association. In addition, there are professional associations, including the ADA and the Society for Nutrition Education, that specialize in the relationship of nutrition and health. Assess the comprehensiveness of the recommendations. Do the recommendations address only one health problem? If so, is that a health problem that affects your clients? Would following these recommendations have any negative effects? Would a category of nutrients be underconsumed? Recommendations addressing several health issues are usually more complete and provide an increased level of prevention. • Evaluate the basis of the recommendations. How were the recommendations determined? The current recommendations are based on many research studies on the relationships between diet and diseases. If new recommendations are issued, are they based on the results of new studies? If so, how many and what kinds of studies (Box 2-4)? Collecting this type of information means doing more than just listening to a 2-minute radio announcement or a 5-minute TV report. Some newspapers contain in-depth evaluations of research; others just skim the surface. It may be necessary to read the original study in the library or on the Internet, or to discuss the recommendations with other health professionals. • Estimate the ease of application. Can the recommendations be easily adopted? Are they presented in terms of foods (easier to apply) or nutrients (harder to apply)? Is a degree in nutrition needed to understand the recommendations? Food selection patterns may be estimated from assessing government data gathered through national surveys and programs. One approach is to evaluate information gathered from the online MyPyramid Tracker. Developed as part of the MyPyramid food guidance system, the MyPyramid Tracker measures the dietary quality of an individual’s food intake and physical activity based on the extent to which the intake follows the Dietary Guidelines and the DRI recommendations.17 According to research, those with more healthful dietary intakes have higher levels of nutrition knowledge and advanced education levels. Consequently, the data reveal that higher socioeconomic characteristics are related to a greater understanding of nutrition and the effects of healthy diets in reducing the risks of diet-related disorders.18 This difference may reflect access to resources (e.g., time and financial means) supporting preparation and consumption of foods that follow the dietary guidelines. As a nation we need to improve our nutrient intake. An aspect of doing so must take into account our beliefs and attitudes toward our dietary intake. A study using national data reveals that only 23% of the surveyed population is interested in improving their intake, whereas 37% are not interested in doing so, and 40% believe their intake does not need to change. Most view healthy eating as too complicated. In addition, the majority views snacking as an unhealthy practice, and as a result, the majority chooses snacks that are also unhealthy.19 Food consumption trends reflect the food decisions Americans made in the past. Tracking these trends is the responsibility of the USDA. Following changes in consumption trends across the years for specific foods reveals information about food substitutions, including food prices or technologic changes that bring new types of food products to the marketplace. Food consumption trends now show that generally Americans eat more food in larger portions with additional snacks, which results in a greater caloric intake than in the past.20 Food consumption trends affect the nutritional status of the U.S. population. Consumption of fruits and vegetables keeps increasing but still does not meet recommended intakes. This is a concern because fruit and vegetable consumption is ideal to reduce risk factors associated with diet-related chronic diseases.21 Underconsumption may be related to cost. Income differences may account for the difference in consumption because low-income households consume fewer fruits and vegetables than other households. Generally, however, many of us need to learn how to prepare the wider variety of vegetables available in the supermarkets so they taste and look good and are safe to eat. Teaching how to prepare foods is an adjunct goal of nutrition education. Programs such as Fruits & Veggies—More Matters that provide point-of-purchase preparation techniques and recipes should prove effective. Additionally, the popularity of TV cooking shows, such as those broadcast on the Food Network, increase our knowledge base. Some shows such as Iron Chef America, Top Chef, and Throwdown with Bobby Flay—through the use of themes and competitions are popular with viewers, including some men who previously had no interest in food preparation. Animal sources of protein (total meat)—meat, poultry, fish, and shellfish—are increasing.22 In recent years, within this category, beef consumption decreased while poultry and fish consumption increased. More fish is being consumed because of increased availability of fresh and frozen fish since the development of refrigerated and frozen storage techniques. Dairy product trends reflect dietary recommendations to consume products that are lower in fat. The consumption of whole milk with high amounts of fat is decreasing, while the consumption of low-fat and nonfat milk and other dairy products is increasing because of the wide array of new products in the marketplace. Consumption of yogurt and other fermented dairy products with live cultures continues to increase because of their health benefits. Of concern are the continuing trends that as children and adolescents grow older, consumption of milk and juice declines, while soft drink intake increases.23 Soft drinks are drunk in larger quantities per serving than either milk or juice products, so they provide more total calories. Such sweetened beverages may be a factor in the increasing obesity rates of American youth. Caloric sweetener consumption continues to increase.22 Consumption of cane and beet sugars has decreased, but corn and noncaloric sweetener consumption has increased. These changes occurred because the technologies associated with producing corn sweeteners from cornstarch and manufacturing noncaloric sweeteners reduced their costs, allowing them to compete economically with cane and beet sugars. Sweetener and beverage consumption trends affect the nutritional status, depending on whether the type of sweetener or beverage chosen increases or decreases the intake of energy and other nutrients. Other issues of sweeteners are discussed in Chapter 4.
Personal and Community Nutrition
![]() http://evolve.elsevier.com/Grodner/foundations/
http://evolve.elsevier.com/Grodner/foundations/ ![]() Nutrition Concepts Online
Nutrition Concepts Online
Role in Wellness
Personal Nutrition
Food Selection
![]() Community Nutrition
Community Nutrition

Dietary Guidelines for Americans
Lifestyle Applications
Food Guides
MyPlate Food Guidance System
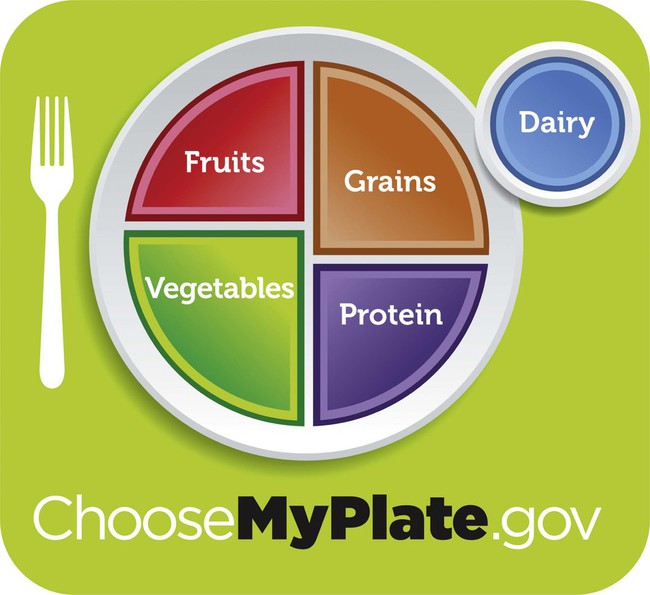
Before you eat, think about what goes on your plate or in your cup or bowl. Fruits: Focus on fruits. Vegetables: Vary your veggies. Grains: Make at least half your grains whole. Protein Foods: Go lean with protein. Dairy: Get your calcium-rich foods. (From U.S. Department of Agriculture, The Center for Nutrition Policy and Promotion, 2011, Author. Accessed June 14, 2012, from www.choosemyplate.gov.)
Other Food Guides

Fruits & Veggies—More Matters
Exchange Lists
The Following Table Shows the Amount of Nutrients in One Serving from Each List.
GROUPS/LISTS
CARBOHYDRATE (g)
PROTEIN (g)
FAT (g)
CALORIES
Carbohydrates Group
Starch
15
3
0-1
80
Fruit
15
—
—
60
Milk
Fat-free
12
8
0-3
90
Reduced-fat
12
8
5
120
Whole
12
8
8
150
Other carbohydrates
15
Varies
Varies
Varies
Vegetables
5
2
—
25
Meat and Meat Substitute Group
Very lean
—
7
0-1
35
Lean
—
7
3
55
Medium-fat
—
7
5
75
High-fat
—
7
8
100
Fat Group
5
45
Criteria for Future Recommendations
Consumer Food Decision Making
Food Selection Patterns
Food Consumption Trends
Implications of food consumption trends

Personal and Community Nutrition
Get Clinical Tree app for offline access
 cups (4 to 13 servings) of fruits and vegetables as recommended daily. By doing so, the goals of the Dietary Guidelines for Americans, Healthy People, and other dietary recommendations may be achieved.

