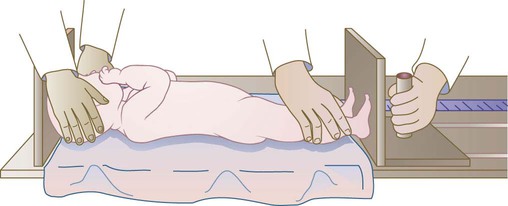
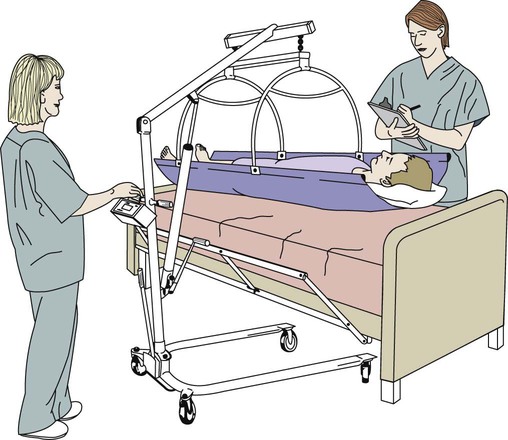
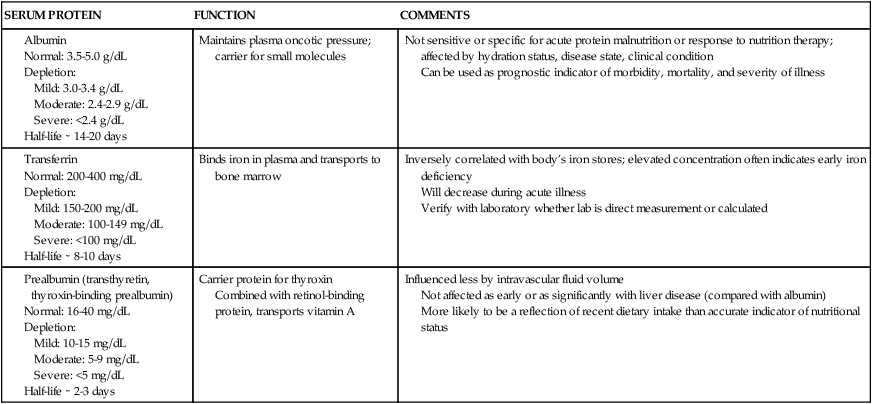
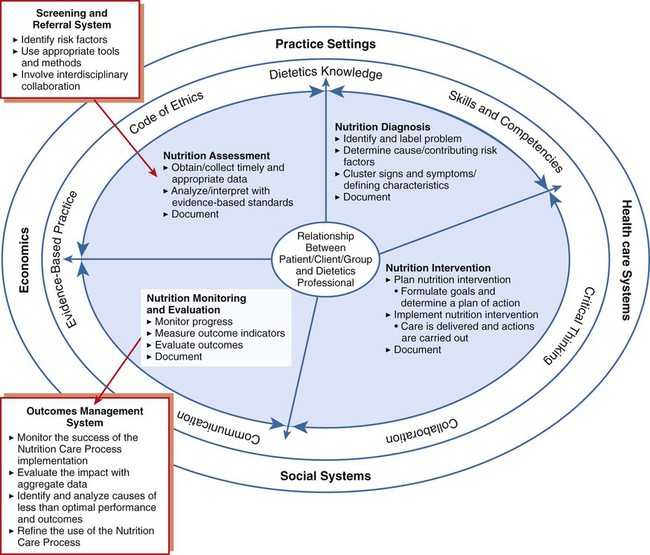
Imagine you have been taken to a place where, after answering a multitude of questions about your insurance, financial status, and durable power of attorney (a legal document in which a competent adult authorizes another competent adult to make decisions for him/her in the event of incapacitation), you are whisked off to a sterile-looking room that you must share with a stranger. In this room your clothes are replaced with a thin, flimsy gown that won’t close in the back. You answer more questions about your medical history from the nurse who admits you. Once he or she finishes, a resident/intern comes into your room to ask many of the same questions and conduct a physical examination (Figure 14-1). Particularly with hospitalized toddlers and adolescents, food can become a battleground because of its emotional connotations (Figure 14-2). As you will see in this chapter and those following, food or alternative nourishment can mean the difference between a good or poor prognosis for many patients’ morbidity or mortality (see the Cultural Considerations box, Asking the Right Questions for Cultural Competence). Occasionally, complete bed rest is prescribed as part of patients’ medical care, or patients may be unable to ambulate because of the severity of their illness or because they are “hooked up” to a multitude of necessary life-saving equipment at bedside. Although it is often necessary or unavoidable, complete bed rest can cause injurious effects on a patient’s body.1 Skin integrity may be compromised after just 24 hours of immobilization, and after 3 days of lying supine in bed, muscle tone, bone calcium, plasma volume, and gastric secretions diminish. In addition, glucose intolerance and shifts in body fluids and electrolytes may also occur. Nursing personnel can provide care that may help prevent or delay injurious effects of bed rest by frequently turning patients and stimulating the skin and underlying muscles by providing skin care (e.g., applying skin lotion) and passive exercises for the extremities, respectively. Many patients admitted to hospitals are at nutritional risk, whereas other may develop malnutrition during their hospitalization.2 These patients may be experiencing hypermetabolism or have physiologic stress from injury or illness that increases nutritional needs, further increasing nutritional risk. Additionally, nutritional needs may be further compromised because of, for example, periodic need for an empty gut for laboratory testing or diagnostic procedures. Likely problems may develop from hospital routine causing inadequate nourishment in some cases, including the following:3 • Highly restricted (nutritionally incomplete) diets remaining on order or unsupplemented too long • Unserved meals due to interference of medical procedures and clinical tests Each ill or injured patient is a unique person and needs individual treatment and care.3 Nursing personnel can be a fundamental factor in prevention of malnutrition by paying particular attention to patients’ diet orders, recognizing potential risk when patients have had nothing but clear or full-liquid diets for more than 24 hours, and contacting the RD to evaluate patients’ nutritional risk. The tremendous advances of medical technology are fundamentally unimportant if the recipient is malnourished or is at nutritional risk. Most patients entering the health care system are prone to have nutrition problems and will have special nutritional needs depending on their injury or illness. Patients at nutritional risk need to be identified so high-quality nutrition care can be provided.4 Poor nutritional status may lead to complications that may lead to increased morbidity and mortality, length of stay, and cost of care.5 For nutrition intervention to be efficacious and successful, a systematic, logical strategy is necessary. The nutritional care process provides such an approach (Box 14-1). In long-term care, assessments must be completed on all residents within 14 days of admission. The Joint Commission (TJC) requires all patients admitted to a hospital to be screened within 48 hours of admission.6 “Nutrition screening is the process of identifying characteristics known to be associated with nutrition problems.”7 It is not possible, or necessary, to complete a full nutrition assessment on every patient. It is necessary, however, to have a system in place to quickly identify patients at risk for nutritional problems, such as malnutrition.7 Nutrition screening can be executed by registered dietitians, dietetic technicians, dietary managers, nurses, physicians, or other trained personnel. Whether or not RDs are engaged in performing nutrition screening, they are responsible for providing input into development of suitable screening parameters to make certain the screening process addresses the correct parameters.7 The nutrition screening process has the following characteristics:8 • It may be completed in any setting. • It facilitates completion of early intervention goals. • It includes collection of relevant data on risk factors and interpretation of data for intervention/treatment. • It helps determine the need for a nutrition assessment. The nutritional care process is often performed during a comprehensive nutritional assessment conducted by dietetic professionals, who work synergistically with nursing personnel to provide this essential component in medical care. A comprehensive nutritional assessment is a procedure conducted by dietetic professionals to determine appropriate medical nutrition therapy based on identified needs of the patient. This process uses data collected from several different sources to assess patients’ nutritional needs, often using the ABCD approach: Anthropometrics, Biochemical tests, Clinical observations, and Diet evaluation. Each part of this process is important because there is no one parameter that directly measures nutritional status or determines nutritional problems or needs. Thus a combination of these parameters must be used to interpret the overall nutrition picture presented by patients within the context of their personal, social, and economic backgrounds.* Anthropometric measurements are determined by simple, noninvasive techniques that measure height and weight, the head, and skinfold thicknesses. Effectiveness of single anthropometric measurements is limited, but certain serial measurements can be useful to assess body composition changes or growth over time. Standardized techniques must be used to obtain valid and reliable measurements. Evaluation of anthropometric data involves comparison of data collected with predetermined reference limits or cutoff points that allow classification into one or more risk categories and, in some cases, identification of the type and severity of malnutrition.9 Discussion of various anthropometric measurements follows. Stature (height/length) is important in evaluating growth and nutritional status in children. In adults, height is needed for assessment of weight and body size. Height should be measured using a fixed measuring stick or tape on a true vertical, flat surface with no carpeting. If this is not available, the movable measuring arm on platform clinic scales may be used with reasonable accuracy, although it tends to produce lower measures.10 The patient should be measured standing as straight as possible, without shoes or head coverings, with the heels together, and looking straight ahead (Box 14-2). Accurate heights are important in nutritional assessment. Many calculations used to determine energy requirements and needs are based on height and weight. Heights are not always available in the medical records of hospitalized patients. When heights are documented, it is often unclear whether they are reported by the patient or measured. Asking patients about their height does not always produce accurate information. On average when asked, people report being slightly taller than they actually are.11 Men overstate height more often than women (men—0.46 in. [1.22 cm]; women—0.68 in. [0.68 cm]), and the extent of overstating height increases as people age.11 If the height of a patient recorded in the medical record is not a measured height, it should be documented as a stated height. When measuring infants and children (younger than 2 to 3 years) who cannot stand or others unable to stand erect without assistance, recumbent measures can be taken while the subject is lying down or reclining. A recumbent length table can be used. A recumbent length table or board has a fixed headboard, a movable footboard, and a permanent measuring tape along the side (Figure 14-4). To measure a patient, he or she should be placed supine on the board or table with shoulders and legs flat against the measuring board (table) and arms at the sides. The head should firmly touch the headboard while the line of vision is perpendicular to the board or table. Soles of the feet should be vertical, and the footboard should touch the bottom of the feet so that the soft tissue is compressed. Length can be recorded from the measure at the footboard. Two people are often needed to take an accurate measurement.10 When the patient is comatose, critically ill, or unable to be moved for other reasons, taking a recumbent bed height may be possible (Box 14-3).12 Note that when compared with standing height, bed height is significantly greater by at least 2%.12 A more accurate measurement for patients who cannot stand is knee height. Knee height is more accurate when measured in a recumbent rather than a sitting position.13,14 This measurement is minimally affected by aging. In older adults, knee height can be measured to estimate height by using the following formulas15: The special calipers necessary for measuring knee height are available from Ross Laboratories in Columbus, Ohio. When accurately measured, body weight is a simple, gross estimate of body composition. In fact, body weight is one of the most important measurements in assessing nutritional status and is used to predict energy expenditure.16 Beam scales with movable but nondetachable weights or accurate electronic scales are recommended to obtain accurate results. Spring scales are not recommended. If the patient is nonambulatory, wheelchair or bed scales should be used (Figure 14-5).10 Scales should be checked for accuracy periodically and recalibrated when necessary. Like heights, actual measured weights are more accurate than patients’ estimated weights because men slightly overreport their weight (men—0.66 lbs [0.30 kg]), and women report slightly less than it actually is (–3.06 lbs [–1.39 kg]).11 For accurate weights, patients should be clothed in their underwear or hospital gown. Weights should be measured at the same time of day and after voiding. The patient should stand still with the weight evenly distributed on both feet while weight is recorded to the nearest 0.1 kg, or 0.25 pound.10 As a nutritional screening tool, weights can be used to recognize changes that may be representative or suggestive of serious health problems. Magnitude and direction of weight change are more meaningful when dealing with sick or debilitated patients than standardized desirable weight references (see Table 14-1). Percent weight change is a useful nutrition index and may be computed as follows: For example, Mrs. Welch is admitted to your unit. Her weight on admission is 120 pounds. During the admissions interview, she indicates that 3 months ago she weighed 135 pounds. Her percent weight change from usual weight is Mrs. Welch’s (actual) weight is 11% less than her usual weight. For example, Mr. Tucker is a patient in the long-term care facility where you work. When he was admitted more than a year ago, he weighed 180 pounds. He has weighed 170 pounds for the past 6 months, but today you weigh Mr. Tucker and he weighs 165 pounds. His percent weight change from admission weight is Mr. Tucker’s (actual) weight is 3% less than his admission weight. For example, Mrs. Bussard was placed on a feeding tube because her weight has decreased from her usual weight of 130 pounds to 115 pounds. She has been on the feeding tube for 1 week, and when you weigh her today, she weighs 122 pounds. Her percent weight change since nutrition intervention is Mrs. Bussard’s weight has increased 7% since the tube feedings were initiated. Care should be taken to identify patients with ascites, edema, or dehydration because their weight changes may be more a reflection of their fluid status than actual changes in body composition. If more than 1 pound is gained in a day’s time, it may be indicative of excess fluid. It is also important to examine any unplanned weight loss the patient might experience, as indicated in Table 14-1. Reported or measured percent weight losses of these magnitudes could be cause for alarm. TABLE 14-1 WEIGHT CHANGE AS AN INDICATOR OF NUTRITIONAL STATUS For older adult patients who cannot be weighed because of the severity of their medical condition, or if bed or chair scales are not available, Chumlea and colleagues17 have developed gender-specific equations used to predict body weight in people 60 to 90 years of age. The estimated weights are based on recumbent measures of arm circumference (AC), calf circumference (CC), subscapular skinfold (SSF), and knee height (KH). Another challenge in obtaining weights occurs in patients who have missing body parts because of accidents or amputation. Figure 14-6 shows the approximate percent of body weight contributed by individual body segments so desirable weight can be calculated. Body mass index (BMI) is a ratio of weight to height and has been associated with overall mortality and nutritional risk.18,19 BMI does not determine body composition (lean body mass or adipose) but is a dependable gauge of total body fat, which is interrelated with risk of disease.20 While measurements are valid for men and women, BMI measurements do have limits:19,20 • BMI has not been validated in acutely ill patients • BMI may underestimate body fat in the elderly and others who have lost muscle mass • BMI may overestimate body fat in individuals who have a muscular build You can determine BMI by referring to Table 10-1 or by dividing weight in kilograms by height in squared meters using the following three steps: 1. Divide weight in pounds by 2.2 to convert it into kilograms. 2. Multiply height in inches by 2.54 and divide the result by 100 to convert height to meters; then multiply height in meters by itself (that is, square it). 3. Divide weight in kilograms (result of step 1) by the square of height in meters (result of step 2). The result is BMI. The desired BMI range for healthy adults is 18.5 to 24.9 kg/m2, which reflects a healthy weight for height. Although at low risk for health problems, people with BMIs of 25 to 29.9 kg/m2 are approximately 20% above desirable levels. A BMI of less than 18.5 kg/m2 is classified as underweight (Table 14-2) and is associated with risk factors such as respiratory disease, tuberculosis, digestive disease, and some cancers.21 TABLE 14-2 CLASSIFICATIONS OF OVERWEIGHT AND OBESITY BY BODY MASS INDEX (BMI) Waist circumference is an economical and straightforward measure that can be used to assess abdominal fat content. BMI and waist circumference highly associate obesity with risk for disease, and both should be used to classify overweight/obesity and estimate disease risk.19,22,23 A circumference greater than 40 inches in men and 35 inches in women indicates risk for disease. It should be noted that visceral adiposity may vary among racial and ethnic groups.22 The most important biochemical parameters are visceral protein status and immune function. Visceral protein status is assessed through tests of serum albumin and prealbumin. (Visceral proteins include proteins other than muscle tissue, such as internal organs and blood.) Immune function is evaluated based on total lymphocyte count (TLC). The test results of these biochemical assessments provide useful information to determine the effects of nutritional factors or of medical conditions on the health status of patients (Table 14-3). TABLE 14-3 BIOCHEMICAL PARAMETERS AND HOW THEY ARE TESTED Adapted from (compiled from components in tables and text) Moore MC: Pocket Guide to Nutrition Assessment and Care, ed 6, St. Louis, 2009, Mosby Elsevier; Thompson CW: Laboratory assessment. In Charney P, Malone AM, editors: ADA Pocket Guide to Nutrition Assessment, ed 2, Chicago, 2009, American Dietetic Association; Lee RD, Nieman DC: Nutritional Assessment, ed 4, Boston, 2007, McGraw Hill. Serum albumin provides an assessment of visceral protein status. Normal values are within 3.5 to 5 g/dL. For nutritional analysis, values between 2.8 and 3.5 g/dL indicate compromised protein status; values less than 2.4 g/dL suggest possible kwashiorkor. This test is most useful when used to monitor long-term nutrition changes because normal values may still be found among patients who are recently malnourished. In addition, if patients are experiencing dehydration (hemoconcentration) or have received infusions of albumin, fresh frozen plasma, or whole-blood serum albumin, levels may appear normal. However, as a tool to assess long-term changes, the effects of dehydration and infusions would dissipate. Alternate causes of abnormally low values may be infection and other stressors (especially with poor protein intake), burns, trauma, congestive heart failure, fluid overload, and severe hepatic insufficiency.24,25 Prealbumin (thyroxine-binding prealbumin) also can provide a measure of visceral protein status assessment. Normal values range from 16 to 40 mg/dL. This test is useful in monitoring short-term changes in visceral protein status because of its short half-life of 2 days. Compromised protein status is indicated when levels are between 10 and 15 g/dL. Possible kwashiorkor is a potential diagnosis when levels are less than 10 mg/dL. A nonnutritional cause of normal values despite patient malnutrition is chronic renal failure. Other factors that result in abnormally low levels of prealbumin include surgical trauma, stress, inflammation, infection, and liver dysfunction.24,25 Features associated with nutritional deficiency may be considered through historical and clinical categories.24,25 Historical findings may include alcohol abuse, poverty, avoidance of specific food groups (e.g., fruits or vegetables), weight loss, drug use (or abuse), family history of inborn errors, and cigarette smoking. Clinical features are extensive, including surgery or wounds; blood loss; dull, dry, pluckable hair; fever; and bleeding gums. Findings may be organized by symptoms of the eyes, face, skin, muscles, tongue, and central nervous system. Table 14-4 provides additional data about historical and clinical features in relation to nutritional status. Table 14-4 SIGNS THAT SUGGEST NUTRIENT IMBALANCE
Nutrition in Patient Care
![]() http://evolve.elsevier.com/Grodner/foundations/
http://evolve.elsevier.com/Grodner/foundations/ ![]() Nutrition Concepts Online
Nutrition Concepts Online
Nutrition and Illness
![]() Hospital Setting
Hospital Setting
Bed Rest
Malnutrition
Nutrition Intervention
Screening
Nutritional Assessment
Anthropometric assessment
![]() Height
Height


![]() Weight
Weight


% WEIGHT CHANGE
TIME PERIOD
NUTRITIONAL STATUS
1%-2%
1 week
Moderate weight loss
>2%
1 week
Severe weight loss
5%
1 month
Moderate weight loss
>5%
1 month
Severe weight loss


Body mass index

BMI (kg/m2)
Underweight
<18.5
Normal
18.5-24.9
Overweight
25.0-29.9
Obesity
≥30
Waist circumference
Biochemical assessment
SERUM PROTEIN
FUNCTION
COMMENTS
Maintains plasma oncotic pressure; carrier for small molecules
Not sensitive or specific for acute protein malnutrition or response to nutrition therapy; affected by hydration status, disease state, clinical condition
Can be used as prognostic indicator of morbidity, mortality, and severity of illness
Binds iron in plasma and transports to bone marrow
Inversely correlated with body’s iron stores; elevated concentration often indicates early iron deficiency
Will decrease during acute illness
Verify with laboratory whether lab is direct measurement or calculated
Carrier protein for thyroxin
Combined with retinol-binding protein, transports vitamin A
Influenced less by intravascular fluid volume
Not affected as early or as significantly with liver disease (compared with albumin)
More likely to be a reflection of recent dietary intake than accurate indicator of nutritional status
Serum albumin
Prealbumin
Clinical assessment
AREA OF CONCERN
POSSIBLE DEFICIENCY
POSSIBLE EXCESS
Hair
Dull, dry, brittle
Pro
Easily plucked (with no pain)
Pro
Hair loss
Pro, Zn, biotin
Vit A
Flag sign (loss of hair pigment in strips around head)
Pro, Cu
Head and Neck
Bulging fontanel (infants)
Vit A
Headache
Vit A, D
Epistaxis (nosebleed)
Vit K
Thyroid enlargement
Iodine
Eyes
Conjunctival and corneal xerosis (dryness)
Vit A
Pale conjunctiva
Fe
Blue sclerae
Fe
Corneal vascularization
Vit B2
Mouth
Cheilosis or angular stomatitis (lesions at corners of mouth)
Vit B2
Glossitis (red, sore tongue)
Niacin, folate, vit B12, and other B vit
Gingivitis (inflamed gums)
Vit C
Hypogeusia, dysgeusia (poor sense of taste, distorted taste)
Zn
Dental caries
Fluoride
Mottling of teeth
Fluoride
Atrophy of papillae on tongue
Fe, B vit
Skin
Dry, scaly
Vit A, Zn, EFAs
Vit A
Follicular hyperkeratosis (resembles gooseflesh)
Vit A, EFAs, B vit
Eczematous lesions
Zn
Petechiae, ecchymoses
Vit C, K
Nasolabial seborrhea (greasy, scaly areas between nose and lip)
Niacin, vit B12, B6
Darkening and peeling of skin in areas exposed to sun
Niacin
Poor wound healing
Pro, Zn, vit C
Nails
Spoon-shaped nails
Fe
Brittle, fragile
Pro
Heart
Enlargement, tachycardia, failure
Vit B1
Small heart
Energy
Sudden failure, death
Se
Arrhythmia
Mg, K, Se
Hypertension
Ca, K
Abdomen
Hepatomegaly
Pro
Vit A
Ascites
Pro
Musculoskeletal Extremities
Muscle wasting (especially temporal area)
Energy
Edema
Pro, vit B1
Calf tenderness
Vit B1 or C, biotin, Se
Beading of ribs, or “rachitic rosary” (child)
Vit C, D
Bone and joint tenderness
Vit C, D, Ca, P
Knock-knee, bowed legs, fragile bones
Vit D, Ca, P, Cu
Neurologic
Paresthesias (pain and tingling or altered sensation in the extremities)
Vit B1, B6, B12, biotin
Weakness
Vit C, B1, B6, B12, energy
Ataxia, decreased position and vibratory senses
Vit B1, B12
Tremor
Mg
Decreased tendon reflexes
Vit B1
Confabulation, disorientation
Vit B1, B12
Drowsiness, lethargy
Vit B1
Vit A, D
Depression
Vit B1, biotin, B12
![]()
Stay updated, free articles. Join our Telegram channel

Full access? Get Clinical Tree




 inch.
inch.