Epidemiology
Objectives
After reading this chapter, the student should be able to do the following:
1. Define epidemiology and describe its essential elements and approach.
2. Describe current and historical contexts of the development of the field of epidemiology.
5. Interpret basic epidemiologic measures of morbidity (disease) and mortality (death).
6. Discuss descriptive epidemiologic parameters of person, place, and time.
7. Describe the key features of common epidemiologic study designs.
8. Describe essential characteristics and methods of evaluating a screening program.
9. Identify the most common sources of bias in epidemiologic studies.
10. Evaluate epidemiologic research and apply findings to nursing practice.
Key Terms
agent, p. 264
analytic epidemiology, p. 256
attack rate, p. 262
bias, p. 279
case-control design, p. 277
case-control study, p. 277
case fatality rate (CFR), p. 263
cohort study, p. 275
cross-sectional study, p. 277
cumulative incidence rate, p. 260
descriptive epidemiology, p. 255
determinants, p. 255
distribution, p. 256
ecologic fallacy, p. 278
ecologic model, p. 265
ecological model, p. 257
ecologic study, p. 278
environment, p. 264
epidemic, p. 256
epidemiologic triangle, p. 264
epidemiology, p. 255
health, p. 255
host, p. 264
incidence proportion, p. 260
incidence rate, p. 260
levels of prevention, p. 265
mortality rates, p. 262
natural history of disease, p. 265
negative predictive value, p. 270
point epidemic, p. 274
popular epidemiology, p. 281
positive predictive value, p. 270
prevalence proportion, p. 261
proportion, p. 258
proportionate mortality ratio (PMR), p. 264
public health, p. 255
rate, p. 258
reliability, p. 269
risk, p. 259
screening, p. 268
secular trends, p. 274
sensitivity, p. 269
social epidemiology, p. 265
specificity, p. 269
surveillance, p. 270
validity, p. 269
web of causality, p. 265
—See Glossary for definitions
 DeAnne K. Hilfinger Messias, PhD, RN, FAAN
Dr. DeAnne K. Hilfinger Messias is an international community health nurse, educator, and researcher. She spent more than two decades in Brazil, where she directed a primary health care project on the lower Amazon, taught women’s health and community health nursing, and organized women’s health initiatives among poor urban populations. The primary focus of her current community-based participatory research is women’s work and health, immigrant women’s health, language access, and community empowerment. Dr. Messias was a fellow with the International Center for Health Leadership Development at the School of Public Health, University of Illinois at Chicago (2002–2004) and a Fulbright Senior Scholar in Global/Public Health at the Federal University of Goiás, Brazil, in 2005. She is a professor at the University of South Carolina, with a joint appointment in the College of Nursing and the Women’s and Gender Studies Program.
 Robert E. McKeown, PhD, FACE
Dr. Robert E. McKeown is an epidemiologist with doctoral degrees in epidemiology and theology. He is a fellow and President of the American College of Epidemiology (ACE) and has served as chair of the Epidemiology Section of the American Public Health Association and of the Ethics Committee of ACE. His research focuses on psychiatric epidemiology, especially in children and adolescents, perinatal epidemiology, women’s health, public health ethics, and public health and the faith community. He is professor of epidemiology and chair of the Department of Epidemiology and Biostatistics in the Arnold School of Public Health, University of South Carolina. He is also director of the Health Sciences Research Core and Interim Director of the Institute for Advancement of Health Care. He is a recipient of the Arnold School’s Excellence in Teaching Award, Faculty Service Award, Faculty Research Award, and Distinguished Alumni Award. In 2010 the Epidemiology Section of the American Public Health Association honored him with the Abraham Lilienfeld Award for excellence in teaching epidemiology across a career.
 Swann Arp Adams, PhD
Dr. Swann Arp Adams has over 14 years of experience in clinical epidemiology. She holds a PhD in epidemiology and an MS in biomedical sciences. Dr. Adams has previous experience in a variety of research fields including physical activity, bone marrow transplantation, diabetes, breast cancer, and cancer disparities. She is the Associate Director of the Cancer Prevention and Control Program and is an assistant professor with a joint appointment in the College of Nursing and the Department of Epidemiology and Biostatistics at the University of South Carolina. Her current research work focuses on reducing the burden of breast cancer mortality experienced by African-American women. Past honors include the Doctoral Achievement Award (2004) and the Gerry Sue Arnold Alumni Award (2008) from the Arnold School of Public Health of the University of South Carolina.
 Website
Epidemiology is considered the basic science of public health. Like public health nursing, epidemiology is a complex and continually evolving field with a common focus: the optimal health for all members of all communities, local and global. Nurses use epidemiologic frameworks, methods, and data to better understand factors that contribute to health and disease; to develop health promotion and disease prevention interventions and measures; to identify the presence of infectious agents in individuals and groups; to design, implement, and evaluate community health programs; and to develop and evaluate public health policies. Since nurses care for individuals and families, it is important that they consider the broader context in which these individuals live and the complex interplay of social and environmental factors that affect individual and collective well-being. Basic knowledge of epidemiology is essential to the practice of nursing across all settings and populations.
Definitions of Health and Public Health
Health is the core concept in nursing and epidemiology. In 1978 the World Health Organization (WHO) affirmed that “health, which is a state of complete physical, mental and social well-being, and not merely the absence of disease or infirmity, is a fundamental human right and the attainment of the highest possible level of health is a most important world-wide social goal” (WHO, 1978, p 1). As defined by the American Nurses Association (ANA), “Nursing is the protection, promotion, and optimization of health and abilities, prevention of illness and injury, alleviation of suffering through the diagnosis and treatment of human response, and advocacy in the care of individuals, families, communities, and populations” (ANA, 2004, p 7). This definition reflects the WHO goal and coincides with epidemiologic principles. A holistic approach to health, including the incorporation of epidemiologic principles, is particularly appropriate for nurses. Nurses incorporate concepts of health into their nursing practice on a daily basis.
Public health has been described as a system and social enterprise; a profession; a collection of methods, knowledge, and techniques; governmental health services, especially medical care for the poor and underserved; and the health status of the public (Turnock, 2008). In the early twentieth century, C.E.A. Winslow defined public health as “the science and art of preventing disease, prolonging life and promoting physical health and efficiency through organized community effort.” The Institute of Medicine (IOM) report The Future of Public Health drew upon Winslow’s definition in stating the mission of public health is to fulfill “society’s interest in assuring conditions in which people can be healthy” (IOM, 1988, p 40). This mission statement clearly indicates a societal interest in the health of all its members. More specifically, the mission of the public health enterprise is to ensure conditions that promote health and well-being. From both public health and nursing perspectives, health encompasses much more than the presence or absence of a physical disease or disability; it involves optimal functioning across a broad range of systems—physiological, somatic, psychological, social, and environmental. The authors of the 1988 IOM report caution that this broad view of health and the role of public health professionals and agencies forces “practitioners to make difficult choices about where to focus their energies and raises the possibility that public health could be so broadly defined so as to lose distinctive meaning” (IOM, 1988, p 40). Nurses are especially well suited to address this concern because of their holistic view of health and broad, interprofessional approach to intervention.
The practice of public health nursing is based on definitions of health and public health that go beyond a narrow biomedical model of individual health. Ensuring the public’s health includes delivery of specific services to individuals, but also includes the establishment and implementation of public policies and programs. Public health and public health nursing activities focus on community prevention, disease control, and personal and community health services. The IOM report, The Future of the Public’s Health in the 21st Century (IOM, 2002) highlights the importance of intersectoral collaborations to accomplish the mission of public health. There is further emphasis on an ecological approach to research and practice (discussed below). Interprofessional collaboration between nurses and other health professionals, including epidemiologists, is critical to efforts to create and sustain the conditions necessary for health promotion, health maintenance, and overall improvements in public health.
 HEALTHY PEOPLE 2020
Examples of new epidemiologic objectives included in Healthy People 2020
• C-9: Reduce invasive colorectal cancer.
• D-16: Increase prevention behaviors in persons at high risk for diabetes with pre-diabetes.
• FS-5: Increase the proportion of consumers who follow key food safety practices.
• HAI-2: Reduce invasive methicillin-resistant Staphylococcus aureus (MRSA) infections
From U. S. Department of Health and Human Services. Healthy People 2020. Available at www.healthypeople2020. Accessed January 14, 2011.
Definitions and Descriptions of Epidemiology
Epidemiology has been defined as “the study of the occurrence and distribution of health-related states or events in specified populations, including the study of the determinants influencing such states, and the application of this knowledge to control the health problems” (Porta, 2008, p 81). The word epidemiology comes from the Greek words epi (upon), demos (people), and logos (thought), and it originally referred to the spread of diseases of infectious origin. In the past century the definition and scope of epidemiology have broadened and now include the examination of the occurrence of chronic diseases, such as cancer and cardiovascular disease; mental health and health-related events, such as accidents, injuries, and violence; occupational and environmental exposures and their effects; and positive health states.
Epidemiologists investigate the distribution or patterns of health events in populations in order to characterize health outcomes in terms of what, who, where, when, how, and why: What is the outcome? Who is affected? Where are they? When do events occur? This focus is called descriptive epidemiology, because it seeks to describe the occurrence of a disease in terms of person, place, and time (Koepsell and Weiss, 2003). The how and why, or determinants of health events, are those factors, exposures, characteristics, behaviors, and contexts that determine (or influence) the patterns: How does it occur? Why are some affected more than others? Determinants may be individual, relational or social, communal, or environmental. This focus on investigation of causes and associations is called analytic epidemiology, in reference to the goal of understanding the etiology (or origins and causal factors) of disease; the broad consideration of many levels of potential determinants is called the ecological approach (IOM, 2002). The results of these investigations are used to guide or evaluate policies and programs that improve the health of the community. The differentiation between descriptive and analytic epidemiologic studies is not clear-cut: analytic studies rely on descriptive comparisons, and descriptive comparisons shed light on determinants.
 LINKING CONTENT TO PRACTICE
It is important that nurses understand the relationship between population health concepts and clinical practice. Within the field of epidemiology, the definition of population is not necessarily confined to large groups of people, such as the population of the United States. Population health concepts also apply to other types of groups, such as the collective group of clients at one clinical practice site. In this case, the clinical epidemiologic application of population health concepts is evident in questions such as: What are the factors that contribute to the health and illness issues among clients that I see in my clinic? Why do some of my clients fare better than others with the same disease conditions? Are there alternative clinical practices that might positively impact the health of my clients? All of these very clinical questions incorporate epidemiologic concepts of describing the burden of disease in a population, identifying and understanding determinants of health, and examining possible root causes of health outcomes. Two important nursing documents recently highlighted ways in which epidemiologic knowledge and skills are essential to nursing practice. The Council on Linkages Between Academia and Public Health Practice (2009) outlined essential analytic/assessment and public health science skills, and The Quad Council of Public Health Nursing Competencies (2009) provided details and examples of ways to implement these skill sets in nursing practice.
The first step in the epidemiologic process is to answer the “what” question by defining a health outcome. The case definition usually refers to cases of disease, but also may include instances of injuries, accidents, or even wellness (Koepsell and Weiss, 2003). Epidemiology has played an important role in the refinement of the case definition for acquired immunodeficiency syndrome (AIDS) and other emerging infectious diseases and in the development of more precise diagnostic criteria for psychiatric disorders. Epidemiologic methods are used to quantify the frequency of occurrence and characterize both the case group and the population from which they come. The aim is to describe the distribution (i.e., determine who has the disease and where and when the disease occurs) and to search for factors that explain the pattern or risk of occurrence (i.e., answer the questions of why and how the disease occurs).
An epidemic occurs when the rate of disease, injury, or other condition exceeds the usual (endemic) level of that condition. There is no specific threshold of incidence that indicates the existence of an epidemic. Because of the virtual eradication of smallpox globally, any occurrence of smallpox could be considered an epidemic. In contrast, given the high rates of ischemic heart disease in the United States, an increase of many cases would be needed before an epidemic was noted. Some would argue the current high rates compared with earlier periods already indicate an epidemic. The rising rates of obesity in the United States have led the Centers for Disease Control and Prevention (CDC) to consider adult obesity as an epidemic (CDC, 2008). Recent epidemiologic data show that 34% of U.S. adults 20 years of age and older—more than 70 million people—are obese. Approximately 19% of the population ages 6 to 12 and 17% of those 12 to 19 years old are considered overweight. Obesity contributes to increased risk for heart disease, hypertension, diabetes, arthritis-related disabilities, and certain cancers.
Epidemiology builds on and draws from other disciplines and methods, including clinical medicine and laboratory sciences, social sciences, quantitative methods (especially biostatistics), and public health policy, among others. Epidemiology differs from clinical medicine, which focuses on the diagnosis and treatment of disease in individuals. Epidemiology is the study of populations in order to: (1) monitor the health of the population, (2) understand the determinants of health and disease in communities, and (3) investigate and evaluate interventions to prevent disease and maintain health. Effective nursing practice bridges the disciplines of clinical medicine and epidemiology, incorporating a focus on both individual and collective strategies. Nurses working in the community provide clinical services to individuals as they also tend to the broader context in which these individuals live and the complex interplay of social and environmental factors that affect their well-being. Nurses apply epidemiologic methods in their daily practice, as they note trends in specific illnesses (e.g., sexually transmitted infections) or conditions (e.g., accidents) and in designing, implementing, and evaluating community health programs.
Historical Perspectives
The roots of epidemiology have been traced to ancient Greece (Merrill and Timmreck, 2006). In the fourth century BC, Hippocrates maintained that to understand health and disease in a community, one should look to geographic and climatic factors, the seasons of the year, the food and water consumed, and the habits and behaviors of the people. Yet modern epidemiology did not emerge until the nineteenth century and it was only in the twentieth century that the field developed as a discipline with a distinctive identity (Susser, 1985).
Two refinements in research methods in the eighteenth and nineteenth centuries were critical for the formation of epidemiologic methods: (1) use of a comparison group, and (2) the development of quantitative techniques (numerical measurements, or counts). One of the most famous studies using a comparison group is the pivotal mid-nineteenth century investigation of cholera by John Snow, who is often credited with being the “father of epidemiology” (Merrill and Timmreck, 2006). By mapping cases that clustered around a single public water pump in one London cholera outbreak, Snow demonstrated a connection between water supply and cholera. He later observed that cholera rates were higher among households supplied by water companies whose water intakes were downstream from the city than among households whose water came from further upstream, where it was subject to less contamination (Table 12-1). Snow realized that his investigation was an example of what epidemiologists call a natural experiment and his findings added credibility to his argument that foul water was the vehicle for transmission of the agent that caused cholera (Rothman, 2002; Koepsell and Weiss, 2003).
TABLE 12-1
HOUSEHOLD CHOLERA DEATH RATES BY SOURCE OF WATER SUPPLY IN JOHN SNOW’S 1853 INVESTIGATION
| COMPANY | NO. OF HOUSES | DEATHS FROM CHOLERA | DEATHS PER 10,000 HOUSEHOLDS |
| Southwark and Vauxhall | 40,046 | 1263 | 315 |
| Lambeth | 26,107 | 98 | 37 |
| Rest of London | 256,423 | 1422 | 59 |
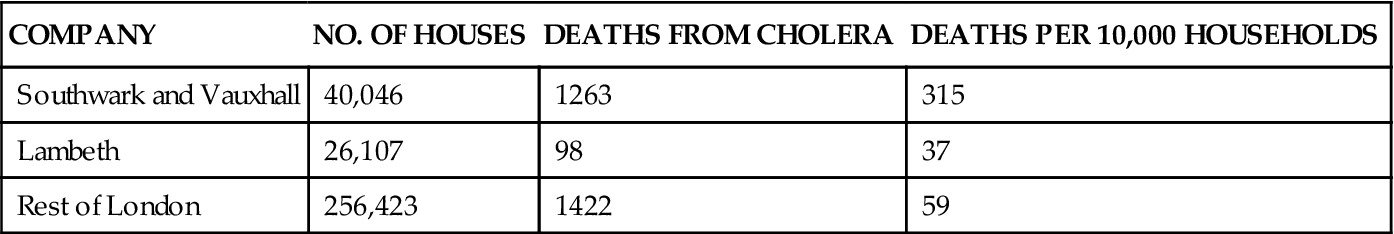
From Snow J: On the mode of communication of cholera. In Snow on cholera, New York, 1855, The Commonwealth Fund.
Development and application of epidemiologic methods in the twentieth century were stimulated by dramatic changes in society and population dynamics (the combined effects of birth rates, death rates, life expectancy, and patterns of illness and causes of death) (McKeown, 2009). Contributing factors included improved nutrition, new vaccines, better sanitation, the advent of antibiotics and chemotherapies, and declining infant and child mortality and birth rates. Societal changes also resulted from large-scale events including the Great Depression and World War II, followed by a rising standard of living for many but continued deep poverty for others. These changes led to increasing longevity and significant shifts in the age distribution of the population, resulting in increases in age-related diseases, such as coronary heart disease (CHD), stroke, cancer, and senile dementia (Susser, 1985; IOM, 2002). However, disparities remain among population subgroups in life expectancy and risk of many acute and chronic diseases. Figure 12-1 shows the 10 leading causes of death in the United States in 1900, 1950, and 2006, with the percentage of all deaths attributed to each cause. The top three causes of death have not changed since 1950, whereas the composition of the remaining seven leading causes has changed.
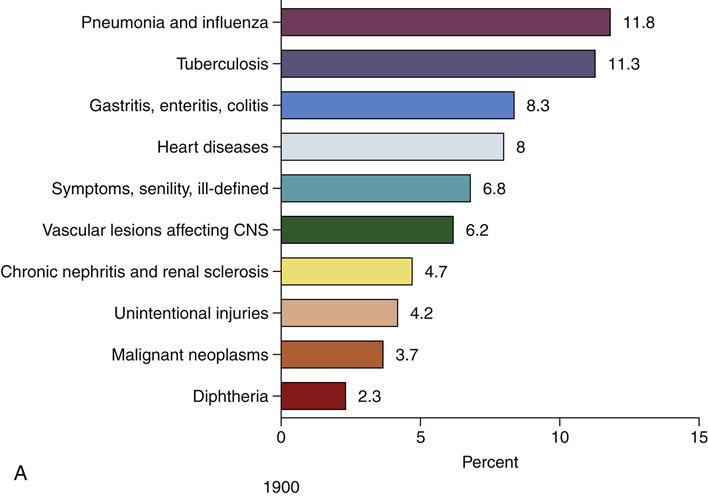
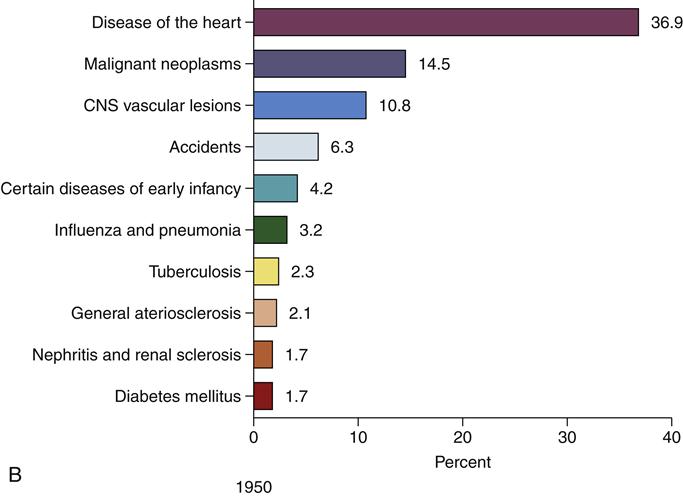
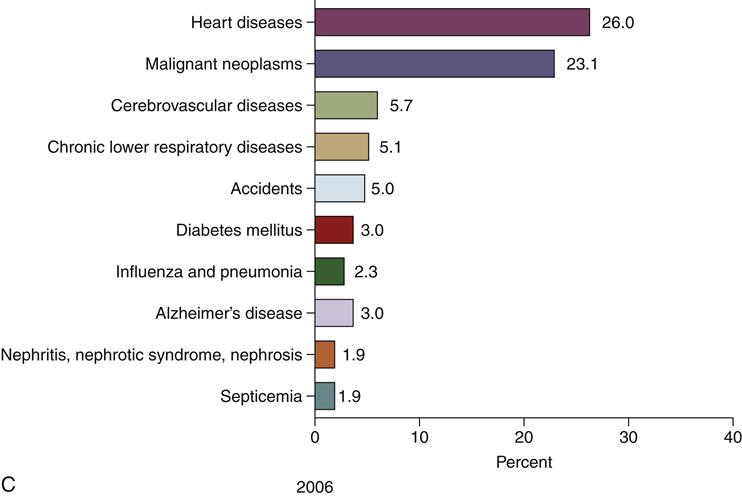
(B, Data from Anderson RN: Deaths: leading causes for 2000, Natl Vital Stat Rep 50:16, 2002; Brownson RC, Remington PL, Davis JR: Chronic disease epidemiology and control, ed 2, Washington, DC, 1998, APHA; U.S. Department of Health, Education, and Welfare: Vital statistics of the United States: 1950, vol 1, Washington, DC, 1954, USDHEW, Public Health Service.)Figure 12-1, cont’d
Ten leading causes of death as a percentage of all deaths, United States. C, Data from Heron MP, Hoyert DL, Murphy SL, et al: Deaths: Final data for 2006. Natl Vital Stat Rep, vol 57, no 14. Hyattsville, MD, 2009, National Center for Health Statistics; Martin JA, Hamilton BE, Sutton PD, et al: Births, final data for 2006, Natl Vital Stat Rep 57:7, 2009.)
With the increase in chronic disease, epidemiologists realized the necessity of looking beyond single agents (e.g., the infectious agent that causes cholera) toward a multifactorial etiology (i.e., many factors or combinations and levels of factors contributing to disease, such as the complex set of factors that cause cardiovascular disease), referred to as an ecological model (IOM, 2002). Researchers and practitioners also recognized the contribution of behavioral and environmental causes to some chronic conditions formerly considered to be degenerative diseases of aging. This understanding prompted new thinking about the possibility of preventing or delaying the onset of certain chronic diseases (Susser, 1985). In addition, the development of genetic and molecular techniques (such as genetic markers for increased risk of breast cancer and sophisticated tests for antibodies to infectious agents or for other biological markers of exposures to environmental toxins, such as lead or pesticides) has increased the ability to identify and classify persons in terms of exposures or inherent susceptibility to disease.
Basic Concepts in Epidemiology
Measures of Morbidity and Mortality
Proportions, Rates, and Risk
The distribution of health states and events is an important focus of epidemiology. Because people differ in their probability or risk of disease, a primary concern is the identification of how they differ. Today, epidemiologists use tools such as geographic information systems (GISs) to study health-related events to identify disease distribution patterns, similar to John Snow’s mapping of cholera cases in London in the nineteenth century. However, mapping cases is limited in what it can reveal. A higher number of cases may simply be the result of a larger population with more people who are potential cases, or of a longer period of observation. Any description of disease patterns should take into account the size of the population at risk for the disease. That is, we should look not only at the numerator (the number of cases), but also at the denominator (the number of people in the population at risk) and at the length of time the population was observed. For example, 50 cases of influenza in a month might be viewed as a serious epidemic in a population of 250 but would indicate a low rate in a population of 250,000. On the other hand, even in a small population, one might observe 50 cases over a period of several years. Using rates and proportions instead of simple counts of cases takes the size of the population at risk into account (Koepsell and Weiss, 2003). How time is considered differs according to the measure being used.
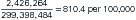
Epidemiologic studies rely on proportions and rates. A proportion is a type of ratio in which the denominator includes the numerator. For example, in 2006 there were 2,426,264 deaths recorded in the United States, of which 631,636 were reported as caused by heart disease; so the proportion of deaths attributable to heart disease in 2006 was 631,636/2,426,264 = 0.260, or 26.0%. Because the numerator must be included in the denominator, proportions can range from 0 to 1. Proportions are often multiplied by 100 and expressed as a percent, literally meaning per 100. In public health statistics, however, if the proportion is very small, we use a larger multiplier to avoid small fractions; thus the proportion may be expressed as a number per 1000 or per 100,000.
A rate is a measure of the frequency of a health event in “a defined population, usually in a specified period of time” (Porta, 2008, p 207). A rate is a ratio, but it is not a proportion because the denominator is a function of both the population size and the dimension of time, whereas the numerator is the number of events (Rothman, 2002; Koepsell and Weiss, 2003; Gordis, 2009). Furthermore, depending on the units of time and the frequency of events, a rate may exceed 1. As its name suggests, a rate is a measure of how rapidly something is happening: how rapidly a disease is developing in a population or how rapidly people are dying. Conceptually, a rate is the instantaneous change in a continuous process. Notice the use of the words event and happening. Rates deal with change over time, as individuals move from one state of being to another (e.g., from well to ill, alive to dead, or ill to cured). In observing a population over time to observe such changes in status, we typically exclude from the population being followed those persons who have already experienced the event.
Using the same health event of death from heart disease detailed above, we can also compute a rate. To calculate the death rate, the denominator will be the number of individuals in the population during the year in which the deaths occurred, rather than total number of deaths. For example, in 2006, the U.S. population estimate was 299,398,484. Since rates are commonly expressed per 100,000 or per 1000, we will divide this total population figure by 100,000, to get 2993.98484. The resulting calculation of the rate of death from heart disease in the U.S. in 2006 would be 631,636/2993.98484 = 211 per 100,000.
Risk refers to the probability that an event will occur within a specified time period. A population at risk is the population of persons for whom there is some finite probability (even if small) of that event. For example, although the risk of breast cancer in men is small, a few men do develop breast cancer and therefore could be considered part of the population at risk. There are some outcomes for which certain people would never be at risk (e.g., men cannot be at risk of ovarian cancer, nor can women be at risk of testicular cancer). A high-risk population, on the other hand, would include those persons who, because of exposure, lifestyle, family history, social or environmental context, or other factors, are at greater risk for disease than the population at large. Although anyone may be susceptible to HIV infection, the degree of susceptibility does vary. Everyone in the population is at risk for HIV and AIDS, but persons who have multiple sexual partners without adequate protection or who use intravenous drugs are in the high-risk population for HIV infection. However, others who do not fit these categories may unknowingly be at high risk. An example is women who consider themselves to be in monogamous relationships but are unaware that their partners have sexual relations with other women or men. As proportions, risk estimates have no dimensions, but they are a function of the length of time of observation. Given a continuous rate, increasing time will mean that a larger proportion of the population will eventually become ill.
Epidemiologists and other health professionals are interested in measures of morbidity, especially incidence proportions, incidence rates, and prevalence proportions (Gordis, 2009). These measures provide information about the risk of disease, the rate of disease development, and the levels of existing disease in a population, respectively.
Measures of Incidence
Measures of incidence reflect the number of new cases or events in a population at risk during a specified time. An incidence rate quantifies the rate of development of new cases in a population at risk, whereas an incidence proportion indicates the proportion of the population at risk who experience the event over some period of time, for example, the proportion of the population who develop influenza during a given year (Rothman, 2002). The population at risk is considered to be persons without the event or outcome of interest but who are at risk of experiencing it. Note that existing (or prevalent) cases are excluded from the population at risk for this calculation, since they already have the condition and are no longer at risk of developing it. (Calculations of incidence measures for events that can recur are more complicated.) The incidence proportion is also referred to as the cumulative incidence rate (and erroneously simply as the incidence rate) because it reflects the cumulative effect of the incidence rate over the time period, whether it is a month, a year, or several years. A constant incidence rate operating over a period of time results in an increasing proportion of the population who is affected, that is, the incidence rate may stay constant while the cumulative incidence rate increases with time. An incidence proportion can be interpreted as an estimate of risk of disease in that population over that period—that is, as a probability with limits from 0 to 1. The risk of disease is a function of both the rate of new disease development and the length of time the population is at risk. The interpretation can be for an individual (i.e., the probability that the person will become ill) or for a population (i.e., the proportion of a population expected to become ill over the specified period). In epidemiology, we often calculate proportions on the basis of population frequencies. These frequencies are then translated into personal risk statements for people representative of the population on which the estimates are based.
As an example, suppose a local health department and community hospital have a joint comprehensive screening program in a specific geographic area characterized by overcrowded housing, low-income families, limited access to services, and underutilization of preventive health practices. The outreach program includes conducting health histories and physical examinations; tuberculin skin tests with follow-up chest radiography where indicated; cardiovascular, glaucoma, and diabetes screening; and mammography for women and prostate screening for men more than 45 years of age. Of 8000 women screened through the program, 35 were previously diagnosed with breast cancer; through the screening efforts, 20 with no prior breast cancer diagnosis are identified as having cancer of the breast. Subsequently, the remaining 7945 women in whom no breast cancer was detected could be followed over the next 5 years to identify the number of new cases of breast cancer detected. Assuming no losses to follow-up (e.g., moved away or died from other causes), if 44 women were diagnosed over the 5-year period, the 5-year incidence proportion of breast cancer in this population would be as follows:
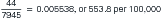
Note the multiplication by 100,000, so that the number of cases is expressed as per 100,000 women. An incidence proportion estimates the risk of developing the disease in that population during that time. Also, as a proportion, each event in the numerator must be represented in the denominator, and only those persons at risk of the event counted in the numerator may be included in the denominator.
We estimate incidence rates by counting events relative to the total amount of time that persons in a population are observed (person-time). This measure is called incidence density. For many calculations, it is generally assumed that rates are constant over the period of observation. The numerator consists of the number of new events. In calculating the person-time denominator, we count the amount of time each person contributes from the time that observation of that person begins until the person: (1) experiences the event, (2) is lost to follow-up, dies from some other cause, or otherwise is no longer at risk, or (3) reaches the end of observation. Incidence density is an estimate of the true instantaneous rate (or hazard) of the event. It is an indication of how rapidly a disease is developing in a population. Conceptually, a rate is the instantaneous change in a continuous process. Note that incidence density does have dimensions; it is not bounded by 1 (as risk is); its value depends on the units of time chosen. It may be interpreted as the reciprocal of the average time until disease onset, assuming there are no competing risks and there is a fixed or steady-state population with complete follow-up (Rothman, 2002).
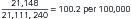
To continue the previous example, suppose the 7945 women we follow for 5 years accumulate a total of 39,615 person-years of observation. (Person-time, such as person-years, is the sum of the time observed for all the people under observation.) Remember, the assumption was that there was no loss to follow-up or deaths from other causes. Note that the total person-time is not equivalent to 5 × 7945 (or 39,725), because we stop counting time for the 44 women who developed breast cancer at the time of diagnosis. (Note that determining the exact time of disease onset is often a problem in epidemiologic studies. The use of time of diagnosis may be biased because diagnosis occurs at different stages of disease in different populations.) Consequently, the incidence rate for breast cancer diagnosis in this population, after 5 years of observation, would be estimated as 44 newly diagnosed cases per 39,615 person-years of observation, or 0.0011107; we could express this as 11.1 cases per 10,000 person-years.
We are often concerned about the risk—that is, the probability of disease occurring over some defined period of time, such as a year or several years. Earlier we estimated the risk directly as the number of new cases over a 5-year period in a population at risk. That was straightforward because we had no losses, and observation began at the same time for all the women. A more common situation is that people come under observation at different times and there are losses attributable to attrition or competing risks (i.e., other events or deaths). We can handle those easily by counting the amount of time that is observed and calculating the incidence density as an estimate of the incidence rate. By calculating the incidence rate of an event (e.g., diagnosis of breast cancer) in a population, we then can estimate the risk of the event in that population, both in terms of the expected proportion of the population who would experience the event and in terms of the risk to a representative member of the population. When certain assumptions are met, primarily a constant rate, the average incidence density over a period of time is related to the cumulative risk for that period by the following equation:

where 1 is the mean per-person-time incidence rate, T is the period of observation in the same units of time, and e is the base of the natural logarithm. Again, to return to the example, suppose we observed the 44 new cases in 39,615 person-years of follow-up, but there were losses to follow-up, and women entered and left the population at different times. Assuming that the rate of new breast cancer is fairly constant over that 5-year period, the cumulative risk over 5 years is estimated as follows:

which is the same as the risk we calculated for the simpler situation.
Note that the rate used is not the incidence proportion but the mean incidence densities for intervals of time comprising the total period, and the formula assumes that the rates do not vary over the period. Also, risk is a probability whose value depends on both the incidence rate and the period of observation but whose range is restricted to between 0 and 1. For example, the longer a person is at risk for an event, the greater the probability (or risk) the event will occur at some point. If the risk of being hit crossing the street is 0.01, then the risk that I will be hit at some point if I cross the street 100 times is very much greater than if I cross the street only once. The value of incidence density, on the other hand, does depend on the units of time and, because it is not a probability, is not restricted to the 0 to 1 range. Furthermore, when the incidence rate is low or the period of observation short—so that, relative to the size of the population, few people are removed from the population at risk by disease—the product of the per-person-time rate and the period of observation approximates the risk for the period (Rothman, 2002; Szklo and Nieto, 2007).
A ratio can be used as an approximation of a risk. For example, the infant mortality rate (IMR) is the number of deaths in infants less than 1 year of age that occur in a given year divided by the number of live births in that same year. The IMR approximates the risk of death in the first year of life for live-born infants in a specific year. Some of the infants who die that year were born in the previous calendar year, and some of the infants born that year may die in the following calendar year before their first birthday. However, because about two thirds of infant deaths occur within the first 28 days of life, the number of infants in the numerator (deaths in a given year) but not in the denominator (live births in that same year) will be small. It can be assumed that current year deaths from the previous year’s cohort approximately equal the deaths from the current year’s cohort occurring in the following year. Although technically a ratio, this is an approximation to the true proportion and, therefore, an estimate of the risk. In some publications, readers may notice that the rate of infant death is not equivalent to the number of deaths divided by the number of live births. These rates take into account the changes in the rate of death over the first year of life—that is, they use a person-time denominator.
Prevalence Proportion
The prevalence proportion is a measure of existing disease in a population at a particular time (i.e., the number of existing cases divided by the current population). One can also calculate the prevalence of a specific risk factor or exposure. When used alone, the term prevalence typically refers to the prevalence proportion, although the term is sometimes used to refer to the count of existing cases (i.e., the numerator of the prevalence proportion). In the breast cancer example described previously, suppose the screening program discovered 35 of the 8000 women screened had previously been diagnosed with breast cancer, and 20 women with no history of breast cancer were diagnosed as a result of the screening. The prevalence proportion of current and past breast cancer events in this population of women would be as follows:
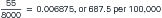
A prevalence proportion is not an estimate of the risk of developing disease because it is a function of both the rate at which new cases of the disease develop and how long those cases remain in the population. In this example, the prevalence of breast cancer in this population of women is a function of how many new cases develop and how long women live after breast cancer diagnosis. One might see a fairly constant prevalence, for example, if improved survival after diagnosis was offset by an increasing incidence rate. The duration of a disease is affected by case fatality and cure. (For simplicity, in this example, women with a history of the disease are counted in the prevalence proportion even though they may have been cured.) A disease with a short duration (e.g., an intestinal virus) may not have a high prevalence proportion even if the rate of new cases is high, because cases do not accumulate (see Point Epidemic later in this chapter). A disease with a long course (e.g., Crohn’s disease) will have a higher prevalence proportion than a rapidly fatal disease that has the same rate of new cases.
Incidence and Prevalence Compared
The prevalence proportion measures existing cases of disease. The prevalence odds (P/[1 − P]) are roughly proportional to the incidence rate multiplied by the average duration of disease (Rothman, 2002). The prevalence proportion is, therefore, affected by factors that influence risk (incidence) and by factors that influence survival or recovery (duration). For that reason, prevalence measures are less useful when looking for factors related to disease etiology. Because prevalence proportions reflect duration in addition to the risk of getting the disease, it is difficult to sort out what factors are related to risk and what factors are related to survival or recovery. In mathematical notation:

where P = prevalence, I = incidence rate, and D = average duration.
For example, the 5-year survival rate for breast cancer is about 85%, but the 5-year survival rate for lung cancer in women is only about 15%. Even if the incidence rates of breast and lung cancer were the same in women (and they are not), the prevalence proportions would differ because, on average, women live longer with breast cancer (i.e., it has a longer duration). Incidence rates and incidence proportions, on the other hand, are the measure of choice to study etiology because incidence is affected only by factors related to the risk of developing disease and not to survival or cure. Prevalence proportions are useful in planning health care services because they indicate the level of disease existing in the population and therefore the size of the population in need of services. At the level of a local health department, epidemiologists and nurses would rely on both incidence and prevalence data in planning services focused on the prevention and control of tuberculosis (TB). They would examine the existing level of TB within the community (prevalence) to plan services and direct prevention and control measures, and they would take into consideration the rate of new TB cases (incidence) to study risk factors and evaluate the effectiveness of prevention and control programs.
Attack Rate
Another measure of morbidity, often used in infectious disease investigations, is the attack rate. This form of incidence proportion is defined as the proportion of persons who are exposed to an agent and develop the disease. Attack rates are often specific to an exposure; food-specific attack rates, for example, are the proportion of persons becoming ill after eating a specific food item.
Mortality Rates
Mortality rates are key epidemiologic indicators of interest to nurses (Table 12-2). Although measures of mortality reflect serious health problems and changing patterns of disease, they are limited in their usefulness. Mortality rates are informative only for fatal diseases and do not provide direct information about either the level of existing disease in the population or the risk of contracting any particular disease. Also, it is not uncommon for a person who has one disease (e.g., prostate cancer) to die from a different cause (e.g., stroke).
TABLE 12-2


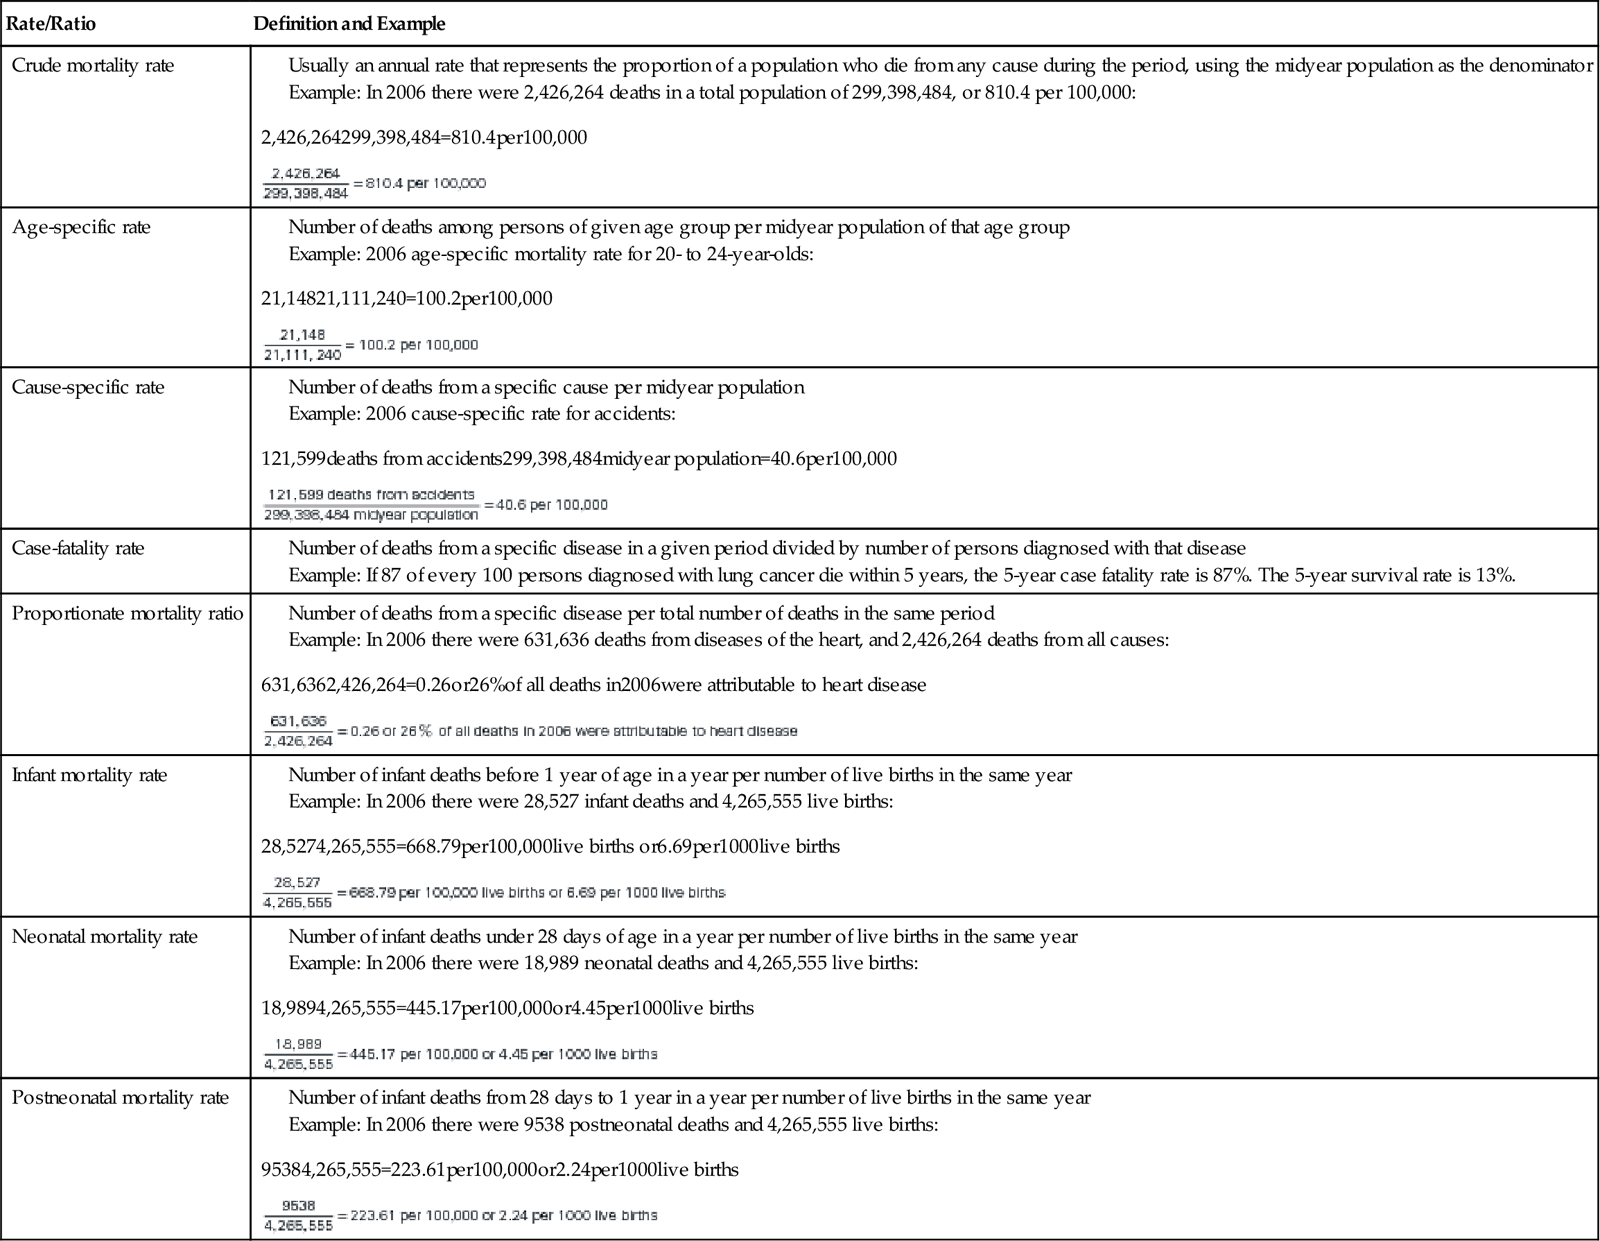
From Heron MP, Hoyert DL, Murphy SL, et al: Deaths: Final data for 2006, Natl Vital Stat Rep 57(14), Hyattsville, MD, National Center for Health Statistics, 2009; Martin JA, Hamilton BE, Sutton PD, et al: Births: Final data for 2006, Natl Vital Stat Rep 57(7), Hyattsville, MD, National Center for Health Statistics, 2009.
Stay updated, free articles. Join our Telegram channel

Full access? Get Clinical Tree


