Chapter 16 Epidemiology
After reading this chapter, you will:
Notification and registration of births
After the arrival of a new baby, it is a legal requirement to register the birth within 42 days. Registration is the responsibility of the child’s parents. If the parents fail to register the birth, the duty falls on the occupier of the premises in which the birth took place, usually the midwife or another person of authority, such as a social worker. All midwives must be fully conversant with the legal registration requirements (DPW 2008) (see website).
Facts and figures surrounding fertility and birth rates
General fertility rate
The general fertility rate (GFR) is described as the number of live births per 1000 women aged 15–44. In England and Wales, the GFR for 2007 was 62.0, an increase compared with 2006, when the GFR was 60.2 (ONS 2008a).
In 2007, there were increases in fertility rates for all age groups, except for women aged under 20, where the fertility rate fell compared with 2006. The highest percentage increase (6.0%) was observed for women aged 40 and over. For this age group, the fertility rate has risen steadily from 7.3 live births per 1000 women aged 40 and over in 1997 to 12.1 live births per 1000 in 2007. Hence, in the last decade, the number of live births to mothers aged 40 and over has nearly doubled from 12,914 in 1997 to 25,350 in 2007 (ONS 2008a).
Total fertility rate
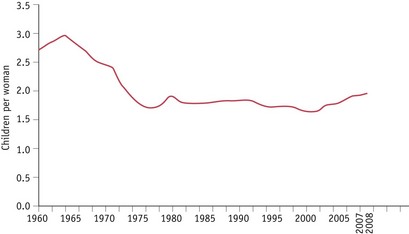
The total fertility rate (TFR) is the average number of children a group of women would have if they experienced the age-specific fertility rates of the calendar year in question throughout their childbearing lifespan. The TFR in the UK reached 1.95 children per woman in 2008 (ONS 2008b) (Fig. 16.1). UK fertility has not been this high since 1980.
The UK TFR has increased each year since 2001, when it had dropped to a record low of 1.63. The current level of fertility is relatively high compared with that seen during the 1980s and 1990s. However, the TFR was considerably higher in the 1960s, peaking at 2.95 children per woman in 1964, the height of the ‘baby boom’ (ONS 2008c). Whereas two children remains the most common family size in England and Wales, an increase in childlessness among women of childbearing age has also been noted in recent years.
Birth rate
The birth rate is the number of registered live births per 1000 population, and following a decline in the 1990s is now increasing steadily from the rate in 2002 of 11.3 to a rate of 12.8 in 2007 (ONS 2008a).
Because fertility is currently rising faster among women over 30, the average age of childbearing has continued to increase slowly. The mean age for giving birth in the UK was 29.3 years in 2007, compared with 28.6 years in 2001 (ONS 2008a). This could explain, in part, the increasing number of women seeking treatment for infertility, as general fertility decreases with age. Women of 35 are known to be on average half as fertile as those of 31 (Challoner 1999).
Teenage pregnancy rate
Teenage pregnancy is defined as pregnancy experienced up to and including the age of 19 years, and is frequently further divided into pregnancies up to 15 years of age, and from 15 to 19 years. In 1998, England and Wales were reported to have the highest teenage birth rate in Europe when the birth rate of women aged 15 to 19 years was 30.6 per 1000 women in that age group (UNICEF 2001). Among the developed nations, only the United States had a higher teenage birth rate of 52.1 births per 1000. In response, the British Government introduced a range of measures including the Teenage Pregnancy Strategy in 2000, with the aim of reducing the teenage pregnancy rate by half by 2010, and producing a firm downward trend in the conception rate in the under-16 years age group. Perinatal mortality and morbidity in young mothers is higher than average, so concerted attempts by Government to improve sex education and make family planning services more accessible to young people have been included in measures to attempt to reduce the teenage conception rate.
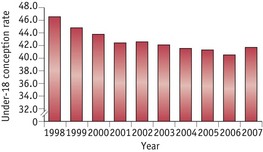
Following the introduction of these measures, the ONS figures show teenage pregnancy rates continuing to fall (Fig. 16.2) with a reduction in both the under-18 and the under-16 rates during 2006:
Fetal and infant deaths
Stillbirths
A baby delivered with no signs of life known to have died at 24 completed weeks of pregnancy onwards (CEMACH 2009).
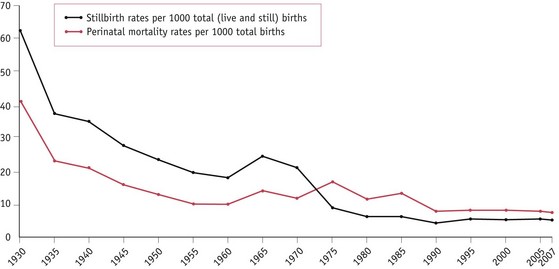
The stillbirth rate is the number of stillbirths registered during the year per 1000 registered total (live and still) births. In contrast to neonatal mortality, there has been no significant decline in the stillbirth rate since 2000. The stillbirth rate was 5.4 per 1000 total births in 2000 and 5.2 per 1000 in 2007 (Fig. 16.3). The findings from the latest CEMACH report in 2009 suggest that demographic factors known to be associated with stillbirths, such as, obesity, ethnicity, deprivation and maternal age, may be contributing to this lack of progress. In addition, over one-third (40%) of unexplained stillbirths had a birth weight below the 10th centile for gestation and a quarter (26%) of these were below the 3rd centile. This suggests that being small for gestational age may be an important contributor.
Perinatal deaths
The perinatal mortality rate in England and Wales fell from 19.3 per 1000 in 1975 to 7.7 in 2007 (CEMACH 2009) (Fig. 16.3). As with stillbirth, maternal age, obesity, social deprivation and ethnicity remain important risk factors for perinatal mortality.
Neonatal deaths
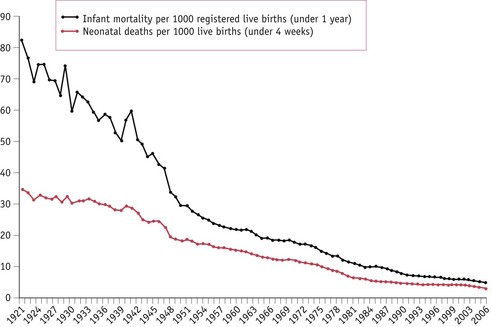
The neonatal mortality rate, like the other mortality rates, is declining in England and Wales and fell from 11.0 per 1000 livebirths in 1975 to 3.3 in 2007 (Fig. 16.4). The majority of neonatal deaths occur in the first day or two after birth, which closely relates the death of the baby to gestational age, labour and delivery.
The causes of perinatal and neonatal deaths occurring in the first week of life are obviously related and may also be responsible for later neonatal deaths; however, other factors, such as infection, may be more strongly implicated in later deaths. The reasons for reduction in the neonatal mortality rate are similar to those responsible for the decline in perinatal mortality (CEMACH 2009).
Infant mortality
There has been a remarkable decline in infant deaths in England and Wales, from 140 per 1000 live births in 1900 to 5.0 per 1000 in 2006 (ONS 2008d) (Fig. 16.4).
The main causes of later infant deaths include:
Predisposing causes and risk factors for fetal, perinatal and infant death
Social factors
Mortality rates for all categories of death are higher in socioeconomic groups IV and V and the gap between the social classes is widening rather than decreasing (WHO 2005). CEMACH (2009) reported that just over one-third of all stillbirths and neonatal deaths were born to mothers in the most deprived quintiles (compared with the expected 20%). Stillbirth and neonatal mortality rates for mothers resident in the most deprived areas were 1.8 times higher than for those in the least deprived area. Social class differences in access to social and medical care also continue, with women from lower socioeconomic and ethnic minority groups not fully utilizing the services available. This may partly account for the reasons why, when compared with women of white ethnicity, the ethnic-specific mortality rates showed significantly higher stillbirth, perinatal and neonatal death rates for women of black ethnicity (2.7, 2.5 and 2.2 times higher respectively) and Asian ethnicity (2.0, 2.0 and 2.0 times higher respectively) (CEMACH 2009). Low birthweight remains more prevalent in lower socioeconomic and certain ethnic groups. Even if a low birthweight baby survives the perinatal period, recent studies indicate that those who are small or disproportionate at birth, or who have altered placental growth. are at an increased risk of developing coronary heart disease, hypertension and diabetes during adult life (Godrey & Barker 1995). The perinatal mortality rate for babies of unsupported mothers is nearly double that of women who are in a supported relationship.
Biological and lifestyle factors
Characteristics such as short stature, obesity and maternal age all increase risk. CEMACH (2009) reported that mothers aged less than 20 and above 40 had the highest rates of stillbirth (5.6 and 7.7 per 1000 total births respectively), the highest rates of perinatal deaths (8.9 and 10.3 per 1000 total births respectively) and the highest rates of neonatal deaths (4.4 and 3.4 per 1000 live births respectively).
The impact of obesity on pregnancy outcomes is a growing concern internationally. CEMACH (2009) reported that of the women who had a stillbirth and a recorded body mass index (BMI), 26% (761/2924) were obese (BMI >30), and for neonatal deaths, 22% (356/1609) were obese. Unfortunately, there are no national denominator data available for obese pregnant women in the UK that would provide an estimation of this increased risk.
CEMACH reported that work has commenced on a UK project on obesity in pregnancy which will provide demographic and clinical information on a sample of women with obesity in pregnancy (CEMACH 2008).


