Chapter 10
Clarifying Measurement and Data Collection in Quantitative Research
After completing this chapter, you should be able to:
1. Describe measurement theory and its relevant concepts of directness of measurement, levels of measurement, measurement error, reliability, and validity.
2. Determine the levels of measurement—nominal, ordinal, interval, and ratio—achieved by measurement methods in published studies.
3. Identify possible sources of measurement error in published studies.
4. Critically appraise the reliability and validity of measurement methods in published studies.
5. Critically appraise the accuracy, precision, and error of physiological measures used in studies.
6. Critically appraise the sensitivity, specificity, and likelihood ratios of diagnostic tests.
7. Critically appraise the measurement approaches—physiological measures, observations, interviews, questionnaires, and scales—used in published studies.
8. Critically appraise the use of existing databases in studies.
9. Critically appraise the data collection section in published studies.
Accuracy of a screening test, p. 295
Alternate forms reliability, p. 290
Error in physiological measures, p. 293
Evidence of validity from contrasting groups, p. 291
Evidence of validity from convergence, p. 291
Evidence of validity from divergence, p. 291
Indirect measures, or indicators, p. 283
Interrater reliability, p. 290
Interval-level measurement, p. 285
Negative likelihood ratio, p. 298
Nominal-level measurement, p. 284
Observational measurement, p. 300
Ordinal-level measurement, p. 284
Physiological measures, p. 292
Positive likelihood ratio, p. 298
Random measurement error, p. 287
Ratio-level measurement, p. 286
Structured observational measurement, p. 300
Systematic measurement error, p. 287
Test-retest reliability, p. 289
Unstructured interview, p. 302
Unstructured observations, p. 300
Measurement is a very important part of the quantitative research process. When quality measurement methods are used in a study, it improves the accuracy or validity of study outcomes or findings. Measurement is the process of assigning numbers or values to individuals’ health status, objects, events, or situations using a set of rules (Kaplan, 1963). For example, we measure a patient’s blood pressure (BP) using a measurement method such as a stethoscope, cuff, and sphygmomanometer. Then a number or value is assigned to that patient’s BP, such as 120/80 mm Hg. In research, variables are measured with the best possible measurement method available to produce trustworthy data that can be used in statistical analyses. Trustworthy data are essential if a study is to produce useful findings to guide nursing practice (Brown, 2014; Fawcett & Garity, 2009).
Concepts of Measurement Theory
Measurement theory guides the development and use of measurement methods or tools in research. Measurement theory was developed many years ago by mathematicians, statisticians, and other scholars and includes rules that guide how things are measured (Kaplan, 1963). These rules allow individuals to be consistent in how they perform measurements; thus a measurement method used by one person will consistently produce similar results when used by another person. This section discusses some of the basic concepts and rules of measurement theory, including directness of measurement, levels of measurement, measurement error, reliability, and validity.
Directness of Measurement
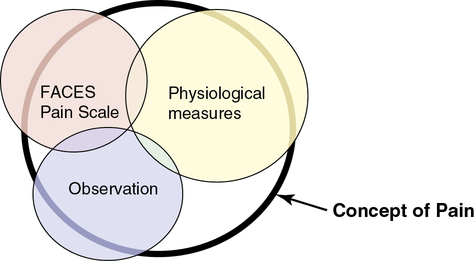
However, in many cases in nursing, the thing to be measured is not a concrete object but an abstract idea, characteristic, or concept such as pain, stress, caring, coping, depression, anxiety, and adherence. Researchers cannot directly measure an abstract idea, but they can capture some of its elements in their measurements, which are referred to as indirect measures or indicators of the concepts. Rarely, if ever, can a single measurement strategy measure all aspects of an abstract concept. Therefore multiple measurement methods or indicators are needed, and even then they cannot be expected to measure all elements of an abstract concept. For example, multiple measurement methods might be used to describe pain in a study, which decreases the measurement error and increases the understanding of pain. The measurement methods of pain might include the FACES Pain Scale, observation (rubbing and/or guarding the area that hurts, facial grimacing, and crying), and physiological measures, such as pulse and blood pressure. Figure 10-1 demonstrates multiple measures of the concept of pain and demonstrates how having more measurement methods increases the understanding of the concept. The bold, black-rimmed largest circle represents the concept of pain and the pale-colored smaller circles represent the measurement methods. A larger circle is represented by physiological measures indicating these measures (pulse, blood pressure, and respirations) add more to the objective measurement of pain. Even with three different types of measurement methods being used, the entire concept of pain is not completely measured, as indicated by the white areas within the black-rimmed large circle.
Levels of Measurement
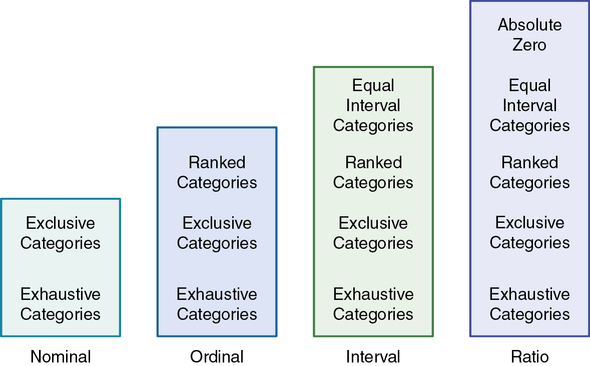
Various measurement methods produce data that are at different levels of measurement. The traditional levels of measurement were developed by Stevens (1946), who organized the rules for assigning numbers to objects so that a hierarchy in measurement was established. The levels of measurement, from low to high, are nominal, ordinal, interval, and ratio.
Nominal-Level Measurement
Nominal-level measurement is the lowest of the four measurement categories. It is used when data can be organized into categories of a defined property but the categories cannot be rank-ordered. For example, you may decide to categorize potential study subjects by diagnosis. However, the category “kidney stone,” for example, cannot be rated higher than the category “gastric ulcer”; similarly, across categories, “ovarian cyst” is no closer to “kidney stone” than to “gastric ulcer.” The categories differ in quality but not quantity. Therefore, it is not possible to say that subject A possesses more of the property being categorized than subject B. (Rule: The categories must not be orderable.) Categories must be established in such a way that each datum will fit into only one of the categories. (Rule: The categories must be exclusive.) All the data must fit into the established categories. (Rule: The categories must be exhaustive.) Data such as gender, race and ethnicity, marital status, and diagnoses are examples of nominal data. The rules for the four levels of measurement are summarized in Figure 10-2.
Ordinal-Level Measurement
With ordinal-level measurement, data are assigned to categories that can be ranked. (Rule: The categories can be ranked [see Figure 10-2].) To rank data, one category is judged to be (or is ranked) higher or lower, or better or worse, than another category. Rules govern how the data are ranked. As with nominal data, the categories must be exclusive (each datum fits into only one category) and exhaustive (all data fit into at least one category). With ordinal data, the quantity also can be identified (Stevens, 1946). For example, if you are measuring intensity of pain, you may identify different levels of pain. You probably will develop categories that rank these different levels of pain, such as excruciating, severe, moderate, mild, and no pain. However, in using categories of ordinal measurement, you cannot know with certainty that the intervals between the ranked categories are equal. A greater difference may exist between mild and moderate pain, for example, than between excruciating and severe pain. Therefore ordinal data are considered to have unequal intervals.
The measurement is ordinal because it is not possible to claim that equal distances exist between the rankings. A greater difference may exist between the ranks of 1 and 2 than between the ranks of 2 and 3.
Interval-Level Measurement
Interval-level measurement uses interval scales, which have equal numerical distances between intervals. These scales follow the rules of mutually exclusive, exhaustive, and ranked categories and are assumed to represent a continuum of values. (Rule: The categories must have equal intervals between them [see Figure 10-2].) Therefore the magnitude of the attribute can be more precisely defined. However, it is not possible to provide the absolute amount of the attribute, because the interval scale lacks a zero point. Temperature is the most commonly used example of an interval scale. The difference between the temperatures of 70° F and 80° F is 10° F and is the same as the difference between the temperatures of 30° F and 40° F. Changes in temperature can be measured precisely. However, a temperature of 0° F does not indicate the absence of temperature.
Ratio-Level Measurement
Ratio-level measurement is the highest form of measurement and meets all the rules of other forms of measurement—mutually exclusive categories, exhaustive categories, ordered ranks, equally spaced intervals, and a continuum of values. Interval- and ratio-level data can be added, subtracted, multiplied, and divided because of the equal intervals and continuum of values of these data. Thus interval and ratio data can be analyzed with statistical techniques of greater precision and strength to determine significant relationships and differences (Grove, 2007). In addition, ratio-level measures have absolute zero points. (Rule: The data must have absolute zero [see Figure 10-2].) Weight, length, and volume are commonly used as examples of ratio scales. All three have absolute zeros, at which a value of zero indicates the absence of the property being measured; zero weight means the absence of weight. Because of the absolute zero point, such statements as “Subject A weighs 25 more pounds than subject B” or “Medication container A holds two times as much as container B” can be justified (Stevens, 1946).
Measurement Error
The ideal perfect measure is referred to as the true measure or score. However, some error is always present in any measurement strategy. Measurement error is the difference between the true measure and what is actually measured (Grove, Burns, & Gray, 2013). The amount of error in a measure varies from considerable error in one measurement to very little in another. Measurement error exists with direct and indirect measures. With direct measures, both the object and measurement method are visible. Direct measures, which generally are expected to be highly accurate, are subject to error. For example, a weight scale may be inaccurate for 0.5 pound, precisely calibrated BP equipment might decrease in precision with use, or a tape measure may not be held at exactly the same tension in measuring the waist of each patient. A subject in a study may be 65 years old but may write illegibly on the demographic form. As a result, the age may be entered inaccurately into the study database.
With indirect measures, the element being measured cannot be seen directly. For example, you cannot see pain. You may observe behaviors or hear words that you think represent pain, but pain is a sensation that is not always clearly recognized or expressed by the person experiencing it. The measurement of pain is usually conducted with a scale but can also include observation and physiological measures as shown in Figure 10-1. Efforts to measure concepts such as pain usually result in measuring only part of the concept. Sometimes measures may identify some aspects of the concept but may include other elements that are not part of the concept. In Figure 10-1, the measurement methods of scale, observation, and physiological measures include factors other than pain, as indicated by the parts of the circles that are outside the black-rimmed circle of the concept pain. For example, measurement methods for pain might be measuring aspects of anxiety and fear in addition to pain. However, using multiple methods to measure a concept or variable usually decreases the measurement error and increases the understanding of the concept being measured.
Two types of error are of concern in measurement, random error and systematic error. The difference between random and systematic error is in the direction of the error. In random measurement error, the difference between the measured value and the true value is without pattern or direction (random). In one measurement, the actual value obtained may be lower than the true value, whereas in the next measurement, the actual value obtained may be higher than the true value. A number of chance situations or factors can occur during the measurement process that can result in random error (Waltz, Strickland, & Lenz, 2010). For example, the person taking the measurements may not use the same procedure every time, a subject completing a paper and pencil scale may accidentally mark the wrong column, or the person entering the data into a computer may punch the wrong key. The purpose of measuring is to estimate the true value, usually by combining a number of values and calculating an average. An average value, such as the mean, is a closer estimate of the true measurement. As the number of random errors increases, the precision of the estimate decreases.
Measurement error that is not random is referred to as systematic error. In systematic measurement error, the variation in measurement values from the calculated average is primarily in the same direction. For example, most of the variation may be higher or lower than the average that was calculated. Systematic error occurs because something else is being measured in addition to the concept. For example, a paper and pencil rating scale designed to measure hope may actually also be measuring perceived support. When measuring subjects’ weights, a scale that shows weights that are 2 pounds over the true weights will give measures with systematic error. All the measured weights will be high, and as a result the mean will be higher than if an accurate weight scale were used. Some systematic error occurs in almost any measure. Because of the importance of this type of error in a study, researchers spend considerable time and effort refining their instruments to minimize systematic measurement error (Waltz et al., 2010).
Reliability
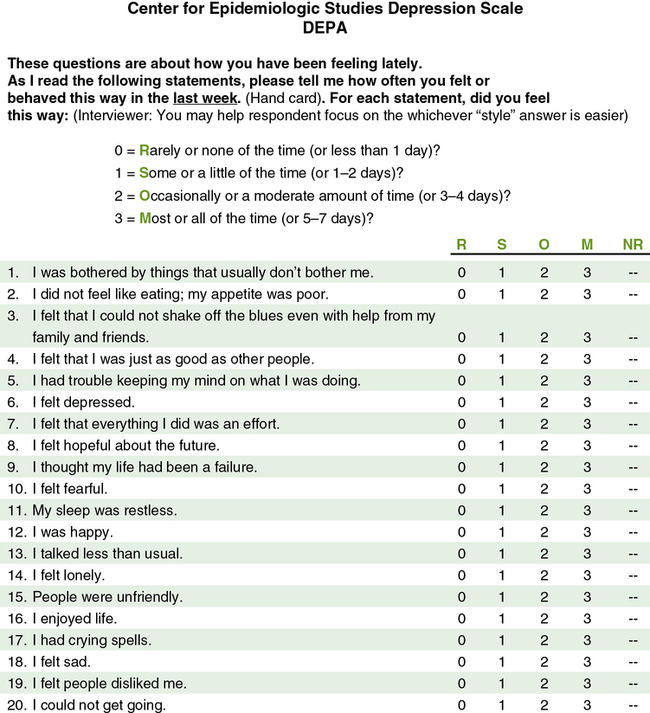
Reliability is concerned with the consistency of a measurement method. For example, if you are using a paper and pencil scale to measure depression, it should indicate similar depression scores each time a subject completes it within a short period of time. A scale that does not produce similar scores for a subject with repeat testing is considered unreliable and results in increased measurement error (Kerlinger & Lee, 2000; Waltz et al., 2010). For example, the Center for Epidemiologic Studies Depression Scale (CES-D) was developed to diagnose depression in mental health patients (Radloff, 1977). The CES-D has proven to be a quality measure of depression in research over the last 40 years. Figure 10-3 illustrates this 20-item Likert scale. If the items on this scale consistently measure what it was developed to measure, depression, then this scale is considered to be both reliable and valid. The different types of reliability and validity testing are discussed in the next sections (outlined in Table 10-1).
Table 10-1
Determining the Quality of Measurement Methods
| Quality Indicator | Description |
| Reliability | Test-retest reliability: Repeated measures with a scale or instrument to determine the consistency or stability of the instrument in measuring a concept Alternate forms reliability: Comparison of two paper and pencil instruments to determine their equivalence in measuring a concept Interrater reliability: Comparison of two observers or judges in a study to determine their equivalence in making observations or judging events Homogeneity or internal consistency reliability: Reliability testing used primarily with multi-item scales in which each item on the scale is correlated with all other items to determine the consistency of the scale in measuring a concept |
| Validity | Content validity: Examines the extent to which a measurement method includes all the major elements relevant to the concept being measured. Evidence of validity from contrasting groups: Instrument or scale given to two groups expected to have opposite or contrasting scores; one group scores high on the scale and the other scores low. Evidence of validity from convergence: Two scales measuring the same concept are administered to a group at the same time, and the subjects’ scores on the scales should be positively correlated. For example, subjects completing two scales to measure depression should have positively correlated scores. Evidence of validity from divergence: Two scales that measure opposite concepts, such as hope and hopelessness, are administered to subjects at the same time and should result in negatively correlated scores on the scales. |
| Readability | Readability level: Conducted to determine the participants’ ability to read and comprehend the items on an instrument. Researchers need to report the level of education that subjects need to read the instrument. Readability must be appropriate to promote reliability and validity of an instrument. |
| Precision | Precision of physiological measure: Degree of consistency or reproducibility of the measurements made with physiological instruments or equipment; comparable to reliability for paper and pencil scales. |
| Accuracy | Accuracy of physiological measure: Addresses the extent to which the physiological instrument or equipment measures what it is supposed to measure in a study; comparable to validity for paper and pencil scales. |
Reliability Testing
Reliability testing is a measure of the amount of random error in the measurement technique. It takes into account such characteristics as dependability, precision, stability, consistency, and reproducibility (Grove et al., 2013; Waltz et al., 2010). Because all measurement techniques contain some random error, reliability exists in degrees and usually is expressed as a correlation coefficient (r). Cronbach’s alpha coefficient is the most commonly used measure of reliability for scales with multiple items (see the following discussion of homogeneity for more details). Estimates of reliability are specific to the sample being tested. Thus high reliability values reported for an established instrument do not guarantee that reliability will be satisfactory in another sample or with a different population. Researchers need to perform reliability testing on each instrument used in a study to ensure that it is reliable for that study (Bialocerkowski, Klupp, & Bragge, 2010; DeVon et al., 2007).
Reliability testing focuses on the following three aspects of reliability—stability, equivalence, and homogeneity (see Table 10-1). Stability is concerned with the consistency of repeated measures of the same attribute with the use of the same scale or instrument. It is usually referred to as test-retest reliability. This measure of reliability is generally used with physical measures, technological measures, and paper and pencil scales. Use of the technique requires an assumption that the factor to be measured remains the same at the two testing times and that any change in the value or score is a consequence of random error. For example, physiological measures such as BP equipment can be tested and then immediately retested, or the equipment can be used for a time and then retested to determine the necessary frequency of recalibration. Researchers need to include test-retest reliability results in their published studies to document the reliability of their measurement methods. For example, the CES-D (see Figure 10-3) has been used frequently in nursing studies over the years and has demonstrated test-retest reliability ranging from r = 0.51 to 0.67 in 2- to 8-week intervals. This is very solid test-retest reliability for this scale, indicating that it is consistently measuring depression with repeat testing and recognizing that subjects’ levels of depression vary somewhat over time (Locke & Putnam, 2002; Sharp & Lipsky, 2002).
Homogeneity is a type of reliability testing used primarily with paper and pencil instruments or scales to address the correlation of each question to the other questions within the scale. Questions on a scale are also called items. The principle is that each item should be consistently measuring a concept such as depression and so should be highly correlated with the other items. Homogeneity testing examines the extent to which all the items in the instrument consistently measure the construct and is a test of internal consistency. The statistical procedure used for this process is Cronbach’s alpha coefficient for interval- and ratio-level data. On some scales, the person responding selects between two options, such as yes and no. The resulting data are dichotomous, and the Kuder-Richardson formula (K-R 20) is used to estimate internal consistency. A Cronbach alpha coefficient of 1.00 indicates perfect reliability, and a coefficient of 0.00 indicates no reliability (Waltz et al., 2010). A reliability of 0.80 is usually considered a strong coefficient for a scale that has documented reliability and has been used in several studies, such as the CES-D (Grove et al., 2013; Radloff, 1977). The CES-D has strong internal consistency reliability, with Cronbach’s alphas ranging from 0.84 to 0.90 in field studies (Locke & Putnam, 2002; Sharp & Lipsky, 2002). For relatively new scales, a reliability of 0.70 is considered acceptable because the scale is being refined and used with a variety of samples. The stronger correlation coefficients, which are closer to 1.0, indicate less random error and a more reliable scale. A research report needs to include the results from stability, equivalence, and/or homogeneity reliability testing done on a measurement method from previous research and in the present study (Grove et al., 2013). A measurement method must be reliable if it is to be considered a valid measure for a study concept.
Validity
The validity of an instrument is a determination of how well the instrument reflects the abstract concept being examined. Validity, like reliability, is not an all or nothing phenomenon; it is measured on a continuum. No instrument is completely valid, so researchers determine the degree of validity of an instrument rather than whether validity exists (DeVon et al., 2007; Waltz et al., 2010). Validity will vary from one sample to another and one situation to another; therefore validity testing evaluates the use of an instrument for a specific group or purpose, rather than the instrument itself. An instrument may be valid in one situation but not another. For example, the CES-D was developed to measure the depression of patients in mental health settings. Will the same scale be valid as a measure of the depression of cancer patients? Researchers determine this by pilot-testing the scale to examine the validity of the instrument in a new population. In addition, the original CES-D (see Figure 10-3) was developed for adults, but the scale has been refined and tested with young children (4 to 6 years of age), school-age children, adolescents, and older adults. Thus different versions of this scale can be used with those of all ages, ranging from 4 years old to geriatric age (Sharp & Lipsky, 2002).
In this text, validity is considered a single broad method of measurement evaluation, referred to as construct validity, and includes content and predictive validity (Rew, Stuppy, & Becker, 1988). Content validity examines the extent to which the measurement method or scale includes all the major elements or items relevant to the construct being measured. The evidence for content validity of a scale includes the following: (1) how well the items of the scale reflect the description of the concept in the literature; (2) the content experts’ evaluation of the relevance of items on the scale that might be reported as an index (Grove et al., 2013); and (3) the potential subjects’ responses to the scale items.
Paper and pencil and electronic instruments or scales must be at a level that potential study subjects can read and understand. Readability level focuses on the study participants’ ability to read and comprehend the content of an instrument or scale. Readability is essential if an instrument is to be considered valid and reliable for a sample (see Table 10-1). Assessing the level of readability of an instrument is relatively simple and takes about 10 to 15 minutes. More than 30 readability formulas are available. These formulas use counts of language elements to provide an index of the probable degree of difficulty of comprehending the scale (Grove et al., 2013). Readability formulas are now a standard part of word-processing software.
Evidence of validity from convergence is determined when a relatively new instrument is compared with an existing instrument(s) that measures the same construct. The instruments, the new and existing ones, are administered to a sample at the same time, and the results are evaluated with correlational analyses. If the measures are strongly positively correlated, the validity of each instrument is strengthened. For example, the CES-D has shown positive correlations ranging from 0.40 to 0.80 with the Hamilton Rating Scale for Depression, which supports the convergent validity of both scales (Locke & Putnam, 2002; Sharp & Lipsky, 2002).
Sometimes instruments can be located that measure a concept opposite to the concept measured by the newly developed instrument. For example, if the newly developed instrument is a measure of hope, you could make a search for an instrument that measures hopelessness or despair. Having study participants complete both these scales is a way to examine evidence of validity from divergence. Correlational procedures are performed with the measures of the two concepts. If the divergent measure (hopelessness scale) is negatively correlated (such as − 0.4 to − 0.8) with the other instrument (hope scale), validity for each of the instruments is strengthened (Waltz et al., 2010).
The evidence of an instrument’s validity from previous research and the current study needs to be included in the published report. In critically appraising a study, you need to judge the validity of the measurement methods that were used. However, you cannot consider validity apart from reliability (see Table 10-1). If a measurement method does not have acceptable reliability or is not consistently measuring a concept, then it is not valid.
Accuracy, Precision, and Error of Physiological Measures
Physiological measures are measurement methods used to quantify the level of functioning of living beings (Ryan-Wenger, 2010). The precision, accuracy, and error of physiological and biochemical measures tend not to be reported or are minimally covered in published studies. These routine physiological measures are assumed to be accurate and precise, an assumption that is not always correct. Some of the most common physiological measures used in nursing studies include BP, heart rate, weight, body mass index, and laboratory values. Sometimes researchers obtain these measures from the patient’s record, with no consideration given to their accuracy. For example, how many times have you heard a nurse ask a patient his or her height or weight, rather than measuring or weighing the patient? Thus researchers using physiological measures need to provide evidence of the measures’ accuracy, precision, and potential for error (see Table 10-1; Gift & Soeken, 1988; Ryan-Wenger, 2010).
Accuracy
Accuracy is comparable to validity in that it addresses the extent to which the instrument measures what it is supposed to measure in a study (Ryan-Wenger, 2010). For example, oxygen saturation measurements with pulse oximetry are considered comparable with measures of oxygen saturation with arterial blood gases. Because pulse oximetry is an accurate measure of oxygen saturation, it has been used in studies because it is easier, less expensive, less painful, and less invasive for research participants. Researchers need to document that previous research has been conducted to determine the accuracy of pulse oximetry for the measurement of individuals’ oxygen saturation levels in their study.
Precision
Precision is the degree of consistency or reproducibility of measurements made with physiological instruments. Precision is comparable to reliability. The precision of most physiological equipment depends on following the manufacturer’s instructions for care and routine testing of the equipment. Test-retest reliability is appropriate for physiological variables that have minimal fluctuations, such as cholesterol (lipid) levels, bone mineral density, or weight of adults (Ryan-Wenger, 2010). Test-retest reliability can be inappropriate if the variables’ values frequently fluctuate with various activities, such as with pulse, respirations, and BP. However, test-retest is a good measure of precision if the measurements are taken in rapid succession. For example, the national BP guidelines encourage taking three BP readings 1 to 2 minutes apart and then averaging them to obtain the most precise and accurate measure of BP (http://www.nhlbi.nih.gov/guidelines/hypertension).
Error
Sources of error in physiological measures can be grouped into the following five categories: environment, user, subject, equipment, and interpretation. The environment affects the equipment and subject. Environmental factors might include temperature, barometric pressure, and static electricity. User errors are caused by the person using the equipment and may be associated with variations by the same user, different users, or changes in supplies or procedures used to operate the equipment. Subject errors occur when the subject alters the equipment or the equipment alters the subject. In some cases, the equipment may not be used to its full capacity. Equipment error may be related to calibration or the stability of the equipment. Signals transmitted from the equipment are also a source of error and can result in misinterpretation (Gift & Soeken, 1988). Researchers need to report the protocols followed or steps taken to prevent errors in their physiological and biochemical measures in their published studies (Ryan-Wenger, 2010; Stone & Frazier, 2010).
 Critical Appraisal Guidelines
Directness, Level of Measurement, Reliability, and Validity of Scales, Accuracy, Precision, and Error of Physiological Measures
1. What measurement method(s) were used to measure each study variable?
2. Was the type of measurement direct or indirect?
3. What level of measurement was achieved for each of the study variables?
4. Was reliability information provided from previous studies and for this study?
5. Was the validity of each measurement method adequately described? In some studies, researchers simply state that the measurement method has acceptable validity based on previous research. This statement provides insufficient information for you to judge the validity of an instrument.
6. Did the researchers address the accuracy, precision, and potential for errors with the physiological measures?
7. Was the process for obtaining, scoring, and/or recording data described?
8. Did the researchers provide adequate description of the measurement methods to judge the extent of measurement error?
 Research Example
Directness, Level of Measurement, Reliability, and Validity of Scales, Accuracy, Precision, and Error of Physiological Measures
Whittenmore, Melkus, Wagner, Dziura, Northrup, and Grey (2009) studied the effects of a lifestyle change program on the outcomes for patients with type 2 diabetes. The lifestyle program was delivered by nurse practitioners (NPs) in primary care settings. The following excerpt describes some of the measurement methods used in this study.
“Data were collected at the individual (participant) and organizational (NP and site) levels at scheduled time points throughout the study. … All data were collected by trained research assistants blinded to group assignment, with the exception of … lipids, which were collected by experienced laboratory personnel at each site and sent to one laboratory for analysis.” (Whittenmore et al., 2009, p. 5)
Weight loss was the primary outcome and was calculated as a percentage of weight loss from baseline to 6 months. … Waist circumference and lipid profiles were secondary clinical outcomes. Waist circumference was measured by positioning a tape measure snugly midway between the upper hip bone and the uppermost border of the iliac crest. In very overweight participants, the tape was placed at the level of the umbilicus (Klein et al., 2007). Lipid profiles (LDL [low-density lipoproteins], HDL [high-density lipoproteins], total cholesterol, and total triglycerides) were determined using fasting venous blood.
Diet and exercise health-promoting behaviors were measured with the exercise and nutrition subscales of the Health-Promoting Lifestyle Profile II (eight and nine items, respectively), which has items constructed on a 4-point Likert scale and measures patterns of diet and exercise behavior (Walker, Sechrist, & Pender, 1987). This instrument has been used in diverse samples, and demonstrates adequate internal consistency (r = .70 to .90 for subscales; Jefferson, Melkus, & Spollett, 2000). The alpha coefficients for the exercise and nutrition subscales in this study were .86 and .76, respectively.…
Psychosocial data were collected on depressive symptoms, as measured by the Center for Epidemiologic Studies Depression Scale (CES-D), a widely used scale (Radloff, 1977). The CES-D consists of 20 items that address depressed mood, guilt or worthlessness, helplessness or hopelessness, psychomotor retardation, loss of appetite, and sleep disturbance [see Figure 10-3]. Each item is rated on a scale of 0 to 3 in terms of frequency during the past week. The total score may range from 0 to 60, with a score of 16 or more indicating impairment. High internal consistency, acceptable test-retest reliability, and good construct validity have been demonstrated (Posner et al., 2001). The alpha coefficient was .93 for the CES-D in this sample.”
Stay updated, free articles. Join our Telegram channel

Full access? Get Clinical Tree


