Chapter 8
Clarifying Quantitative Research Designs
After completing this chapter, you should be able to:
1. Identify the nonexperimental designs (descriptive and correlational) and experimental designs (quasi-experimental and experimental) commonly used in nursing studies.
2. Critically appraise descriptive and correlational designs in published studies.
3. Describe the concepts important to examining causality—multicausality, probability, bias, control, and manipulation.
4. Examine study designs for strengths and threats to statistical conclusion, and to internal, construct, and external validity.
5. Describe the elements of designs that examine causality.
6. Critically appraise the interventions implemented in studies.
7. Critically appraise the quasi-experimental and experimental designs in published studies.
8. Examine the quality of randomized controlled trials (RCTs) conducted in nursing.
9. Discuss the implementation of mixed-methods approaches in nursing studies.
Comparative descriptive design, p. 216
Control or comparison group, p. 230
Cross-sectional design, p. 212
Descriptive correlational design, p. 218
Experimental or treatment group, p. 230
Experimenter expectancy, p. 228
Mixed-methods approaches, p. 243
Nonexperimental designs, p. 212
Predictive correlational design, p. 220
Quasi-experimental design, p. 232
Randomized controlled trial (RCT), p. 241
Statistical conclusion validity, p. 224
A research design is a blueprint for conducting a study. Over the years, several quantitative designs have been developed for conducting descriptive, correlational, quasi-experimental, and experimental studies. Descriptive and correlational designs are focused on describing and examining relationships of variables in natural settings. Quasi-experimental and experimental designs were developed to examine causality, or the cause and effect relationships between interventions and outcomes. The designs focused on causality were developed to maximize control over factors that could interfere with or threaten the validity of the study design. The strengths of the design validity increase the probability that the study findings are an accurate reflection of reality. Well-designed studies, especially those focused on testing the effects of nursing interventions, are essential for generating sound research evidence for practice (Brown, 2014; Craig & Smyth, 2012).
Identifying Designs Used in Nursing Studies
A variety of study designs are used in nursing research; the four most commonly used types are descriptive, correlational, quasi-experimental, and experimental. These designs are categorized in different ways in textbooks (Fawcett & Garity, 2009; Hoe & Hoare, 2012; Kerlinger & Lee, 2000). Sometimes, descriptive and correlational designs are referred to as nonexperimental designs because the focus is on examining variables as they naturally occur in environments and not on the implementation of a treatment by the researcher. Some of these nonexperimental designs include a time element. Designs with a cross-sectional element involve data collection at one point in time. Cross-sectional design involves examining a group of subjects simultaneously in various stages of development, levels of education, severity of illness, or stages of recovery to describe changes in a phenomenon across stages. The assumption is that the stages are part of a process that will progress over time. Selecting subjects at various points in the process provides important information about the totality of the process, even though the same subjects are not monitored throughout the entire process (Grove, Burns, & Gray, 2013). Longitudinal design involves collecting data from the same subjects at different points in time and might also be referred to as repeated measures. Repeated measures might be included in descriptive, correlational, quasi-experimental, or experimental study designs.
Quasi-experimental and experimental studies are designed to examine causality or the cause and effect relationship between a researcher-implemented treatment and selected study outcome. The designs for these studies are sometime referred to as experimental because the focus is on examining the differences in dependent variables thought to be caused by independent variables or treatments. For example, the researcher-implemented treatment might be a home monitoring program for patients initially diagnosed with hypertension, and the dependent or outcome variable could be blood pressure measured at 1 week, 1 month, and 6 months. This chapter introduces you to selected experimental designs and provides examples of these designs from published nursing studies. Details on other study designs can be found in a variety of methodology sources (Campbell & Stanley, 1963; Creswell, 2014; Grove et al., 2013; Kerlinger & Lee, 2000; Shadish, Cook, & Campbell, 2002).
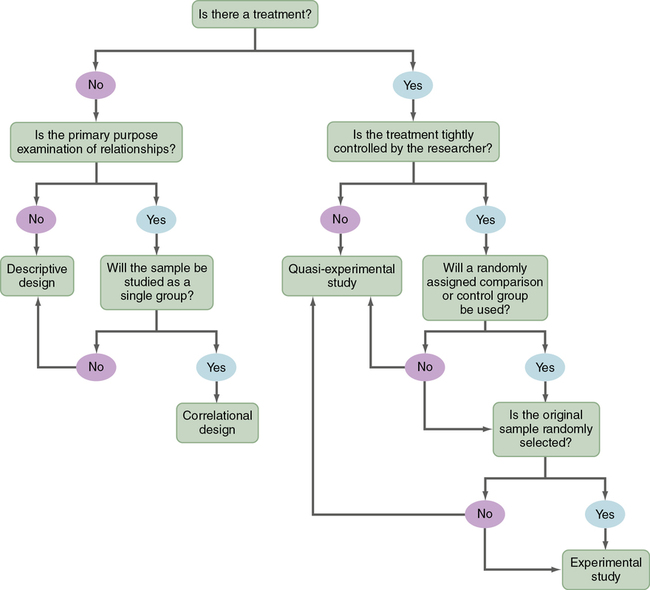
The algorithm shown in Figure 8-1 may be used to determine the type of design (descriptive, correlational, quasi-experimental, and experimental) used in a published study. This algorithm includes a series of yes or no responses to specific questions about the design. The algorithm starts with the question, “Is there a treatment?” The answer leads to the next question, with the four types of designs being identified in the algorithm. Sometimes, researchers combine elements of different designs to accomplish their study purpose. For example, researchers might conduct a cross-sectional, descriptive, correlational study to examine the relationship of body mass index (BMI) to blood lipid levels in early adolescence (ages 13 to 16 years) and late adolescence (ages 17 to 19 years). It is important that researchers clearly identify the specific design they are using in their research report.
Descriptive Designs
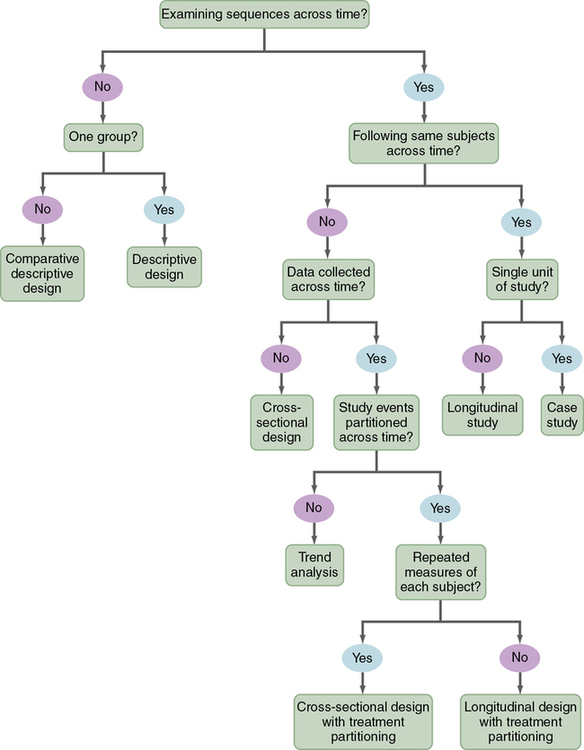
Descriptive studies are designed to gain more information about characteristics in a particular field of study. The purpose of these studies is to provide a picture of a situation as it naturally happens. A descriptive design may be used to develop theories, identify problems with current practice, make judgments about practice, or identify trends of illnesses, illness prevention, and health promotion in selected groups. No manipulation of variables is involved in a descriptive design. Protection against bias in a descriptive design is achieved through (1) conceptual and operational definitions of variables, (2) sample selection and size, (3) valid and reliable instruments, and (4) data collection procedures that might partially control the environment. Descriptive studies differ in level of complexity. Some contain only two variables; others may include multiple variables that are studied over time. You can use the algorithm shown in Figure 8-2 to determine the type of descriptive design used in a published study. Typical descriptive and comparative descriptive designs are discussed in this chapter. Grove and colleagues (2013) have provided details about additional descriptive designs.
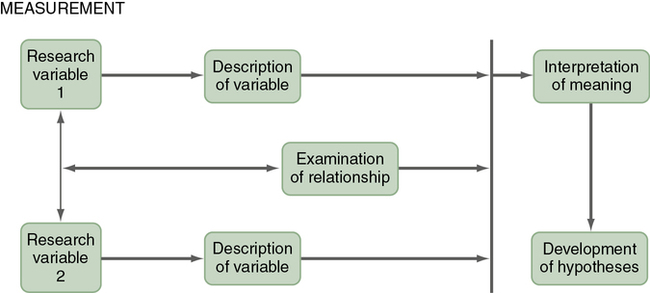
Typical Descriptive Design
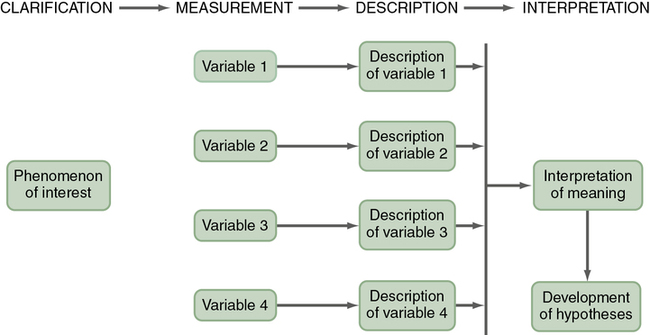
A typical descriptive design is used to examine variables in a single sample (Figure 8-3). This descriptive design includes identifying the variables within a phenomenon of interest, measuring these variables, and describing them. The description of the variables leads to an interpretation of the theoretical meaning of the findings and the development of possible relationships or hypotheses that might guide future correlational or quasi-experimental studies.
 Critical Appraisal Guidelines
Descriptive and Correlational Designs
1. Is the study design descriptive or correlational? Review the algorithm in Figure 8-1 to determine the type of study design.
2. If the study design is descriptive, use the algorithm in Figure 8-2 to identify the specific type of descriptive design implemented in the study.
3. If the study design is correlational, use the algorithm in Figure 8-5 to identify the specific type of correlational design implemented in the study.
4. Does the study design address the study purpose and/or objectives or questions?
5. Was the sample appropriate for the study?
6. Were the study variables measured with quality measurement methods?
 Research Example
Typical Descriptive Design
Maloni, Przeworski, and Damato (2013) studied women with postpartum depression (PPD) after pregnancy complications for the purpose of describing their barriers to treatment for PPD, use of online resources for assistance with PPD, and preference for Internet treatment for PPD. This study included a typical descriptive design; key aspects of this study’s design are presented in the following excerpt.
Maloni and associates (2013) clearly identified their study design as descriptive and indicated that the data were collected using an online survey. This type of design was appropriate to address the study purpose. The sample section was strengthened by using the EPDS to identify women with PPD and using the sample criteria to ensure that the women had been hospitalized for pregnancy complications. However, the sample size of 53 was small for a descriptive study. The 26-item questionnaire had content validity and was consistently implemented online using standard survey software. This typical descriptive design was implemented in a way to provide quality study findings.
Maloni and co-workers (2013) noted that of the 53 women who were surveyed because they reported PPD, 70% had major depression. The common barriers that prevented them from getting treatment included time and the stigma of PPD diagnosis. Over 90% of the women did use the Internet as a resource to learn about coping with PPD and expressed an interest in a web-based PPD treatment.
Comparative Descriptive Design
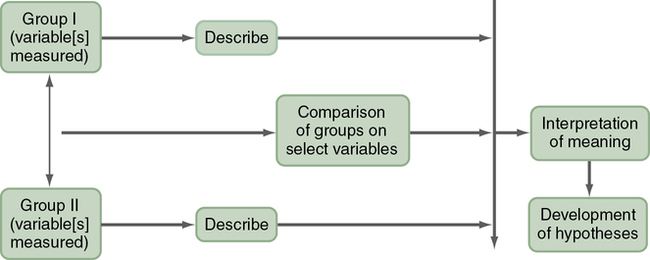
A comparative descriptive design is used to describe variables and examine differences in variables in two or more groups that occur naturally in a setting. A comparative descriptive design compares descriptive data obtained from different groups, which might have been formed using gender, age, educational level, medical diagnosis, or severity of illness. Figure 8-4 provides a diagram of this design’s structure.
 Research Example
Comparative Descriptive Design
Buet and colleagues (2013) conducted a comparative descriptive study to describe and determine differences in the hand hygiene (HH) opportunities and adherence of clinical (e.g., nurses and physicians) and nonclinical (e.g., teachers and parents) caregivers for patients in pediatric extended-care facilities (ECFs). The following study excerpt includes key elements of this comparative descriptive design:
“Eight children across four pediatric ECFs were observed for a cumulative 128 hours, and all caregiver HH opportunities were characterized by the World Health Organization [WHO] ‘5 Moments for HH.’… A convenience sample of two children from each site (n = 8) was observed.… Four observers participated in two hours of didactic training and two hours of monitored practice observations at one of the four study sites to ensure consistent documentation and interpretation of observations. Observers learned how to accurately record HH opportunities and HH adherence using the WHO ‘5 Moments of HH’ data acquisition tool, discussed below. Throughout the study, regular debriefings were also held to review and discuss data recording.…The World Health Organization (WHO, 2009) ‘5 Moments for HH’ define points of contact when healthcare workers should perform HH: ‘before touching a patient, before clean/aseptic procedures, after body fluid exposure/risk, after touching a patient, and after touching patient surroundings…. During approximately 128 hours of observation, 865 HH opportunities were observed.”
Buet and associates (2013) clearly described the aspects of their study design but did not identify the specific type of design used in their study. The design was comparative descriptive because the HH opportunities and adherence for clinical and nonclinical caregivers were described and compared. The study included 128 hours of observation (16 hours per child) of 865 HH opportunities in four different ECF settings. Thus the sampling process was strong and seemed focused on accomplishing the study purpose. The data collectors were well trained and monitored to ensure consistent observation and recording of data. HH was measured using an observational tool based on international standards (WHO, 2009) for HH.
Buet and co-workers (2013) found that the HH of the clinical caregivers was significantly higher than the nonclinical caregivers. However, the overall HH adherence for the clinical caregivers was only 43%. The low HH adherence suggested increased potential for transmission of infections among children in ECFs. Additional HH education is needed for clinical and nonclinical caregivers of these children to prevent future adverse events. Quality and Safety Education for Nurses (QSEN, 2013) implications from this study encourage nurses to follow evidence-based practice (EBP) guidelines in adhering to HH measures to ensure safe care of their patients and reduce their risk of potentially life-threatening infections (Sherwood & Barnsteiner, 2012).
Correlational Designs
In correlational designs, a large range in the variable scores is necessary to determine the existence of a relationship. Therefore the sample should reflect the full range of scores possible on the variables being measured. Some subjects should have very high scores and others very low scores, and the scores of the rest should be distributed throughout the possible range. Because of the need for a wide variation on scores, correlational studies generally require large sample sizes. Subjects are not divided into groups, because group differences are not examined. To determine the type of correlational design used in a published study, use the algorithm shown in Figure 8-5. More details on correlational designs referred to in this algorithm are available from other sources (Grove et al., 2013; Kerlinger & Lee, 2000).
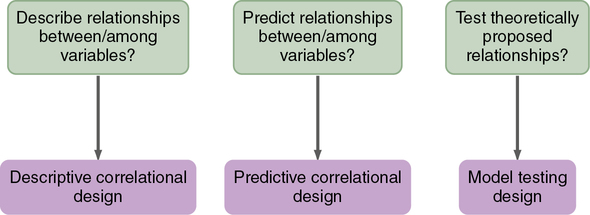
Descriptive Correlational Design
The purpose of a descriptive correlational design is to describe variables and examine relationships among these variables. Using this design facilitates the identification of many interrelationships in a situation (Figure 8-6). The study may examine variables in a situation that has already occurred or is currently occurring. Researchers make no attempt to control or manipulate the situation. As with descriptive studies, variables must be clearly identified and defined conceptually and operationally (see Chapter 5).
 Research Example
Descriptive Correlational Design
Burns, Murrock, and Graor (2012) conducted a correlational study to examine the relationship between BMI and injury severity in adolescent males attending a National Boy Scout Jamboree. The key elements of this descriptive correlational design are presented in the following study excerpt.
Descriptive Correlational Design
Burns and colleagues (2012) clearly identified their study design in their research report. The sampling method was a nonrandom sample of convenience that is commonly used in descriptive and correlational studies. Nonrandom sampling methods decrease the sample’s representativeness of the population; however, the sample size was large and included 20 medical facilities at a national event. The exclusion sampling criteria ensured that the subjects selected were most appropriate to address the study purpose. The adolescents’ height and weight were obtained from their medical records but the researchers did not indicate if these were reported or measured by the healthcare professionals. Self-reported height and weight for subjects could decrease the accuracy of the BMI and BMI-P calculated in a study. The BMI-P and severity injury scores were obtained using reliable and valid measurement methods, and the data from the medical facilities were checked for accuracy. The design of this study seemed strong and the knowledge generated provides a basis for future research.
Burns and associates (2012) found a significant relationship between BMI-P and injury severity. They noted that overweight/obese adolescents may have increased risks of serious injuries. Additional research is needed to examine the relationship of BMI to injury risk and to identify ways to prevent injuries in these adolescents. The findings from this study also emphasize the importance of healthy weight in adolescents to prevent health problems. QSEN (2013) implications are that evidence-based knowledge about the relationship between obesity and severity of injury provides nurses and students with information for educating adolescents to promote their health.
Predictive Correlational Design
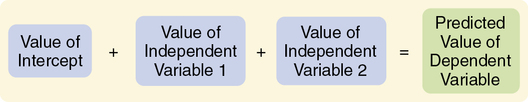
The purpose of a predictive correlational design is to predict the value of one variable based on the values obtained for another variable or variables. Prediction is one approach to examining causal relationships between variables. Because causal phenomena are being examined, the terms dependent and independent are used to describe the variables. The variable to be predicted is classified as the dependent variable, and all other variables are independent or predictor variables. A predictive correlational design study attempts to predict the level of a dependent variable from the measured values of the independent variables. For example, the dependent variable of medication adherence could be predicted using the independent variables of age, number of medications, and medication knowledge of patients with congestive heart failure. The independent variables that are most effective in prediction are highly correlated with the dependent variable but are not highly correlated with other independent variables used in the study. The predictive correlational design structure is presented in Figure 8-7. Predictive correlational designs require the development of a theory-based mathematical hypothesis proposing variables expected to predict the dependent variable effectively. Researchers then use regression analysis to test the hypothesis (see Chapter 11).
 Research Example
Predictive Correlational Design
Coyle (2012) used a predictive correlational design to determine if depressive symptoms were predictive of self-care behaviors in adults who had suffered a myocardial infarction (MI). The following study excerpt presents key elements of this design.
Coyle (2012) might have identified her study design more clearly as predictive correlational but did clearly identify the dependent variable as self-care and the independent variables as depressive symptoms. The design also included the longitudinal measurement of self-care with the HBS at 2 weeks and 30 days. The design was appropriate to accomplish the study purpose. The sample of 62 subjects was adequate because the study findings indicated significant results. The BDI-II has documented reliability (Cronbach’s alphas > 0.7) and validity from previous studies, but the reliability of .68 was low in this study. Reliability indicates how consistently the scale measured depression and, in this study, it had 68% consistency and 32% error (1.00 − .68 = .32 × 100% = 32%; see Chapter 10). HBS had strong reliability in previous studies but the validity of the scale was not addressed. The reliability of HBS was limited at 2 weeks (62% reliable and 38% error) but acceptable at 30 days (71% reliable and 29% error). This study has a strong design with more strengths than weaknesses, and the findings are probably an accurate reflection of reality. The study needs to be replicated with stronger measurement methods and a larger sample.
Coyle (2012) found that depressive symptoms of agitation and loss of energy were significantly predictive of self-care performance in patients with an MI at 30 days post–hospital discharge. Coyle recommended screening post-MI patients for depressive symptoms so that their symptoms might be managed before they were discharged. Further research is recommended to examine depression and self-care behaviors after hospital discharge to identify and treat potential problems.
Model Testing Design
Some studies are designed specifically to test the accuracy of a hypothesized causal model (see Chapter 7 for content on middle range theory). The model testing design requires that all concepts relevant to the model be measured and the relationships among these concepts examined. A large heterogeneous sample is required. Correlational analyses are conducted to determine the relationships among the model concepts, and the results are presented in the framework model for the study. This type of design is very complex; this text provides only an introduction to a model testing design implemented by Battistelli, Portoghese, Galletta, and Pohl (2013).
 Research Example
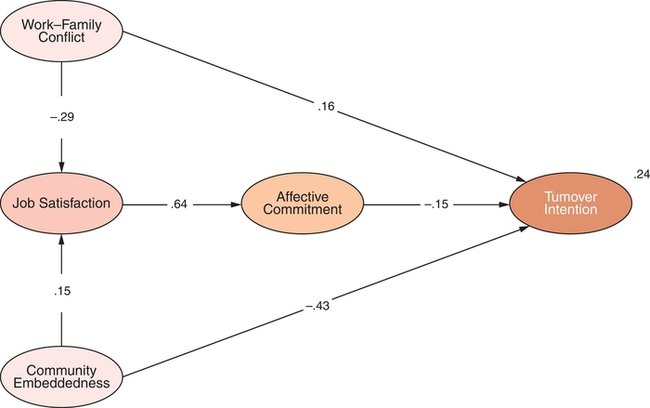
Model Testing Design
Battistelli and co-workers (2013) developed and tested a theoretical model to examine turnover intentions of nurses working in hospitals. The concepts of work-family conflict, job satisfaction, community embeddedness, and organizational affective commitment were identified as predictive of nurse turnover intention. The researchers collected data on these concepts using a sample of 440 nurses from a public hospital. The analysis of study data identified significant relationships (p < 0.05) among all concepts in the model. The results of this study are presented in Figure 8-8 and indicate the importance of these concepts in predicting nurse turnover intention.
Understanding Concepts Important to Causality in Designs
Quasi-experimental and experimental designs were developed to examine causality or the effect of an intervention on selected outcomes. Causality basically says that things have causes, and causes lead to effects. In a critical appraisal, you need to determine whether the purpose of the study is to examine causality, examine relationships among variables (correlational designs), or describe variables (descriptive designs). You may be able to determine whether the purpose of a study is to examine causality by reading the purpose statement and propositions within the framework (see Chapter 7). For example, the purpose of a causal study may be to examine the effect of a specific, preoperative, early ambulation educational program on length of hospital stay. The proposition may state that preoperative teaching results in shorter hospitalizations. However, the preoperative early ambulation educational program is not the only factor affecting length of hospital stay. Other important factors include the diagnosis, type of surgery, patient’s age, physical condition of the patient prior to surgery, and complications that occurred after surgery. Researchers usually design quasi-experimental and experimental studies to examine causality or the effect of an intervention (independent variable) on a selected outcome (dependent variable), using a design that controls extraneous variables. Critically appraising studies designed to examine causality requires an understanding of such concepts as multicausality, probability, bias, control, and manipulation.
Stay updated, free articles. Join our Telegram channel

Full access? Get Clinical Tree


