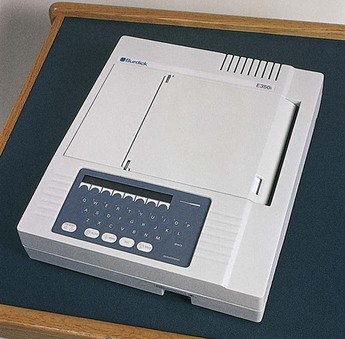
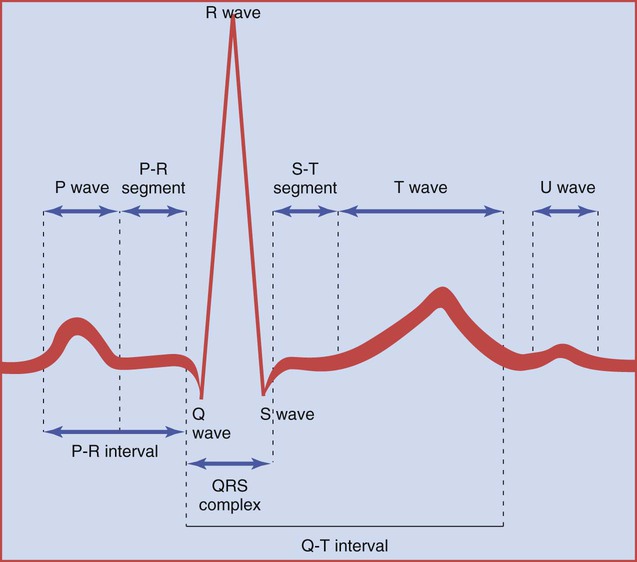
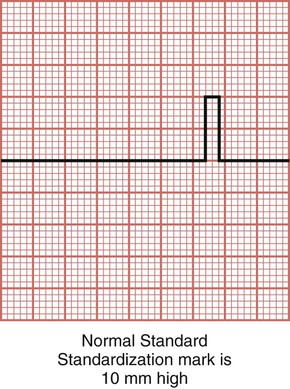
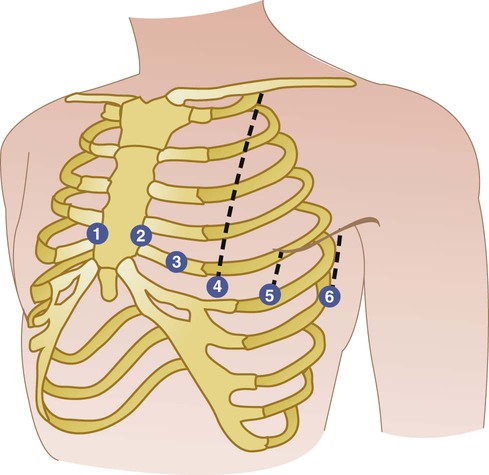
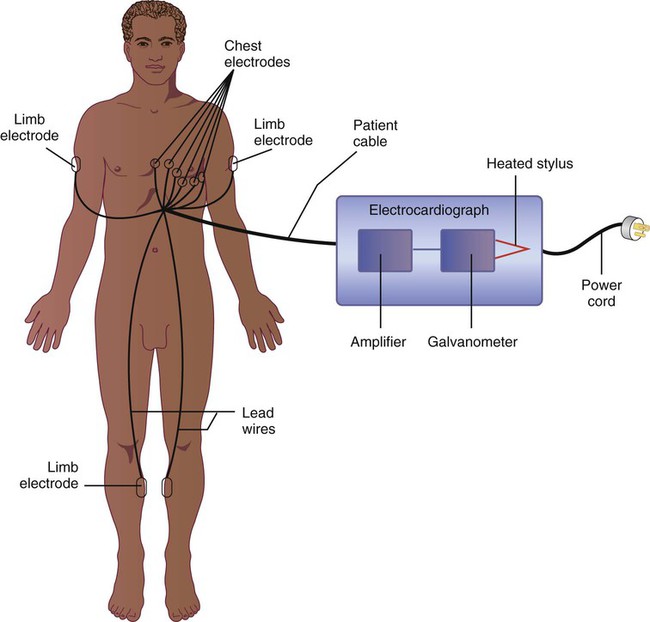
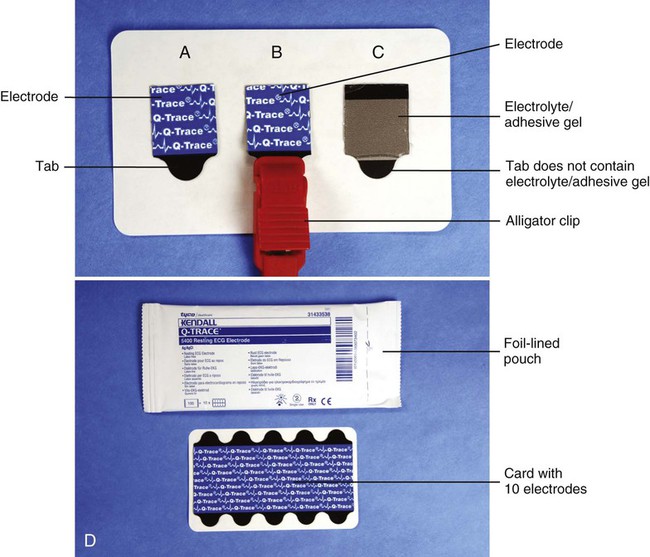
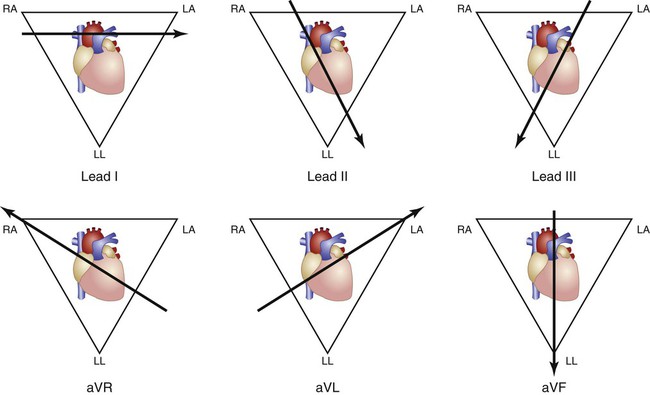
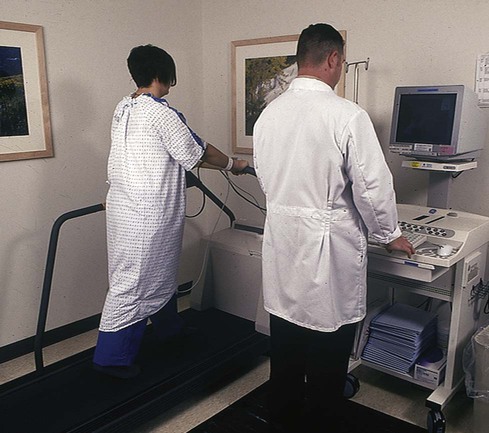
• To evaluate the following symptoms: chest pain, shortness of breath, dizziness, or heart palpitations • To detect an abnormality in the heart’s rate or rhythm (dysrhythmia) • To detect the presence of impaired blood flow to the heart muscle (cardiac ischemia) • To help diagnose damage to the heart caused by a myocardial infarction • To determine the presence of hypertrophy (enlargement) of the heart • To detect inflammation of the heart muscle (myocarditis) or the lining of the heart (pericarditis) • To assess the effect on the heart of digitalis and other cardiac drugs • To determine the presence of electrolyte disturbances • To assess the progress of rheumatic fever • To detect congenital heart defects • Performed before surgery to assess cardiac risk during surgery Electrocardiographs are available in single-channel and three-channel recording formats. Because most medical offices use a three-channel ECG, the information in this chapter focuses on the three-channel electrocardiograph (Figure 27-1). The cardiac cycle represents one complete heartbeat. It consists of the contraction of the atria, the contraction of the ventricles, and the relaxation of the entire heart (as described previously). The electrocardiograph records the electrical activity that causes these events in the cardiac cycle. The ECG cycle is the graphic representation of the cardiac cycle (Figure 27-2). P wave The P wave represents the electrical activity associated with the contraction of the atria, or atrial depolarization. QRS complex The QRS complex represents the electrical activity associated with the contraction of the ventricles, or ventricular depolarization, and consists of the Q wave, the R wave, and the S wave. The ventricles are larger than the atria and therefore require a stronger electrical stimulus to depolarize the ventricles. That is why the R wave is taller than the P wave on the ECG graph cycle. T wave The T wave represents the electrical recovery of the ventricles, or ventricular repolarization. The muscle cells are recovering in preparation for another impulse. (NOTE: Electrical recovery, known as atrial repolarization, occurs following the P wave. This repolarization occurs at the same time as ventricular depolarization [QRS complex]. Because of this, atrial repolarization is masked or hidden by the QRS complex and does not appear as a separate wave on the ECG cycle.) U wave Occasionally, a U wave follows a T wave. It is a small wave that is associated in some as yet undefined way with repolarization of the Purkinje fibers or repolarization of the papillary muscles of the heart. P-R segment The P-R segment represents the time interval from the end of the atrial depolarization to the beginning of the ventricular depolarization. It is the time needed for the impulse to be delayed at the AV node and then travel through the bundle of His and Purkinje fibers to the ventricles. S-T segment The S-T segment represents the time interval from the end of the ventricular depolarization to the beginning of repolarization of the ventricles. P-R interval The P-R interval represents the time interval from the beginning of the atrial depolarization to the beginning of the ventricular depolarization. Q-T interval The Q-T interval is the time interval from the beginning of the ventricular depolarization to the end of repolarization of the ventricles. Baseline The baseline after the T wave (or U wave, if present) represents the period when the entire heart returns to its resting, or polarized, state. Electrocardiograph paper is divided into two sets of squares for the accurate and convenient manual measurement of the waves, intervals, and segments (Figure 27-3). Each small square is 1 mm high and 1 mm wide. Each large square (made up of 25 small squares) is 5 mm high and 5 mm wide. By manually measuring the various waves, intervals, and segments of the ECG graph cycle with ECG calipers or an ECG ruler, the physician is able to determine whether the electrical activity of the heart falls within normal limits. Heart disease can trigger abnormal changes in the ECG cycle, causing the results to fall outside of normal limits. For example, cardiac ischemia (often due to coronary artery disease) can cause a depressed S-T segment and an inverted T wave. A myocardial infarction can cause a larger than normal Q wave and an elevated S-T segment. By international agreement, 1 millivolt (mV) of electricity should cause the stylus to move 10 mm high in amplitude (10 small squares). During the recording, the machine allows 1 mV to enter the electrocardiograph machine, which should result in an upward deflection of 10 mm. The marking that occurs on the ECG paper is known as a standardization mark (Figure 27-4). The width of the mark made by the machine is approximately 2 mm (two small squares). A three-channel electrocardiograph automatically records standardization marks on the ECG; a standardization mark is recorded at the beginning and end of each of the ECG strips included in the three-channel recording (see Figure 27-9). If the standardization mark is more or less than 10 mm in amplitude, it must be adjusted; otherwise, the ECG recording may not be accurate. The manufacturer’s operating manual must be consulted for proper adjustment information. An electrocardiograph must never be adjusted without use of the operating manual. The electrical impulses given off by the heart are picked up by electrodes and conducted into the machine through lead wires. Electrodes are composed of a substance that is a good conductor of electricity. The electrical impulses given off by the heart are very small (0.0001 to 0.003 volt). To produce a readable ECG, they must be made larger, or amplified, by a device known as an amplifier, located within the electrocardiograph. The amplified voltages are changed into mechanical motion by the galvanometer and recorded on the electrocardiograph paper by a thermal print head (Figure 27-5). Disposable electrodes are used to record a resting 12-lead electrocardiogram. The electrode contains a thin layer of a metallic substance; this metallic substance is a good conductor of electricity. The electrode is square in shape and has a tab extending from one end (Figure 27-6, A). The tab allows for the firm attachment of an alligator clip (Figure 27-6, B). The back of the electrode contains an electrolyte gel combined with an adhesive (Figure 27-6, C). An electrolyte is a substance that facilitates the transmission of the heart’s electrical impulse. Skin is a poor conductor of electricity; therefore, an electrolyte must be used when recording an ECG. The adhesive allows for firm adherence of the electrode to the patient’s skin. There is no adhesive on the tab of the electrode to allow for attachment of the alligator clip. The electrode is applied to the skin and held in place with its adhesive backing; it is thrown away after use. Disposable 12-lead electrodes come on a card containing 10 electrodes (Figure 27-6, D). A foil-lined pouch is used to hold 10 cards of electrodes (or 100 electrodes per pouch). The foil-lined pouch preserves moisture to prevent the electrolyte from drying out. The first three leads of the 12-lead ECG are the bipolar leads; they are leads I, II, and III. The bipolar leads use two of the limb electrodes to record the heart’s electrical activity. Lead I records the electrical current traveling between the right arm and the left arm, lead II records the electrical current traveling between the right arm and the left leg, and lead III records the electrical current traveling between the left arm and the left leg (Figure 27-7). Lead II shows the heart’s rhythm more clearly than the other leads. Because of this, the physician often requests a rhythm strip, which is a longer recording (approximately 12 inches) of lead II (see Figure 27-9). The next three leads are the augmented leads: aVR (augmented voltage—right arm), aVL (augmented voltage—left arm), and aVF (augmented voltage—left leg or foot). Lead aVR records the electrical current traveling between the right arm electrode and a central point between the left arm and left leg. Lead aVL records the electrical current traveling between the left arm electrode and a central point between the right arm and left leg. Lead aVF records the electrical current traveling between the left leg electrode and a central point between the right and left arms. Leads I, II, III, aVR, aVL, and aVF provide an electrical “photograph” of the heart’s activity from side to side and from the top to the bottom of the heart (see Figure 27-7). Highlight on Cardiac Stress Testing A cardiac stress test (also known as an exercise tolerance test or exercise ECG) is a diagnostic procedure used to evaluate the cardiovascular health of individuals with known heart disease and individuals at high risk for developing heart disease, particularly coronary artery disease (CAD). Cardiac stress testing is usually performed in a hospital under the direction of a cardiologist and a cardiac technician so that emergency equipment and trained personnel are available to deal with any unusual situations that might arise. (NOTE: A nuclear cardiac stress test is a type of stress test that employs the use of a radioactive material injected through an IV and is described in Chapter 28.) The purpose of cardiac stress testing is as follows: 1. To evaluate symptoms of ischemic heart disease that cannot be assessed by a resting electrocardiogram. Ischemic heart disease occurs as a result of inadequate blood supply to the myocardium, which is most commonly caused by atherosclerosis. Atherosclerosis is a condition in which fibrous plaques of fatty deposits and cholesterol build up on the inner walls of arteries. This causes narrowing and partial blockage of the lumen of these arteries, along with hardening of the arterial wall. Atherosclerosis in the coronary arteries is called coronary artery disease (CAD). During rest, the myocardium supplied by the partially blocked artery may receive an adequate blood supply. If the individual exercises, however, the artery may not be able to supply enough blood to the myocardium, resulting in myocardial ischemia. Myocardial ischemia can cause chest discomfort and certain abnormal changes on the ECG. 2. To assist in evaluating symptoms indicating the presence of cardiac dysrhythmias. 3. To assess the effectiveness of cardiac drug therapy. 4. To follow the course of rehabilitation after a myocardial infarction or a cardiac surgical procedure, such as a coronary bypass operation or a coronary stent placement. 5. To determine an individual’s fitness level for a strenuous exercise program, such as jogging. Patient preparation for a cardiac stress test includes the following: 1. Refrain from smoking for 4 hours before the test. 2. Avoid strenuous physical activities for 8 to 12 hours before the test. 3. Do not consume alcohol or food and beverages containing caffeine for 12 hours before the test. These substances may interfere with obtaining accurate results. 4. Do not eat or drink anything except water for 4 hours before the test. This reduces the likelihood of nausea that may accompany strenuous activity after a meal. 5. Certain cardiac medications may need to be discontinued 1 to 2 days before the test; this determination is made by the physician. 6. Wear loose, comfortable clothing and sports shoes suitable for exercising. • Cardiac stress testing involves the continuous electrocardiographic monitoring of an individual during physical exercise. During exercise, the body’s need for oxygen places added demands or “stress” on the heart, making it work harder. A cardiac stress test evaluates the response of the heart to maximum or near-maximum exertion. • A resting 12-lead ECG is usually performed before a cardiac stress test, and the results of the resting ECG are compared with the results of the cardiac stress test. • The stress test is accomplished by having the patient use a treadmill while connected to an electrocardiograph machine through lead wires and electrodes (see illustration). • The intensity of the physical exertion starts with a slow “warm-up” walk on the treadmill. The speed and incline of the treadmill are gradually increased every 3 minutes until the patient’s target heart rate is reached. During this time, the ECG is continuously displayed on a computer screen. The patient’s blood pressure, heart rate, and physical symptoms are also monitored during the test. • If the signs and symptoms of cardiac ischemia appear, the test is stopped. These symptoms include severe dyspnea, chest discomfort or pain, pallor, weakness, and dizziness. The test is also stopped if the ECG shows abnormal changes, if a serious, irregular heartbeat occurs, or if there is an abnormal change in blood pressure. • Once the exercising is complete, the patient’s blood pressure, heart rate, and ECG are monitored until they return to normal. The last six leads are the chest, or precordial, leads: V1, V2, V3, V4, V5, and V6. These leads record the heart’s voltage from front to back. The electrical current traveling through the heart is recorded from a central point “inside” the heart to a point on the chest wall where the electrode is placed. These points correspond to the chest electrode placement sites. Figure 27-8 shows the proper location of the electrodes for the six chest leads. To ensure an accurate and reliable recording, the medical assistant must be able to locate these electrode placement sites accurately (by palpating the patient’s chest). For example, if V1 and V2 are placed in the third intercostal spaces (instead of the fourth intercostal spaces), changes can occur to the P and T waves, which can falsely indicate heart disease. When first learning to locate the electrode sites for each chest lead, it helps to mark their locations on the patient’s chest with a felt-tipped pen. 1. V1, fourth intercostal space at right margin of sternum 2. V2, fourth intercostal space at left margin of sternum 3. V3, midway between positions 2 and 4 4. V4, fifth intercostal space at junction of left midclavicular line 5. V5, at horizontal level of position 4 at left anterior axillary line 6. V6, at horizontal level of position 4 at left midaxillary line Recording three leads at one time requires three-channel recording paper, which is designed in a standard
Cardiopulmonary Procedures
Introduction to Electrocardiography
Cardiac Cycle
Waves
Baseline, Segments, and Intervals
Segments
Intervals
Electrocardiograph Paper
Standardization of the Electrocardiograph
Electrocardiograph Leads
Electrodes
Bipolar Leads
Augmented Leads
Chest Leads
Electrocardiographic Capabilities
Three-Channel Recording Capability
 × 11-inch format. This size printout fits easily into a paper-based medical record (PPR). Most three-channel electrocardiographs have a copy capability that quickly produces a duplicate copy of an ECG that has just been recorded. Some three-channel electrocardiographs have a memory storage capability in which a specified number of ECGs can be stored in the machine for later retrieval. In this way, an ECG that has been misplaced can be retrieved from the electrocardiograph’s memory and printed out again. Figure 27-9 is an example of a three-channel ECG recording that also includes a rhythm strip. Procedure 27-1 describes how to run a 12-lead three-channel ECG.

Cardiopulmonary Procedures


 Procedure 27-1


Get Clinical Tree app for offline access