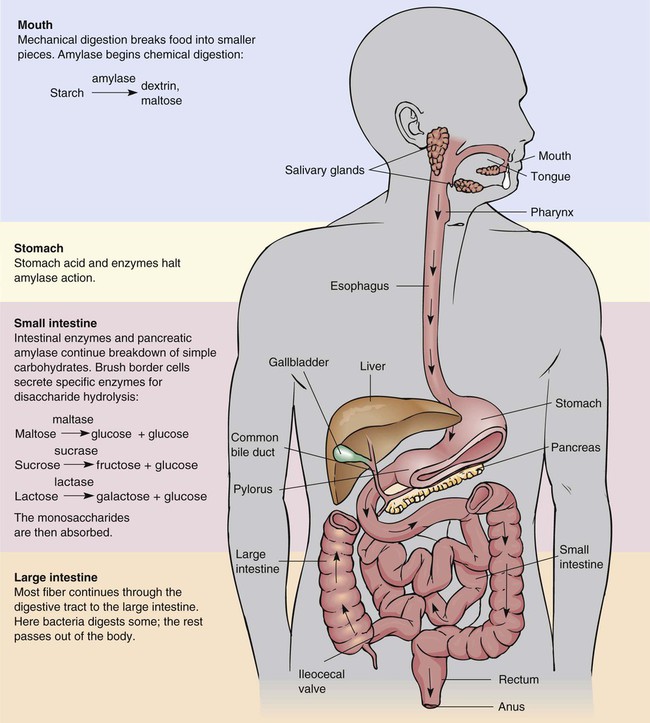
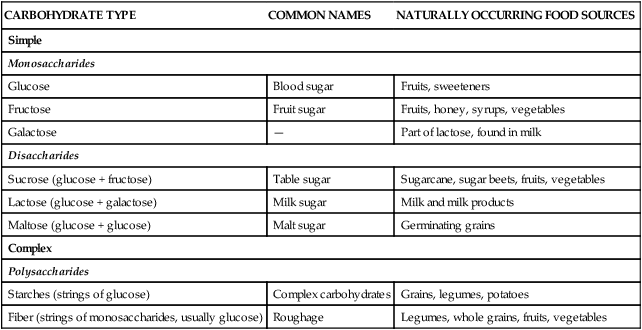
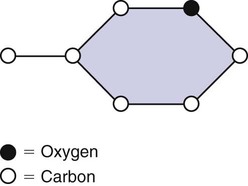
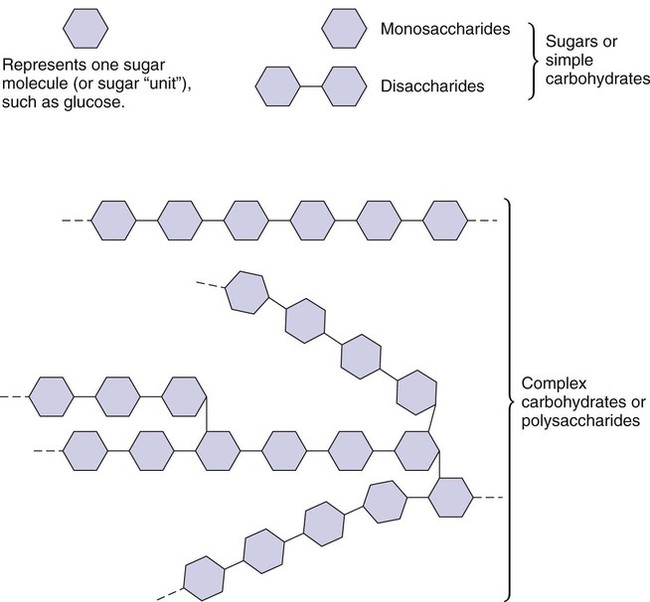
The energy value of carbohydrates was discovered in 1844.1 Recognition that increasing our consumption of carbohydrates from grains, vegetables, and fruits provides preventive health benefits is more recent. Increased levels of complex carbohydrates, particularly dietary fiber, appear to reduce the risk factors associated with chronic diet-related disorders such as heart disease, diabetes, and some cancers.2 The Acceptable Macronutrient Distribution Range (AMDR) for carbohydrate is 45% to 65% of kcal intake per day as primarily complex carbohydrates.2 The Dietary Guidelines concur, recommending that we emphasize a plant-based diet including fruits, vegetables, cooked dried beans and peas, whole grains, and seeds.3 This advice is reflected in MyPyramid. Although recommendations vary based on individual needs, average suggestions of two cups of fruits, two and one half cups of vegetables, and 6 ounces of grains (bread, cereal, rice, and pasta) provide adequate amounts of complex carbohydrates (Box 4-1). All carbohydrates are organic compounds composed of carbon, hydrogen, and oxygen in the form of simple carbohydrates or sugars (Figure 4-1). When linked together, these simple sugars form three sizes of carbohydrates: monosaccharides, disaccharides, and polysaccharides (Figure 4-2). The three sizes of carbohydrates are divided into two classifications: simple carbohydrates (monosaccharides and disaccharides) and complex carbohydrates (polysaccharides) (Table 4-1). Both are valuable sources of carbohydrate energy. There are differences, however, between the health values of simple and complex carbohydrates found in the foods we consume. Although simple carbohydrates primarily provide energy in the form of glucose, fructose, and galactose, complex carbohydrates also may provide fiber in addition to glucose. TABLE 4-1 Enzymes specific for disaccharides (lactase for lactose, sucrase for sucrose, maltase for maltose) are secreted by the small intestine’s brush border cells, which then hydrolyze disaccharides into monosaccharides. (For more information, see the Cultural Considerations box, The Missing Enzyme, and the Teaching Tool box, Lacking Lactose? No Problem!) After an active absorption process (i.e., one that requires energy input), absorptive cells in the small intestine take up these monosaccharides. Once glucose, fructose, and galactose enter the villi, the portal blood circulatory system transports them to the liver. The liver removes fructose and galactose and converts them to glucose. This glucose may be used immediately for energy or for glycogen formation, a storage form of carbohydrate providing an always-ready source of energy. Figure 4-3 summarizes carbohydrate digestion. Noncarbohydrates can also provide blood glucose. Gluconeogenesis is the process of producing glucose from fat. It is not as efficient as using carbohydrate directly for glucose. As fat is metabolized into fatty acids and glycerol (see Chapter 5), the smaller glycerol portion can be converted by the liver into glycogen, which is then available for glucose needs through glycogenolysis. Protein, which is composed of numerous combinations of amino acids, also may be a source of glucose. Some of these amino acids are glucogenic; if they are not used for protein structures, they can be metabolized to form glucose. Carbohydrate as an energy source is also discussed in Figure 9-2. Although the sophisticated hormonal system controls the metabolism and regulation of blood glucose levels, most likely the composition of foods we consume may differ significantly in their effect on blood glucose levels. To account for this, the concepts of glycemic index and glycemic load are used. Glycemic index is the ranking of foods based on the level to which a food raises blood glucose levels compared with a reference food such a 50-g glucose load or white bread containing 50 g carbohydrate.4,5 A ranking of 100 is the highest glycemic index level—that is, it raises blood glucose levels the highest. Note the glycemic index rankings of commonly consumed foods listed Box 4-2. The glycemic index of a food is affected by the following factors:4 • The physical form such as a baked potato compared with a mashed potato • The fat and protein content in addition to carbohydrate, which slows digestion • The ripeness such as in fruits and vegetables, which increases glucose content • The fiber content, which slows digestion • The botanic variety of a food, such as the different glycemic indexes of rice species Because the glycemic index assesses only one food item, another measurement tool is needed because we usually eat several foods at the same time. This is accounted for by the glycemic load, which considers the total glycemic index effect of a mixed meal or dietary plan. It is calculated by the sum of the products of the glycemic index for each of the foods multiplied by the amount of carbohydrate in each food.5 Given that glycemic load accounts for the mixed consumption of foods, it measures the quantity and quality of the effect of carbohydrate on blood glucose and the resulting effect on insulin release.4 Recent epidemiologic work notes associations between glycemic index and glycemic load with risk of chronic diseases such as type 2 diabetes mellitus, cardiovascular disease, and diet-related cancers of the colon and breast. Seemingly limiting consumption of foods producing a high glycemic index and overall high glycemic load would seem prudent to reduce risk. Public health recommendations, however, will most likely not be forthcoming until long-term clinical trials demonstrate a clear role of these diet-related effects. Regardless, the concept of glycemic index is controversial—in relation to health and disease—because it measures individual foods, not mixed meals within which the carbohydrate effect might vary.5 Nonetheless, consider its potential value in the following situations. The glycemic index of a food may affect a person’s blood glucose level, but that same food as part of a meal of several foods (a mix of high and low glycemic indexes) will have a different effect or glycemic load. If a person’s dietary goal is to have an even blood glucose level, one could choose foods that provide an even response and by consuming foods throughout the day avoid a feasting or fasting experience. Certainly this is what individuals with diabetes (abnormally high blood glucose levels) accomplish through carbohydrate counting and planning nourishment within intentional intervals. For those of us who are prone to hypoglycemia (abnormally low blood glucose level), consuming low glycemic index foods or meals with moderate glycemic loads may maintain adequate blood glucose levels. For the rest of us, having a stable level of blood glucose for energy from the foods we consume provides much-needed stamina. The bottom line to this issue for most of us is that we struggle enough with just preparing and finding time to eat adequate meals. Adding the layer of assessing glycemic index and glycemic loads to foods and meals may be more than can be expected within our contemporary lifestyles (Box 4-3). Sugar in our food supply may include the following nutritive sweeteners: refined white sugar, brown sugar, dextrose, crystalline fructose, high fructose corn syrup (HFCS), glucose, corn sweeteners, lactose, concentrated fruit juice, honey, maple syrup, molasses, and reduced energy polyols or sugar alcohols (e.g., sorbitol, mannitol, xylitol)6 (Table 4-2). All forms of sugar are chemically similar; each provides kcal and most do not contain any other nutrients. Blackstrap molasses does contain iron, but other more nutrient-dense sources of iron are easily available. Honey, which seems less processed than other sweeteners, provides only a trace of minerals and therefore is as nonnutritious as any other sweetener. TABLE 4-2 NUTRITIVE AND NONNUTRITIVE SWEETENERS
Carbohydrates
![]() http://evolve.elsevier.com/Grodner/foundations/
http://evolve.elsevier.com/Grodner/foundations/ ![]() Nutrition Concepts Online
Nutrition Concepts Online
Role in Wellness
Food Sources
CARBOHYDRATE TYPE
COMMON NAMES
NATURALLY OCCURRING FOOD SOURCES
Simple
Monosaccharides
Glucose
Blood sugar
Fruits, sweeteners
Fructose
Fruit sugar
Fruits, honey, syrups, vegetables
Galactose
—
Part of lactose, found in milk
Disaccharides
Sucrose (glucose + fructose)
Table sugar
Sugarcane, sugar beets, fruits, vegetables
Lactose (glucose + galactose)
Milk sugar
Milk and milk products
Maltose (glucose + glucose)
Malt sugar
Germinating grains
Complex
Polysaccharides
Starches (strings of glucose)
Complex carbohydrates
Grains, legumes, potatoes
Fiber (strings of monosaccharides, usually glucose)
Roughage
Legumes, whole grains, fruits, vegetables
Carbohydrate as a Nutrient within the Body
Function
Digestion and Absorption
Metabolism
Glycemic Index and Glycemic Load
Simple Carbohydrates
Monosaccharides
Disaccharides
Sugar—A Special Disaccharide
Sources in the Food Supply
SWEETENER
KCAL/g
REGULATORY STATUS
OTHER NAMES
DESCRIPTION
Sucrose
4
GRAS
Granulated: coarse, regular, fine; powdered; confectioners’; brown; turbinado, Demerara; liquid: molasses
Sweetens; enhances flavor; tenderizes, allows browning, and enhances appearance in baking; adds characteristic flavor with unrefined sugar
Fructose
4
GRAS
High-fructose corn syrups: 42%, 55%, 90% fructose; crystalline fructose: 99% fructose
Sweetens; functions like sucrose in baking. Some people experience a laxative response from a load of fructose ≥20 g. May produce lower glycemic response than sucrose
Polyols-monosaccharide
Sorbitol
2.6
GRAS (label must warn about a laxative effect)
Same as chemical name
50%-70% as sweet as sucrose. Some people may experience a laxative effect from a load of sorbitol ≥50 g.
Mannitol
1.6
Permitted for use on an interim basis (label must warn about a laxative effect)
Same as chemical name
50%-70% as sweet as sucrose. Some people may experience a laxative effect from a load of mannitol ≥20 g
Xylitol
2.4
GRAS
Same as chemical name
As sweet as sucrose
Saccharin
0
Permitted for use on interim basis (label must contain cancer warning and amount of saccharin in the product)
Sweet’N Low
200%-700% sweeter than sucrose. Noncariogenic and produces no glycemic response. Synergizes the sweetening power of nutritive and nonnutritive sweeteners. Sweetening power is not reduced with heating
Aspartame
4*
Approved as a general purpose sweetener
NutraSweet, Equal
160%-220% sweeter than sucrose. Noncariogenic and produces limited glycemic response. New forms can increase its sweetening power in cooking and baking
Acesulfame K
0
Approved for use as a tabletop sweetener and as an additive in a variety of desserts, confections, and alcoholic beverages
Sunette†
200% sweeter than sucrose. Noncariogenic and produces no glycemic response. Sweetening power is not reduced with heating. Can synergize the sweetening power of other nutritive and nonnutritive sweeteners
Sucralose
0
Approved for use as a tabletop sweetener and as an additive in a variety of desserts, confections, and nonalcoholic beverages
Splenda‡
600% sweeter than sucrose. Noncariogenic and produces no glycemic response. Sweetening power is not reduced with heating ![]()
Stay updated, free articles. Join our Telegram channel

Full access? Get Clinical Tree


Carbohydrates
Get Clinical Tree app for offline access
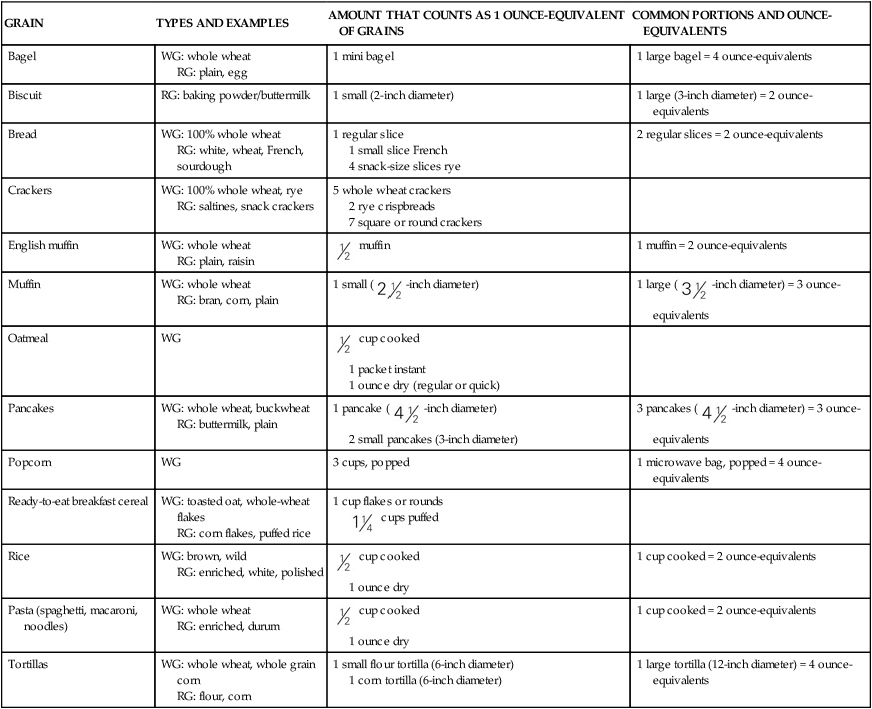
 cup of cooked rice, cooked pasta, or cooked cereal can be considered 1 ounce-equivalent from the grains group.
 muffin
 -inch diameter)
 -inch diameter) = 3 ounce-equivalents
 cup cooked
 -inch diameter)
 -inch diameter) = 3 ounce-equivalents
 cups puffed
 cup cooked
 cup cooked
 cup consumed throughout the day can often be tolerated.