6 Shock, Cardiac Arrest, and Resuscitation
 Be sure to check out the supplementary content available at
 Shock
Shock pearls
• Shock is a common cause of morbidity and mortality in pediatric patients with acute illness and injury.
• Early recognition of shock is essential for survival. Signs of shock in children may be more subtle than those in the adult and hypotension may not develop until late in the clinical course, when cardiovascular collapse is imminent.
• Treatment focuses on restoration of adequate oxygen delivery. Fluid therapy, inotropes, vasodilators, vasopressors, hydrocortisone, thyroid replacement, and extracardiac support devices may be required to accomplish this goal.
• Further shock treatment depends on the cause of the cardiovascular dysfunction and complications caused by the period of inadequate oxygen delivery.
Introduction
Shock is commonly defined as a clinical state characterized by an inadequate delivery of oxygen and metabolic substrates to meet the metabolic demands of the cells and tissues of the body.53,245,246 Inadequate delivery of oxygen results in cellular hypoxia, anaerobic metabolism, lactic acidosis, activation of the host inflammatory response, and eventual vital organ dysfunction.
Cardiovascular physiology and shock pathophysiology
Cellular Basis of Shock
Adenosine triphosphate (ATP) is the energy currency of the cell. Shock is a state of acute energy failure in which there is insufficient ATP production to support systemic cellular function.53 During stress and periods of increased energy demand, glucose is produced from glycogenolysis and gluconeogenesis. Fat metabolism is the secondary source of energy in this state. Long-chain fatty acids are oxidized, and carnitine is used to shuttle acetyl coenzyme A (CoA) into mitochondria. Protein catabolism can also contribute acetyl CoA to the Krebs cycle for energy production. However, this method of energy production is inefficient; aerobic metabolism provides 20-fold the energy produced by anaerobic metabolism. Glucose is oxidized to pyruvate via glycolysis (also called the Embden-Meyerhof pathway), generating only two molecules of ATP in the process.
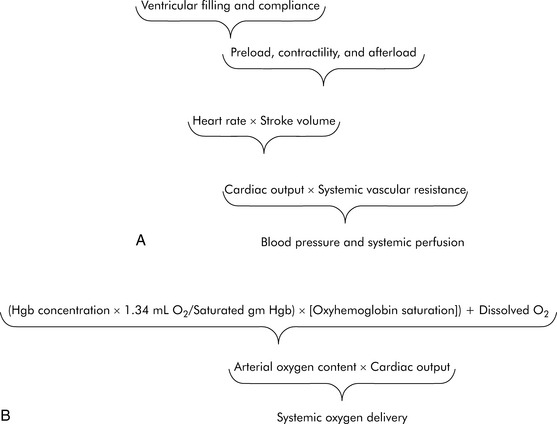
In practical terms, using this operational definition, a state of shock may result from inadequate substrate delivery (glycopenia) or mitochondrial dysfunction (cellular dysoxia).53 Oxygen delivery to the cells and tissues depends primarily on three factors: hemoglobin (Hb) concentration, cardiac output (CO), and the relative proportion of oxygenated hemoglobin (i.e., percent saturation [SaO2]). Oxygen is transported in the blood combined with hemoglobin, although a relatively small amount is freely dissolved in the plasma fraction of the blood. When fully saturated at normal body temperature, each gram of hemoglobin can carry about 1.34 to 1.36 mL of oxygen. The normal arterial oxygen content is calculated as follows:

Oxygen delivery (DO2) is a product of arterial oxygen content and CO:

Adequate glucose delivery depends on the presence of adequate blood glucose concentration, normal blood flow (or CO), and an adequate concentration of insulin for cells with insulin-responsive glucose transporters (e.g., cardiomyocytes). Glycopenic shock can be caused by hypoglycemia and by extreme insulin resistance.53 Finally, even when oxygen delivery and glucose delivery are adequate, shock may occur as a result of mitochondrial dysfunction. For example, cyanide poisons the oxidative phosphorylation chain, preventing production of ATP. Cellular dysoxia (also known as cytopathic hypoxia) may theoretically occur from one or a combination of several mechanisms, including diminished delivery of a key substrate (e.g., pyruvate) to the Krebs cycle of the electron transport chain or uncoupling of oxidative phosphorylation.
Determinants of Oxygen Delivery
Normal CO
As defined previously, oxygen delivery is the product of CO and arterial oxygen content (CaO2). CO is the product of heart rate (HR) and stroke volume (SV; Fig. 6-1). SV, in turn, is dependent on preload, afterload, and contractility. Furthermore, blood pressure (BP) is determined by the product of CO and systemic vascular resistance (SVR).
Myocardial performance can be affected by changes in oxygenation, perfusion, serum ionized calcium concentration, acid-base, and electrolyte balance, sympathetic or vagal stimulation, and drugs.244 These factors can affect CO by altering either HR or SV.
Factors Influencing SV
Ventricular Preload
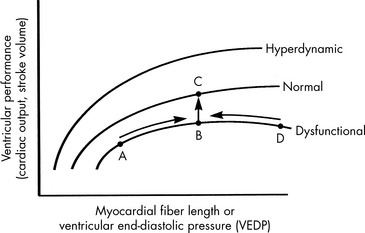
Preload is the amount of myocardial fiber stretch that is present before contraction. The significance of ventricular preload was first appreciated by Howell (in 1894), Frank (in 1894), and Starling (in 1914)242 in a series of experiments performed on isolated normal myocardial muscle preparations. Howell, Frank, and Starling observed that normal myocardium generates greater tension during contraction if it is stretched before contraction. This increase in the force of contraction occurs as a result of optimization of overlap between actin and myosin filaments in the sarcomere. These observations became known as the Frank-Starling law of the heart, which states that an increase in ventricular work, systolic tension, and SV results from an increase in presystolic stretch (preload). The graphic representation of the relationship between ventricular end-diastolic myocardial fiber length (usually approximated by ventricular end-diastolic pressure [VEDP]) and SV is the Frank-Starling curve, which is a ventricular (myocardial) function curve (Fig. 6-2).
To a point, as VEDP is increased, the force of contraction and myocardial fiber shortening should increase, and SV should rise.98 If, however, the ventricle is filled beyond a critical point, overlap of actin and myosin filaments is no longer optimal; ventricular dilation can result, and stroke volume decreases.47 Extremely high VEDPs (higher than approximately 25 cm H2O pressure when capillary permeability is normal, and lower pressures when capillary permeability is increased) result in pulmonary and systemic edema, and high pressures will compromise coronary and subendocardial blood flow.
A family of ventricular function curves can be constructed to illustrate the response of normal, depressed, or enhanced myocardial response to increased VEDP (see Fig. 6-2). If the patient demonstrates poor myocardial function, the ventricular function curve will be relatively flat, and a high VEDP will be required to produce even a modest improvement in myocardial function. If myocardial function is normal, a small increase in VEDP can produce a significant rise in SV or CO. If ventricular function is hyperdynamic, even nominal increases in VEDP will produce significant increases in SV or CO.
A goal of the treatment of any patient with cardiovascular dysfunction is to maximize SV and CO while minimizing adverse effects of fluid administration, such as pulmonary edema. An increase in SV and CO can be achieved by moving the patient to the highest point of an individual ventricular function curve (see Fig. 6-2) through judicious fluid administration. Improvement in SV and CO also can be achieved by altering the ventricular compliance, using vasodilator therapy. Further increase in SV and CO also can be achieved through improvement in cardiac contractility; this raises the ventricular function curve (see Fig. 6-2). Such an improvement can be attained by eliminating factors that normally depress myocardial function or by administering inotropic agents or vasodilators (discussed under Afterload).
RVEDP and CVP often can be estimated with careful clinical assessment of the level of hydration, liver size, palpation of the infant’s fontanelle, determination of presence (or absence) of systemic edema, and evaluation of the cardiac size on chest radiograph.275 Dry mucous membranes, a sunken fontanelle, and the absence of hepatomegaly are findings consistent with a normal or low central venous pressure. Hepatomegaly and periorbital edema usually are present once the CVP is elevated significantly. Systemic edema also may be noted despite a normal or low CVP if capillary leak or hypoalbuminemia is present. A high RVEDP and heart failure is often associated with cardiac enlargement on chest radiograph.
Left VEDP (LVEDP) is equal to left atrial pressure unless mitral valve disease is present. Reliable estimation of LVEDP is not possible through clinical assessment alone.275 Although the presence of pulmonary edema frequently is assumed to indicate the presence of a high LVEDP (exceeding 20 to 25 mm Hg), pulmonary edema may be observed at any (even a low) LVEDP if capillary leak is present.
Ventricular Compliance
Ventricular compliance refers to the distensibility of the ventricle. It is defined as the change in ventricular volume (in milliliters) for a given change in pressure (in millimeters of mercury), or ΔV/ΔP, and can be depicted graphically by a ventricular compliance curve (Fig. 6-3). The opposite of compliance is stiffness (ΔP/ΔV).
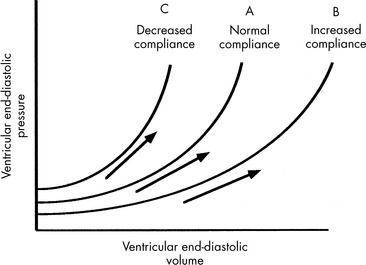
If the ventricle is extremely compliant, a large volume of fluid may be administered without producing a significant increase in VEDP (see Fig. 6-3, curve B). If the ventricle is dysfunctional (as occurs with restrictive cardiomyopathy) or hypertrophied, ventricular compliance usually is reduced (see Fig. 6-3, curve C). In this case, even a small volume of administered intravenous fluids will produce a significant rise in VEDP.268 The more dysfunctional and noncompliant the ventricle, the higher the resting VEDP and the VEDP needed to optimize SV and ventricular performance (see Fig. 6-2).
Ventricular compliance is not constant over all ranges of VEDP. Any ventricle is maximally compliant at low filling pressures. As the ventricle is filled, compliance is reduced because ventricular stretch may be maximal.55,169 Rapid volume infusion tends to raise VEDP more rapidly than gradual volume infusion. Compliant ventricles usually demonstrate a substantial improvement in SV when an intravenous fluid bolus is administered.
Vasodilator therapy will improve ventricular compliance. When these drugs are administered the compliance curve is altered, so a greater end-diastolic volume may be present without a substantial increase in VEDP (see Fig. 6-3). SV may then be increased without a rise in VEDP.
Compliance also is affected by ventricular size, pericardial space, and HR.55 Infants have small and relatively noncompliant ventricles, so the infant’s VEDP may rise sharply with minimal fluid volume administration. If the same volume (on a per-kilogram basis) is administered to an older child, a smaller change in VEDP will result because the ventricles are larger and more compliant in older children.
Ventricular Contractility
Although contractility can be measured in the laboratory, it is not easily isolated and measured in the clinical setting. The most common method of evaluating contractility at the bedside is echocardiographic evaluation of fiber-shortening times and measurement of the shortening fraction of left ventricular diameter. Shortening fraction is calculated by determining the difference between the end-diastolic and end-systolic dimensions. Normal shortening fraction is approximately 28% to 44%.206
If a thermodilution CO pulmonary artery catheter is in place, or if reliable Doppler CO estimations can be obtained, the nurse can create a ventricular function curve (see Fig. 6-2). If CO improves with no change in VEDP or HR, ventricular contractility or compliance has probably improved.
Afterload
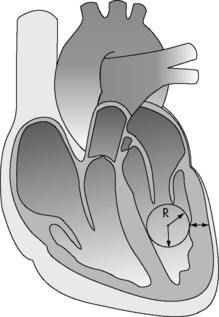
The major determinants of ventricular afterload or wall stress are: ventricular lumen radius, ventricular wall thickness (note that hypertrophy decreases afterload), and the ventricular intracavitary ejection pressure (Fig. 6-4). In the absence of left ventricular outflow tract obstruction (e.g., aortic stenosis), left ventricular ejection pressure will equal aortic and systemic arterial pressure. In the absence of right ventricular outflow tract obstruction (e.g., pulmonary stenosis), right ventricular ejection pressure will equal pulmonary arterial pressure. Systemic and pulmonary artery pressures in turn are determined by blood flow and resistance. Therefore in the absence of ventricular outflow tract obstruction or significant alterations in ventricular size or wall thickness, ventricular afterload is related primarily to the impedance provided by the pulmonary and systemic arterial circulations.
Oxygen Delivery
The ultimate function of the heart and lungs is to deliver oxygenated blood to the tissues. Systemic DO2 is the volume of oxygen (in milliliters) delivered to the tissues per minute. DO2(I) is the volume of oxygen delivered to the tissues per minute, indexed to body surface area (BSA), so that the units are milliliters per minute per square meter. DO2 is the product of arterial oxygen content (the amount of oxygen in arterial blood in milliliters per deciliter) the CO (in liters per minute), and a factor of 10. DO2(I) is the product of arterial oxygen content (in milliliters per deciliter), the cardiac index (in liters per minute per square meter), and a factor of 10 (see Fig. 6-1).
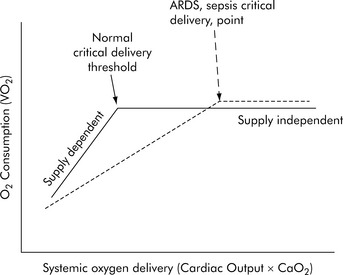
Under resting conditions with normal distribution of CO, oxygen delivery is more than adequate to meet the total oxygen requirements the tissues need to maintain aerobic metabolism, which is referred to as oxygen consumption (VO2). Excess oxygen delivery or oxygen reserve serves as a buffer, so a modest reduction in oxygen delivery will be more than adequately compensated by increased extraction of the delivered oxygen, without any significant reduction in oxygen consumption. During stress or vigorous exercise, oxygen consumption markedly increases, as does oxygen delivery. Therefore, under most conditions, the metabolic demands of the cells and tissues of the body dictate the level of oxygen delivery. However, little oxygen is stored in the cells and tissues of the body; therefore as oxygen delivery falls with critical illness, oxygen extraction must necessarily increase to meet metabolic demands, and oxygen consumption remains relatively constant (i.e., it is delivery independent; Fig. 6-5). However, there is a critical level of oxygen delivery at which the body’s compensatory mechanisms are no longer able to meet metabolic needs (i.e., the point at which oxygen extraction is maximal). Once oxygen delivery falls below this level, oxygen consumption must also fall and is said to become delivery dependent (see Fig. 6-5, Normal critical delivery threshold).
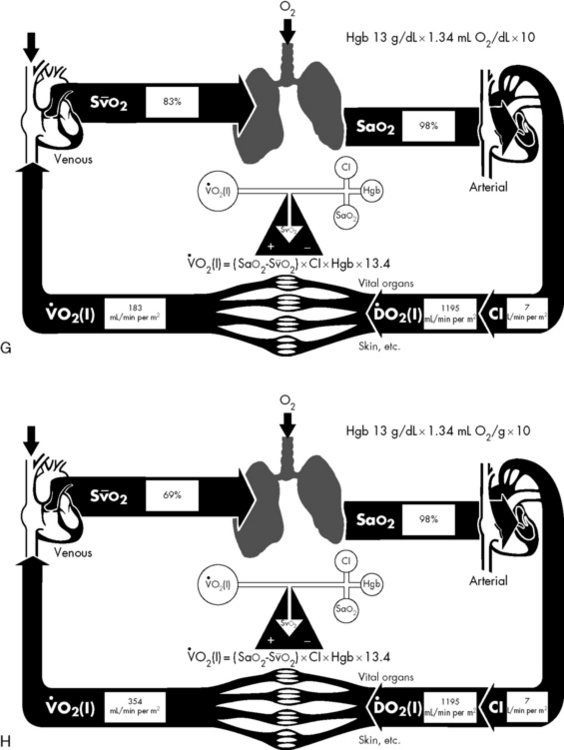
If either arterial oxygen content or CO falls without a commensurate and compensatory increase in the other component, oxygen delivery will fall (Fig. 6-6, A–H). For example, if arterial oxygen content falls (e.g., caused by a fall in hemoglobin concentration or its saturation), oxygen delivery can be maintained by a commensurate rise in CO. If CO falls, however, oxygen delivery will fall in direct correlation, because there is no way for arterial oxygen content to increase when CO falls.


Oxygen Content
The optimal hemoglobin threshold for erythrocyte (red blood cell) transfusion in critically ill children is unknown.160 Whereas transfusion is indicated in conditions of hemodynamic instability and anemia (hemoglobin <10 g/dL), once stability is achieved the threshold hemoglobin level for transfusion may need to be lowered. A recent multicenter trial demonstrated that in stable, critically ill children a hemoglobin threshold of 7 g/dL for red blood cell transfusion decreased transfusion requirements without increasing adverse outcome.160

Cardiac Output
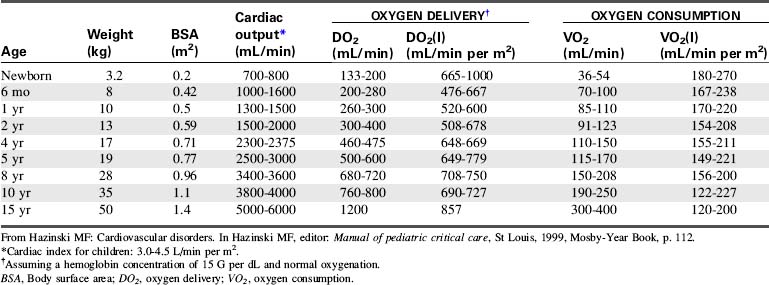
CO is the volume of blood ejected by the heart in 1 minute. CO is the product of HR and SV. CO may be recorded in liters per minute or milliliters per minute, although in children it is often normalized to BSA and recorded as the cardiac index (in milliliters per minute per square meter BSA). Normal cardiac index averages 3 to 4.5 mL/min per m2 BSA (Table 6-1).
Clinical Assessment of CO
Compensatory vasoconstriction can initially maintain BP (BP = CO × SVR). In fact, infants and children have high SVR and vasoactive capacity such that hypotension is a late sign of shock.53,245 This survival mechanism is designed to counterbalance the limited cardiac reserve in children.
Calculation and Estimation of CO
CO can be calculated using a thermodilution catheter placed in the pulmonary artery. Injection of an iced quantity of fluid into the right atrium will produce a temperature change in the pulmonary artery that is inversely related to the CO. Such thermodilution CO calculations can be performed using a pulmonary artery catheter with thermistor or a separate thermistor placed into the pulmonary artery at the time of cardiac surgery. Additional information about thermodilution CO calculation can be found in Chapter 21.
The CO can be continuously evaluated if the pulmonary artery catheter contains an oximeter for continuous evaluation of pulmonary artery (mixed venous) oxyhemoglobin saturation. Pulmonary artery catheterization is not commonly performed in pediatric critical care, although it may be indicated in certain situations that complicate shock resuscitation.276
Pulse contour intermittent and continuous CO (PiCCO®) monitoring is possible using a femoral or axillary arterial catheter and a central venous catheter. Algorithms use pulse contour analysis combined with intermittent thermodilution calculations. The arterial waveform contours are analyzed to assess SV and thereby cardiac index (CI). In a pediatric validation study, the PiCCO system provided continuous calculation of CI without the need to perform thermodilution injections with every calculation.90
Esophageal Doppler studies of blood flow velocity in the descending aorta have been used in adults for many years, and pediatric probes are now available. In the past, the higher HRs in children compromised reliability of this technique of CO evaluation. Fairly reliable CO calculations have recently been reported in children,270 although this method of CO evaluation is very operator dependent.3
CO and blood volume can be calculated from a form of ultrasound dilution. This technology uses a computer and arterial and venous sensors attached to a specialized extracorporeal tubing loop that is placed between an indwelling central venous and arterial catheter. A small bolus (0.5 to 1.0 mL/kg) of isotonic saline is injected into the central venous catheter to create a dilution curve. The saline dilutes the total blood protein concentration and alters blood velocity detected by the arterial sensor in the extracorporeal loop. The change in blood velocity over time can be graphed, and results in a dilution curve that is similar to that created during thermodilution CO calculations. In addition to calculating the CO and index, the ultrasound dilution computer calculates SV index, active circulating volume, SVR, and ejection fraction. This technology has been validated in neonates and children.157
Noninvasive measurement of CO in children is novel and evolving.128 Doppler ultrasonography is a simple, noninvasive method of assessing blood flow and is an accepted noninvasive method of deriving CO.118 Data obtained with Doppler ultrasonography correlate well with accepted standard hemodynamic methods in animal studies, adults, and neonates; formal validation is underway in children.37,65,128
Because adequate organ perfusion is the goal of supportive and therapeutic critical care, monitors that directly assess organ oxygenation offer the best possibility of improved recognition and treatment of circulatory abnormalities to reduce multiorgan dysfunction and related morbidity and mortality.260 Some of these monitors are presented in the next several sections
Relationship of Mixed Venous Oxygen Saturation to CO
A true mixed venous oxygen saturation is evaluated from blood in the pulmonary artery, because it includes a true mixed sample of systemic venous blood from the superior vena cava, inferior vena cava, and coronary circulations. The mixed venous oxygen saturation can be continuously monitored through the use of a pulmonary artery catheter that contains a pulmonary artery oximeter. If hemoglobin concentration and saturation and oxygen consumption or extraction are stable (these assumptions often cannot be made about the critically ill patient), the mixed venous oxygen saturation will vary directly with the CO (see Fig. 6-6).
When oxygen delivery falls, tissues compensate by increasing the amount of oxygen extraction from circulating blood.196 Mixed venous oxygen saturation is thus used as a measure of the balance between oxygen delivery and oxygen demand, and it will fall as the result of either decreased oxygen delivery (i.e., decreased arterial oxygen content; decreased CO, index, or both) or increased oxygen extraction (from increased demand, decreased delivery, or both). The normal mixed venous oxygen saturation is greater than 70%.196 Mixed venous oxygen saturation levels between 50% and 75% reflect compensatory increased extraction in cases of increased oxygen demand or decreased oxygen delivery, whereas levels between 30% and 50% reflect the beginning of lactic acidosis indicating exhaustion of compensatory extraction. A further decline to levels between 25% and 30% is indicative of severe lactic acidosis, and levels less than 25% probably reflect cellular death.196
The mixed venous oxygen saturation has been shown to be an effective indicator of the balance between oxygen supply and demand, and it is a useful guide for management in adults. However, its use is limited in pediatrics by the need for a pulmonary artery or central venous catheter for intermittent or continuous measurement; this is often not feasible, especially early in resuscitation.183
Use of Central Venous Oxygen Saturation Monitoring
The desire for easier venous oxygen saturation measurement has led to an assessment of central venous oxygen saturation (ScvO2). Unlike the pulmonary artery catheter samples that are composed of blood from all parts of the systemic venous circulation, including blood from the coronary sinus, ScvO2 is obtained from the superior vena cava, so it assesses only the oxygen delivery-oxygen consumption balance in the upper body.196 Many studies have examined how the two are related. Oxygen saturation of superior vena cava blood is approximately 70%, which is slightly lower than the saturation of blood in the inferior vena cava (75%). Coronary sinus blood, with an oxygen saturation of approximately 30% to 40%, is then added to the combined superior vena cava and inferior vena cava blood, so that a true mixed venous sample in the pulmonary artery (after mixing is complete) averages approximately 70% to 75% and corresponds to a mixed venous oxygen tension of 38 to 40 mm Hg. Thus the ScvO2 is normally approximately 2% to 3% higher than mixed venous oxygen saturation in healthy individuals.183 In shock states, however, the difference can range from 5% to 18%.37,183 Some studies have shown that although the two are not interchangeable, there is a good correlation in the trending of one to the other, and the ScvO2 correlates well with changes in systemic perfusion.81,132,183
Limitations of continuous ScvO2 monitoring are significant. Because sympathetic tone raises vascular resistance in splanchnic-mesenteric beds as CO falls, in shock states the effects of desaturated blood from those regions on ScvO2 may be blunted. As an extreme example, the renal blood flow may fall to 20% of its normal value because of intense renal vasoconstriction, with renal vein saturation falling from 85% to 25% while the ScvO2 remains above 60%.132
Near-Infrared Spectroscopy (NIRS)
NIRS is relatively new technology that is used to access regional tissue oxygenation as an indicator of tissue perfusion. Near-infrared light (700 to 1000 nm bandwidth) is transmitted through muscle, bone, tissue, and skin, and reflected light is then read by a sensor.183 The technology is similar to that used for pulse oximetry and continuous monitoring of ScvO2. This technology uses the difference in light absorption between deoxygenated hemoglobin versus oxygenated hemoglobin to calculate a percent saturation level. Because most blood is not in arteries but in capillaries and veins, the greatest quantitative contribution to the calculated light absorption of hemoglobin is from venous and capillary blood. Pulse oximeters attempt to subtract the nonpulsatile component of the light signal (i.e., contributed from veins and capillaries) to examine the absorption spectrum of arterial blood, whereas NIRS technology focuses on the total light signal. An NIRS device approved by the U.S. Food and Drug Administration (INVOS; Somanetics, Troy, MI) uses a dual-detector system to subtract a shallow light path from a deep light path, theoretically allowing the derivation of the average oxyhemoglobin saturation in a volume of tissue approximately 2.5 to 3.0 cm deep under the skin and the sensor. The device displays an approximation of venous-weighted hemoglobin saturation in tissue deep below the sensor. The parameter is displayed as a relative number from 0% to 100% using an algorithm calibrated from in vivo and in vitro cerebral models, and is termed regional oxygen saturation (rSO2).132
Because venous-weighted capillary blood represents the limiting oxygen tension for diffusion, NIRS provides a window to evaluate the oxygen economy in the monitored tissue bed or regional tissue oxyhemoglobin saturation.91,132 The use of NIRS technology to monitor oxygenation in the brain, muscle, liver, and kidney has been extensively described.91,132,133,228 Changes in tissue oxygen tension monitored by NIRS are sensitive indicators of perfusion-metabolism coupling, and regional NIRS monitoring can guide resuscitation from shock.66,132
The indication approved by the U.S. Food and Drug Administration for the INVOS device is for trend monitoring of regional saturation in the cerebral circulation, which has been widely modeled as a compartment with 75% venous blood, thus allowing validation of the device in an accepted clinical model. In animal models, brain rSO2 less than 40% is associated with intracellular anaerobic metabolism and depletion of high-energy phosphates.158 Clinical data in children and adults support the hypothesis that cerebral rSO2 less than 40% to 50%, or a change in baseline of more than 20%, is associated with hypoxic-ischemic neural injury.132,133,228
Blood Pressure
Arterial BP may be the most widely used and most widely misinterpreted parameter related to CO. Arterial BP is generated by the kinetic energy imparted by the heart and the interaction of blood flow, viscosity, systemic vascular tone, and downstream (venous) pressure. The major determinants of mean arterial BP are the SVR and CO. Peripheral and central arterial pressure differences result from differential impedances in the vascular system and are increased with nonuniform vasoconstriction. Noninvasive BP measurement by auscultation using a cuff and sphygmomanometer (mercury manometer) and noninvasive oscillometric BP measurements correlate well with indwelling intraarterial measurements under conditions of normal vascular resistance and blood flow, but “cuff” and invasive pressures frequently diverge under conditions of low and high SVR.132 Automated determination by cuff oscillometry shows good reproducibility and allows for determination of the mean pressure.
Although BP is rapidly and routinely measured, its relationship to CO or systemic perfusion is confounded by simultaneous changes in SVR. SVR tends to change in the opposite direction from CO; the sympathetic nervous system is activated by a falling BP, and sympathetic outflow is reduced and the parasympathetic system is activated with a rising BP. These responses are designed to minimize the variability in BP, making this parameter a late indicator of failing circulation. Similarly, resuscitation to a BP end point is often incomplete if the goal is to restore adequate CO and perfusion.276
Blood flow through a regional vascular bed is directly proportional to the organ perfusion pressure (ΔP), which is calculated as the difference between the arterial inflow pressure (Pa) and the venous outflow pressure (Pv): ΔP = Pa − Pv.53 With reasonable approximation and ignoring local extravascular effects, the inflow arterial pressure can be estimated to be the mean arterial pressure (MAP), and the outflow venous pressure can be estimated to be CVP:


Under ideal laminar flow conditions, vascular resistance is independent of flow and pressure; therefore an increase in vascular resistance will decrease blood flow, and a decrease in vascular resistance will increase blood flow for any given ΔP. Control mechanisms in the body generally maintain arterial and venous BPs within a narrow range; therefore changes in organ and tissue blood flow are primarily regulated by changes in vascular resistance. Resistance to blood flow within a vascular network is determined by the size of the vessels, the organization of the vascular network, physical characteristics of the blood, and extravascular forces acting on the vasculature.53
Shock states
Shock is a progressive condition of circulatory failure that results in inadequate CO and oxygen and substrate delivery to the tissues. Shock may be present in the patient with a low, normal, or high CO or index.245
Hypovolemic Shock
Etiology
Hypovolemia is the most common cause of shock in infants and children.245 Hypovolemic shock is best defined as a sudden decrease in the intravascular (blood) volume, relative to vascular capacity (i.e., inadequate intravascular volume relative to the vascular space), to such an extent that effective tissue perfusion cannot be maintained. Causes include hemorrhage from gastrointestinal disease or trauma, fluid and electrolyte loss, endocrine disease, and plasma loss.
Clinical Signs and Symptoms
Reliable indicators of early, compensated hypovolemic shock in children are persistent tachycardia, cutaneous vasoconstriction, and diminution of the pulse pressure (difference between systolic and diastolic BPs). Clinical evidence of decreased tissue perfusion includes skin mottling, prolonged capillary refill, and cool extremities. Systemic arterial BP is frequently normal, which is the result of increased SVR, making BP monitoring of limited value in managing the patient with compensated hypovolemic shock.132,245 Neurologic status is initially normal or only minimally impaired.
Although capillary refill has long been advocated as an important means of quickly and reliably assessing the level of hydration and circulatory status of acutely ill or injured children, there are several important limitations to the use of capillary refill in the assessment of circulatory status in children.23,112,297 It is necessary to account for the ambient temperature, in addition to the site of measurement, when interpreting the results.
On rare occasions, BP may be paradoxically elevated in children with hypovolemia.33 Recognition of this phenomenon is extremely important because some healthcare providers may be reluctant to provide appropriate fluid resuscitation for these patients because of fear of exacerbating the hypertension. Treatment of the hypertension, especially with β-blockers or calcium channel antagonists, may precipitate hypotension. Dehydrated, volume-depleted children with paradoxic hypertension should be given a trial of volume expansion; such therapy will cause little harm and could ameliorate the hypertension.
With continued loss of intravascular volume or with delayed or inadequate intravascular volume replacement, the intravascular fluid losses surpass the body’s compensatory abilities, causing circulatory failure and organ dysfunction. Pronounced systemic vasoconstriction and hypovolemia produce ischemia and hypoxia in the visceral and cutaneous circulations. Cellular metabolism and function are altered in these areas, resulting in damage to the blood vessels, kidneys, liver, pancreas, and bowel. SV and CO are decreased. The patient ultimately becomes hypotensive, acidotic, lethargic, or comatose, and oliguric or anuric. It is important to emphasize that arterial BP falls only after compensatory mechanisms are exhausted; this may be long after the precipitating event and only after a severe reduction in CO.243 Terminal phases of hypovolemic shock are characterized by myocardial dysfunction and widespread cell death.
Ischemia can develop in nonvital organs as a result of reduced circulating blood volume and preferential vasoconstriction. In skeletal muscle during shock, the normal intermittent perfusion pattern in capillary networks has been observed to transform to a marked maldistribution of flow, with cessation of blood flow in most capillaries.198,199 In addition to a low and irregular flow state in capillaries, recent findings have demonstrated a progressive narrowing of the capillary lumen during shock. The nearly 25% decrease in lumen diameter after 1 hour of shock principally results from swelling of endothelial cells; this significantly increases the capillary resistance to flow and contributes to further flow retardation.198,199 In addition, in a variety of organs impaired microcirculatory blood flow has been observed with reperfusion after a period of ischemia (no reflow or slow reflow). The causes of no reflow include red blood cell aggregation, leukocyte trapping, and edema of tissue and capillary endothelial cells.199
In any form of shock, including hypovolemic shock, the end result of hypoperfusion and tissue ischemia is cellular oxygen and nutrient deficiency that can affect the integrity of cell function and structure. Anaerobic metabolism results from the decrease in oxygen delivery, leading to glycogen depletion and lactate production. An increase in cytosolic calcium is also evident, which leads to an increase in membrane phospholipid hydrolysis and lysosomal membrane damage.295 This process eventually progresses to irreversible cellular injury and a host of inflammatory responses, which stimulate further tissue inflammation and injury. Ischemia or reperfusion can also induce expression of inflammatory genes in endothelial cells. In some hypovolemic animal models, fluid resuscitation leads to a decrease in the inflammatory cascade that was triggered by organ ischemia secondary to hypoperfusion.295 Because this inflammatory response is not likely to protect or repair organs from hypovolemic insult, downregulation of this inflammation seen with fluid resuscitation is likely to be beneficial.
Serum tonicity is important in both the presentation and the management of dehydration. In approximately 80% of cases of dehydration, patients have normal serum osmolality; 15% are hyperosmolar, and 5% are hypoosmolar.243 The serum sodium concentration can be used as a rough estimate of serum osmolality and dehydration, which is classified as hyponatremic, isonatremic, or hypernatremic (Box 6-1).
Stay updated, free articles. Join our Telegram channel

Full access? Get Clinical Tree


