Distinguish between nonprobability and probability samples and compare their advantages and disadvantages
 Identify and describe several types of sampling designs in quantitative studies
 Evaluate the appropriateness of the sampling method and sample size used in a study
 Identify phenomena that lend themselves to self-reports, observation, and physiologic measurement
 Describe various approaches to collecting self-report data (e.g., interviews, questionnaires, composite scales)
 Describe methods of collecting and recording observational data
 Describe the major features and advantages of biophysiologic measures
 Critique a researcher’s decisions regarding the data collection plan
 Describe approaches for assessing the reliability and validity of measures
 Define new terms in the chapter
Key Terms
 Biophysiologic measure
 Category system
 Checklist
 Closed-ended question
 Consecutive sampling
 Construct validity
 Content validity
 Convenience sampling
 Criterion validity
 Eligibility criteria
 Face validity
 Internal consistency
 Interrater reliability
 Interview schedule
 Likert scale
 Measurement
 Measurement property
 Nonprobability sampling
 Observation
 Open-ended question
 Patient-reported outcome (PRO)
 Population
 Power analysis
 Probability sampling
 Psychometric assessment
 Purposive sampling
 Questionnaire
 Quota sampling
 Rating scale
 Reliability
 Response options
 Response rate
 Response set bias
 Sample
 Sample size
 Sampling bias
 Sampling plan
 Scale
Scale
 Self-report
 Simple random sampling
 Strata
 Stratified random sampling
 Systematic sampling
 Test–retest reliability
 Validity
 Visual analog scale
This chapter covers two important research topics—how quantitative researchers select their study participants and how they collect data from them.
SAMPLING IN QUANTITATIVE RESEARCH
Researchers answer research questions using a sample of participants. In testing the effects of an intervention for pregnant women, nurse researchers reach conclusions without testing it with all pregnant women. Quantitative researchers develop a sampling plan that specifies in advance how participants will be selected and how many to include.
Basic Sampling Concepts
Let us begin by considering some terms associated with sampling.
Populations
A population (“P” in PICO questions) is the entire group of interest. For instance, if a researcher were studying American nurses with doctoral degrees, the population could be defined as all registered nurses (RNs) in the United States with a doctoral-level degree. Other populations might be all patients who had cardiac surgery in St. Peter’s Hospital in 2017 or all Australian children younger than age 10 years with cystic fibrosis. Populations are not restricted to people. A population might be all patient records in Memorial Hospital. A population is an entire aggregate of elements.
Researchers specify population characteristics through eligibility criteria. For example, consider the population of American nursing students. Does the population include part-time students? Are RNs returning to school for a bachelor’s degree included? Researchers establish criteria to determine whether a person qualifies as a member of the population (inclusion criteria) or should be excluded (exclusion criteria), for example, excluding patients who are severely ill.
Example of inclusion and exclusion criteria
Joseph and colleagues (2016) studied children’s sensitivity to sucrose detection (sweet taste). To be eligible, children had to be healthy and between the ages of 7 and 14 years. Children were excluded if they had a major medical illness, such as diabetes, heart disease, or asthma.
Quantitative researchers sample from an accessible population in the hope of generalizing to a target population. The target population is the entire population of interest. The accessible population is the portion of the target population that is accessible to the researcher. For example, a researcher’s target population might be all diabetic patients in the United States, but, in reality, the population that is accessible might be diabetic patients in a particular hospital.
Samples and Sampling
Sampling involves selecting a portion of the population to represent the population. A sample is a subset of population elements. In nursing research, the elements (basic units) are usually humans. Researchers work with samples rather than populations for practical reasons.
Information from samples can, however, lead to faulty conclusions. In quantitative studies, a criterion for judging a sample is its representativeness. A representative sample is one whose characteristics closely approximate those of the population. Some sampling plans are more likely to yield biased samples than others. Sampling bias is the systematic overrepresentation or underrepresentation of a population segment in terms of key characteristics.
Strata
Populations consist of subpopulations, or strata. Strata are mutually exclusive segments of a population based on a specific characteristic. For instance, a population consisting of all RNs in the United States could be divided into two strata based on gender. Strata can be used in sample selection to enhance the sample’s representativeness.
 | TIP The sampling plan is usually discussed in a report’s method section, sometimes in a subsection called “Sample” or “Study participants.” Sample characteristics (e.g., average age) are often described in the results section. |
Sampling Designs in Quantitative Studies
The two broad classes of sampling designs in quantitative research are probability sampling and nonprobability sampling.
Nonprobability Sampling
In nonprobability sampling, researchers select elements by nonrandom methods in which every element does not have a chance to be included. Nonprobability sampling is less likely than probability sampling to produce representative samples—and yet, most research samples in nursing and other disciplines are nonprobability samples.
Convenience sampling entails selecting the most conveniently available people as participants. A nurse who distributes questionnaires about vitamin use to college students leaving the library is sampling by convenience, for example. The problem with convenience sampling is that people who are readily available might be atypical of the population. The price of convenience is the risk of bias. Convenience sampling is the weakest form of sampling, but it is also the most commonly used sampling method.
Example of a convenience sample
Huang and coresearchers (2016) studied the effects of risk factors and coping style on the quality of life and depressive symptoms of adults with type 2 diabetes. A convenience sample of 241 adults was recruited from a hospital metabolic outpatient department.
In quota sampling, researchers identify population strata and figure out how many people are needed from each stratum. By using information about the population, researchers can ensure that diverse segments are represented in the sample. For example, if the population is known to have 50% males and 50% females, then the sample should have similar percentages. Procedurally, quota sampling is similar to convenience sampling: Participants are a convenience sample from each stratum. Because of this fact, quota sampling shares some weaknesses of convenience sampling. Nevertheless, quota sampling is a big improvement over convenience sampling and does not require sophisticated skills or a lot of effort. Surprisingly, few researchers use this strategy.
Example of a quota sample
Wang and coresearchers (2015) described the protocol for a study of the effects of a health program being implemented at a university in Singapore. The researchers plan to use a quota sample, stratifying participants based on the type of work they do (academic, administrative, support).
Consecutive sampling is a nonprobability sampling method that involves recruiting all people from an accessible population over a specific time interval or for a specified sample size. For example, in a study of ventilator-associated pneumonia in intensive care unit (ICU) patients, a consecutive sample might consist of all eligible patients who were admitted to an ICU over a 6-month period. Or it might be the first 250 eligible patients admitted to the ICU, if 250 were the targeted sample size. Consecutive sampling is often the best possible choice when there is “rolling enrollment” into an accessible population.
Example of a consecutive sample
Bryant and colleagues (2015) compared radiographic reports of feeding tube placement with images generated by an electromagnetic feeding tube placement device. The sample consisted of 200 consecutive patients who had feeding tubes inserted.
Purposive sampling involves using researchers’ knowledge about the population to handpick sample members. Researchers might decide purposely to select people judged to be knowledgeable about the issues under study. This method can lead to bias but can be a useful approach when researchers want a sample of experts.
Example of purposive sampling
Hewitt and Cappiello (2015) invited a purposively sampled panel of experts knowledgeable in the provision of reproductive health care to offer their viewpoints for identifying essential nursing competencies for prevention and care relating to unintended pregnancy.
 | HOW-TO-TELL TIP How can you tell what type of sampling design was used in a quantitative study? If the report does not explicitly mention or describe the sampling design, it is usually safe to assume that a convenience sample was used. |
Probability Sampling
Probability sampling involves random selection of elements from a population. With random sampling, each element in the population has an equal, independent chance of being selected. Random selection should not be (although it often is) confused with random assignment, which is a signature of an RCT (see Chapter 9). Random assignment to different treatment conditions has no bearing on how participants in the RCT were selected.
Simple random sampling is the most basic probability sampling. In simple random sampling, researchers establish a sampling frame—a list of population elements. If nursing students at the University of Connecticut were the population, a student roster would be the sampling frame. Elements in a sampling frame are numbered and then a table of random numbers or an online randomizer is used to draw a random sample of the desired size. Samples selected randomly are unlikely to be biased. There is no guarantee of a representative sample, but random selection guarantees that differences between the sample and the population are purely a function of chance. The probability of selecting a markedly atypical sample through random sampling is low and decreases as sample size increases.
Example of a simple random sample
Neta et al. (2015) studied adherence to foot self-care in patients with diabetes mellitus in Brazil. The population included 8,709 patients with type 2 diabetes. The researchers randomly sampled 368 of these patients.
In stratified random sampling, the population is first divided into two or more strata, from which elements are randomly selected. As with quota sampling, the aim of stratified sampling is to enhance representativeness.
Example of stratified random sampling
Buettner-Schmidt and colleagues (2015) studied the impact of smoking legislation on smoke pollution levels in bars and restaurants in North Dakota. A total of 135 venues were randomly sampled from three strata: restaurants, bars in communities with ordinances stronger than the state law, and bars not in such communities.
 | TIP Many large national studies use multistage sampling, in which large units are first randomly sampled (e.g., census tracts, hospitals), then smaller units are selected (e.g., individual people). |
Systematic sampling involves the selection of every kth case from a list, such as every 10th person on a patient list. Systematic sampling can be done so that an essentially random sample is drawn. First, the size of the population is divided by the size of the desired sample to obtain the sampling interval (the fixed distance between selected cases). For instance, if we needed a sample of 50 from a population of 5,000, our sampling interval would be 100 (5,000/50 = 100). Every 100th case on a sampling frame would be sampled, with the first case selected randomly. If our random number were 73, the people corresponding to numbers 73, 173, 273, and so on would be in the sample. Systematic sampling done in this manner is essentially the same as simple random sampling and is often convenient.
Example of a systematic sample
Ridout and colleagues (2014) studied the incidence of failure to communicate vital information as patients progressed through the perioperative process. From a population of 1,858 patient records in a health care system meeting eligibility criteria, the researchers selected every sixth case, for a sample of 294 cases.
Evaluation of Nonprobability and Probability Sampling
Probability sampling is the only viable method of obtaining representative samples. If all elements in a population have an equal chance of being selected, then the resulting sample is likely to do a good job of representing the population. Probability sampling also allows researchers to estimate the magnitude of sampling error, which is the difference between population values (e.g., the average age of the population) and sample values (e.g., the average age of the sample).
Nonprobability samples are rarely representative of the population—some segment of the population is likely to be underrepresented. When there is sampling bias, there is a chance that the results could be misleading. Why, then, are nonprobability samples used in most studies? Clearly, the advantage lies in their expediency: Probability sampling is often impractical. Quantitative researchers using nonprobability samples must be cautious about the inferences drawn from the data, and consumers should be alert to possible sampling biases.
 | TIP The quality of the sampling plan is of particular importance when the focus of the research is to obtain descriptive information about prevalence or average values for a population. National surveys almost always use probability samples. For studies whose purpose is primarily description, data from a probability sample is at the top of the evidence hierarchy for individual studies. |
Sample Size in Quantitative Studies
Sample size—the number of study participants—is a major concern in quantitative research. There is no simple formula to determine how large a sample should be, but larger is usually better than smaller. When researchers calculate a percentage or an average using sample data, the purpose is to estimate a population value, and larger samples have less sampling error.
Researchers can estimate how large their samples should be for testing hypotheses through power analysis. An example can illustrate basic principles of power analysis. Suppose we were testing an intervention to help people quit smoking; smokers would be randomized to an intervention or a control group. How many people should be in the sample? When using power analysis, researchers must estimate how large the group difference will be (e.g., group differences in daily number of cigarettes smoked). The estimate might be based on prior research. When expected differences are sizeable, a large sample is not needed to reveal group differences statistically, but when small differences are predicted, large samples are necessary. In our example, if a small-to-moderate group difference in postintervention smoking were expected, the sample size needed to test group differences in smoking, with standard statistical criteria, would be about 250 smokers (125 per group).
The risk of “getting it wrong” (statistical conclusion validity) increases when samples are too small: Researchers risk gathering data that will not support their hypotheses even when those hypotheses are correct. Large samples are no assurance of accuracy, though: With nonprobability sampling, even a large sample can harbor bias. The famous example illustrating this point is the 1936 U.S. presidential poll conducted by the magazine Literary Digest, which predicted that Alfred Landon would defeat Franklin Roosevelt by a landslide. A sample of about 2.5 million people was polled, but biases arose because the sample was drawn from telephone directories and automobile registrations during a Depression year when only the well-to-do (who favored Landon) had a car or telephone.
A large sample cannot correct for a faulty sampling design; nevertheless, a large nonprobability sample is better than a small one. When critiquing quantitative studies, you must assess both the sample size and the sample selection method to judge how good the sample was.
 | TIP The sampling plan is often one of the weakest aspects of quantitative studies. Most nursing studies use samples of convenience, and many are based on samples that are too small to provide an adequate test of the research hypotheses. |
Critiquing Sampling Plans
In coming to conclusions about the quality of evidence that a study yields, the sampling plan merits special scrutiny. If the sample is seriously biased or too small, the findings may be misleading or just plain wrong.
In critiquing a description of a sampling plan, you should consider whether the researcher has adequately described the sampling strategy. Ideally, research reports should describe the following:
 The type of sampling approach used (e.g., convenience, consecutive, random)
 The population and eligibility criteria for sample selection
 The sample size, with a rationale
 A description of the sample’s main characteristics (e.g., age, gender, clinical status, and so on)
A second issue is whether the researcher made good sampling decisions. We have stressed that a key criterion for assessing a sampling plan in quantitative research is whether the sample is representative of the population. You will never know for sure, of course, but if the sampling strategy is weak or if the sample size is small, there is reason to suspect some bias.
Even with a rigorous sampling plan, the sample may be biased if not all people invited to participate in a study agree to do so. If certain subgroups in the population decline to participate, then a biased sample can result, even when probability sampling is used. Research reports ideally should provide information about response rates (i.e., the number of people participating in a study relative to the number of people sampled) and about possible nonresponse bias—differences between participants and those who declined to participate (also sometimes referred to as response bias). In a longitudinal study, attrition bias should be reported.
Your job as reviewer is to come to conclusions about the reasonableness of generalizing the findings from the researcher’s sample to the accessible population and a broader target population. If the sampling plan is flawed, it may be risky to generalize the findings at all without replicating the study with another sample.
Box 10.1 presents some guiding questions for critiquing the sampling plan of a quantitative research report.
Box 10.1 Guidelines for Critiquing Quantitative Sampling Plans |
1. Was the population identified? Were eligibility criteria specified? 2. What type of sampling design was used? Was the sampling plan one that could be expected to yield a representative sample? 3. How many participants were in the sample? Was the sample size affected by high rates of refusals or attrition? Was the sample size large enough to support statistical conclusion validity? Was the sample size justified on the basis of a power analysis or other rationale? 4. Were key characteristics of the sample described (e.g., mean age, percentage of female)? 5. To whom can the study results reasonably be generalized? |
DATA COLLECTION IN QUANTITATIVE RESEARCH
Phenomena in which researchers are interested must be translated into data that can be analyzed. This section discusses the challenging task of collecting quantitative research data.
Overview of Data Collection and Data Sources
Data collection methods vary along several dimensions. One issue is whether the researcher collects original data or uses existing data. Existing records, for example, are an important data source for nurse researchers. A wealth of clinical data gathered for nonresearch purposes can be fruitfully analyzed to answer research questions.
Example of a study using records
Draughton Moret and colleagues (2016) explored factors associated with patients’ acceptance of nonoccupational postexposure HIV prophylaxis following a sexual assault. Data were obtained from forensic nursing charts.
Researchers most often collect new data. In developing a data collection plan, researchers must decide the type of data to gather. Three types have been frequently used by nurse researchers: self-reports, observations, and biophysiologic measures. Self-report data—also called patient-reported outcome (PRO) data—are participants’ responses to researchers’ questions, such as in an interview. In nursing studies, self-reports are the most common data collection approach. Direct observation of people’s behaviors and characteristics can be used for certain questions. Nurses also use biophysiologic measures to assess important clinical variables.
Regardless of type of data collected in a study, data collection methods vary along several dimensions, including structure, quantifiability, and objectivity. Data for quantitative studies tend to be quantifiable and structured, with the same information gathered from all participants in a comparable, prespecified way. Quantitative researchers generally strive for methods that are as objective as possible.
Self-Reports/Patient-Reported Outcomes
Structured self-report methods are used when researchers know in advance exactly what they need to know and can frame appropriate questions to obtain the needed information. Structured self-report data are collected with a formal, written document—an instrument. The instrument is known as an interview schedule when the questions are asked orally face-to-face or by telephone or as a questionnaire when respondents complete the instrument themselves.
Question Form and Wording
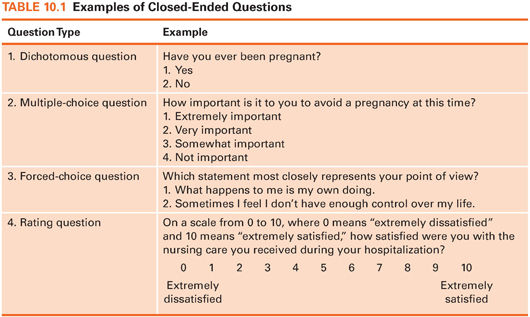
In a totally structured instrument, respondents are asked to respond to the same questions in the same order. Closed-ended (or fixed-alternative) questions are ones in which the response options are prespecified. The options may range from a simple yes or no to complex expressions of opinion. Such questions ensure comparability of responses and facilitate analysis. Some examples of closed-ended questions are presented in Table 10.1.
Stay updated, free articles. Join our Telegram channel

Full access? Get Clinical Tree


