Describe dimensions for interpreting quantitative research results
 Describe the mindset conducive to a critical interpretation of research results
 Identify approaches to an assessment of the credibility of quantitative results, and undertake such an assessment
 Distinguish statistical and clinical significance
 Identify some methods of drawing conclusions about clinical significance at the group and individual levels
 Critique researchers’ interpretation of their results in a discussion section of a report
 Define new terms in the chapter
Key Terms
 Benchmark
 Change score
 Clinical significance
 CONSORT guidelines
 Minimal important change (MIC)
 Results
In this chapter, we consider approaches to interpreting researchers’ statistical results, which requires consideration of the various theoretical, methodological, and practical decisions that researchers make in undertaking a study. We also discuss an important but seldom discussed topic: clinical significance.
INTERPRETATION OF QUANTITATIVE RESULTS
Statistical results are summarized in the “Results” section of a research article. Researchers present their interpretations of the results in the “Discussion” section. Researchers are seldom totally objective, though, so you should develop your own interpretations.
Aspects of Interpretation
Interpreting study results involves attending to six different but overlapping considerations, which intersect with the “Questions for Appraising the Evidence” presented in Box 2.1:
 The credibility and accuracy of the results
 The precision of the estimate of effects
 The magnitude of effects and importance of the results
 The meaning of the results, especially with regard to causality
 The generalizability of the results
 The implications of the results for nursing practice, theory development, or further research
Before discussing these considerations, we want to remind you about the role of inference in research thinking and interpretation.
Inference and Interpretation
An inference involves drawing conclusions based on limited information, using logical reasoning. Interpreting research findings entails making multiple inferences. In research, virtually everything is a “stand-in” for something else. A sample is a stand-in for a population, a scale score is a proxy for the magnitude of an abstract attribute, and so on.
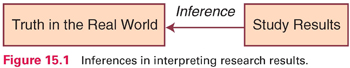
Research findings are meant to reflect “truth in the real world”—the findings are “stand-ins” for the true state of affairs (Fig. 15.1). Inferences about the real world are valid to the extent that the researchers have made good decisions in selecting proxies and have controlled sources of bias. This chapter offers several vantage points for assessing whether study findings really do reflect “truth in the real world.”
The Interpretive Mindset
Evidence-based practice (EBP) involves integrating research evidence into clinical decision making. EBP encourages clinicians to think critically about clinical practice and to challenge the status quo when it conflicts with “best evidence.” Thinking critically and demanding evidence are also part of a research interpreter’s job. Just as clinicians should ask, “What evidence is there that this intervention will be beneficial?” so must interpreters ask, “What evidence is there that the results are real and true”?
To be a good interpreter of research results, you can profit by starting with a skeptical (“show me”) attitude and a null hypothesis. The null hypothesis in interpretation is that the results are wrong and the evidence is flawed. The “research hypothesis” is that the evidence reflects the truth. Interpreters decide whether the null hypothesis has merit by critically examining methodologic evidence. The greater the evidence that the researcher’s design and methods were sound, the less plausible is the null hypothesis that the evidence is inaccurate.
CREDIBILITY OF QUANTITATIVE RESULTS
A critical interpretive task is to assess whether the results are right. This corresponds to the first question in Box 2.1: “What is the quality of the evidence—i.e., how rigorous and reliable is it?” If the results are not judged to be credible, the remaining interpretive issues (the meaning, magnitude, precision, generalizability, and implications of results) are unlikely to be relevant.
A credibility assessment requires a careful analysis of the study’s methodologic and conceptual limitations and strengths. To come to a conclusion about whether the results closely approximate “truth in the real world,” each aspect of the study—its design, sampling plan, data collection, and analyses—must be subjected to critical scrutiny.
There are various ways to approach the issue of credibility, including the use of the critiquing guidelines we have offered throughout this book and the overall critiquing protocol presented in Table 4.1. We share some additional perspectives in this section.
Proxies and Interpretation
Researchers begin with constructs and then devise ways to operationalize them. The constructs are linked to actual research strategies in a series of approximations; the better the proxies, the more credible the results are likely to be. In this section, we illustrate successive proxies using sampling concepts to highlight the potential for inferential challenges.
When researchers formulate research questions, the population of interest is often abstract. For example, suppose we wanted to test the effectiveness of an intervention to increase physical activity in low-income women. Figure 15.2 shows the series of steps between the abstract population construct (low-income women) and actual study participants. Using data from the actual sample on the far right, the researcher would like to make inferences about the effectiveness of the intervention for a broader group, but each proxy along the way represents a potential problem for achieving the desired inference. In interpreting a study, readers must consider how plausible it is that the actual sample reflects the recruited sample, the accessible population, the target population, and the population construct.
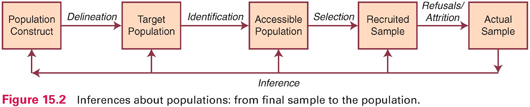
Table 15.1 presents a description of a hypothetical scenario in which the researchers moved from the population construct (low-income women) to a sample of 161 participants (recent welfare recipients from two neighborhoods in Los Angeles). The table identifies questions that could be asked in drawing inferences about the study results. Answers to these questions would affect the interpretation of whether the intervention really is effective with low-income women—or only with recent welfare recipients in Los Angeles who were cooperative with the research team.

Researchers make methodologic decisions that affect inferences, and these decisions must be scrutinized. However, prospective participants’ behavior also needs to be considered. In our example, 300 women were recruited for the study, but only 161 provided data. The final sample of 161 almost surely would differ in important ways from the 139 who declined, and these differences affect the study evidence.
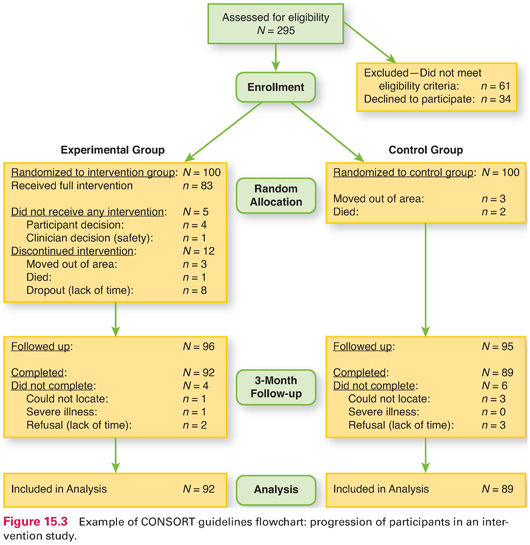
Fortunately, researchers are increasingly documenting participant flow in their studies—especially in intervention studies. Guidelines called the Consolidated Standards of Reporting Trials or CONSORT guidelines have been adopted by major medical and nursing journals to help readers track study participants. CONSORT flow charts, when available, should be scrutinized in interpreting study results. Figure 15.3 provides an example of such a flowchart for a randomized controlled trial (RCT). The chart shows that 295 people were assessed for eligibility, but 95 either did not meet eligibility criteria or refused to be in the study. Of the 200 study participants, half were randomized to the experimental group and the other half to the control group (N = 100 in each group). However, only 83 in the intervention group actually received the full intervention. At the 3-month follow-up, researchers attempted to obtain data from 96 people in the intervention group (everyone who did not move or die). They did get follow-up data from 92 in the intervention group (and 89 in the control group), and these 181 comprised the analysis sample.
Credibility and Validity
Inference and validity are inextricably linked. To be careful interpreters, readers must search for evidence that the desired inferences are, in fact, valid. Part of this process involves considering alternative competing hypotheses about the credibility and meaning of the results.
In Chapter 9, we discussed four types of validity that relate to the credibility of study results: statistical conclusion validity, internal validity, external validity, and construct validity. We use our sampling example (Fig. 15.2 and Table 15.1) to demonstrate the relevance of methodologic decisions to all four types of validity—and hence to inferences about study results.
In our example, the population construct is low-income women, which was translated into population eligibility criteria stipulating California public assistance recipients. Yet, there are alternative operationalizations of the population construct (e.g., California women living below the official poverty level). Construct validity, it may be recalled, involves inferences from the particulars of the study to higher order constructs. So it is fair to ask, Do the eligibility criteria adequately capture the population construct, low-income women?
Statistical conclusion validity—the extent to which correct inferences can be made about the existence of “real” group differences—is also affected by sampling decisions. Ideally, researchers would do a power analysis at the outset to estimate how large a sample they needed. In our example, let us assume (based on previous research) that the effect size for the exercise intervention would be small to moderate, with d = .40. For a power of .80, with risk of a Type I error set at .05, we would need a sample of about 200 participants. The actual sample of 161 yields a nearly 30% risk of a Type II error, i.e., wrongly concluding that the intervention was not successful.
External validity—the generalizability of the results—is affected by sampling. To whom would it be safe to generalize the results in this example—to the population construct of low-income women? to all welfare recipients in California? to all new welfare recipients in Los Angeles who speak English or Spanish? Inferences about the extent to which the study results correspond to “truth in the real world” must take sampling decisions and sampling problems (e.g., recruitment difficulties) into account.
Finally, the study’s internal validity (the extent to which a causal inference can be made) is also affected by sample composition. In this example, attrition would be a concern. Were those in the intervention group more likely (or less likely) than those in the control group to drop out of the study? If so, any observed differences in outcomes could be caused by individual differences in the groups (e.g., differences in motivation to stay in the study) rather than by the intervention itself.
Methodological decisions and the careful implementation of those decisions—whether they be about sampling, intervention design, measurement, research design, or analysis—inevitably affect the rigor of a study. And all of them can affect the four types of validity and hence the interpretation of the results.
Credibility and Bias
A researcher’s job is to translate abstract constructs into appropriate proxies. Another major job concerns efforts to eliminate, reduce, or control biases—or, as a last resort, to detect and understand them. As a reader of research reports, your job is to be on the lookout for biases and to consider them into your assessment about the credibility of the results.
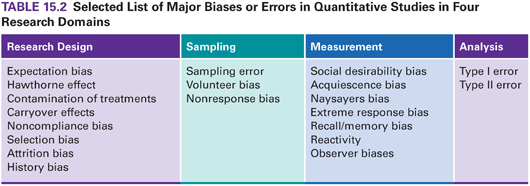
Biases create distortions and undermine researchers’ efforts to reveal “truth in the real world.” Biases are pervasive and virtually inevitable. It is important to consider what types of bias might be present and how extensive, sizeable, and systematic they are. We have discussed many types of bias in this book—some reflect design inadequacies (e.g., selection bias), others reflect recruitment problems (nonresponse bias), and others relate to measurement (social desirability). Table 15.2 presents biases and errors mentioned in this book. This table is meant to serve as a reminder of some of the problems to consider in interpreting study results.
 | TIP The supplement to this chapter on |

Credibility and Corroboration
Earlier, we noted that research interpreters should seek evidence to disconfirm the “null hypothesis” that research results are wrong. Some evidence to discredit this null hypothesis comes from the quality of the proxies that stand in for abstractions. Ruling out biases also undermines the null hypothesis. Another strategy is to seek corroboration for the results.
Corroboration can come from internal and external sources, and the concept of replication is an important one in both cases. Interpretations are aided by considering prior research on the topic, for example. Interpreters can examine whether the study results are congruent with those of other studies. Consistency across studies tends to discredit the “null hypothesis” of erroneous results.
Researchers may have opportunities for replication themselves. For example, in multisite studies, if the results are similar across sites, this suggests that something “real” is occurring. Triangulation can be another form of replication. We are strong advocates of mixed methods studies (see Chapter 13). When findings from the analysis of qualitative data are consistent with the results of statistical analyses, internal corroboration can be especially powerful and persuasive.
OTHER ASPECTS OF INTERPRETATION
If an assessment leads you to accept that the results of a study are probably “real,” you have made important progress in interpreting the study findings. Other interpretive tasks depend on a conclusion that the results are likely credible.
Results from statistical hypothesis tests indicate whether a relationship or group difference is probably “real.” A p value in hypothesis testing offers information that is important (whether the null hypothesis is probably false) but incomplete. Confidence intervals (CIs), by contrast, communicate information about how precise the study results are. Dr. David Sackett, a founding father of the EBP movement, and his colleagues (2000) said this about CIs: “P values on their own are . . . not informative. . . . By contrast, CIs indicate the strength of evidence about quantities of direct interest, such as treatment benefit. They are thus of particular relevance to practitioners of evidence-based medicine” (p. 232). It seems likely that nurse researchers will increasingly report CI information in the years ahead because of its value for interpreting study results and assessing their utility for nursing practice.
Magnitude of Effects and Importance
In quantitative studies, results that support the researcher’s hypotheses are described as significant. A careful analysis of study results involves evaluating whether, in addition to being statistically significant, the effects are large and clinically important.
Attaining statistical significance does not necessarily mean that the results are meaningful to nurses and clients. Statistical significance indicates that the results are unlikely to be due to chance—not that they are important. With large samples, even modest relationships are statistically significant. For instance, with a sample of 500, a correlation coefficient of .10 is significant at the .05 level, but a relationship this weak may have little practical relevance. This issue concerns an important EBP question (Box 2.1): “What is the evidence—what is the magnitude of effects?” Estimating the magnitude and importance of effects is relevant to the issue of clinical significance, a topic we discuss later in this chapter.
The Meaning of Quantitative Results
In quantitative studies, statistical results are in the form of p values, effect sizes, and CIs, to which researchers and consumers must attach meaning. Questions about the meaning of statistical results often reflect a desire to interpret causal connections. Interpreting what descriptive results mean is not typically a challenge. For example, suppose we found that, among patients undergoing electroconvulsive therapy (ECT), the percentage who experience an ECT-induced headache is 59.4% (95% CI [56.3, 63.1]). This result is directly interpretable. But if we found that headache prevalence is significantly lower in a cryotherapy intervention group than among patients given acetaminophen, we would need to interpret what the results mean. In particular, we need to interpret whether it is plausible that cryotherapy caused the reduced prevalence of headaches. In this section, we discuss the interpretation of research outcomes within a hypothesis testing context, with an emphasis on causal interpretations.
Interpreting Hypothesized Results
Interpreting statistical results is easiest when hypotheses are supported, i.e., when there are positive results. Researchers have already considered prior findings and theory in developing hypotheses. Nevertheless, a few caveats should be kept in mind.
It is important to avoid the temptation of going beyond the data to explain what results mean. For example, suppose we hypothesized that pregnant women’s anxiety level about childbearing is correlated with the number of children they have. The data reveal a significant negative relationship between anxiety levels and parity (r = −.40). We interpret this to mean that increased experience with childbirth results in decreased anxiety. Is this conclusion supported by the data? The conclusion appears logical, but in fact, there is nothing in the data that leads to this interpretation. An important, indeed critical, research precept is correlation does not prove causation. The finding that two variables are related offers no evidence suggesting which of the two variables—if either—caused the other. In our example, perhaps causality runs in the opposite direction, i.e., a woman’s anxiety level influences how many children she bears. Or maybe a third variable, such as the woman’s relationship with her husband, influences both anxiety and number of children. Inferring causality is especially difficult in studies that have not used an experimental design.
Empirical evidence supporting research hypotheses never constitutes proof of their veracity. Hypothesis testing is probabilistic. There is always a possibility that observed relationships resulted from chance—that is, that a Type I error has occurred. Researchers must be tentative about their results and about interpretations of them. Thus, even when the results are in line with expectations, researchers should draw conclusions with restraint.
Example of corroboration of a hypothesis
Houck and colleagues (2011) studied factors associated with self-concept in 145 children with attention deficit hyperactivity disorder (ADHD). They hypothesized that behavior problems in these children would be associated with less favorable self-concept, and they found that internalizing behavior problems were significantly predictive of lower self-concept scores. In their discussion, they stated that “age and internalizing behaviors were found to negatively influence the child’s self-concept” (p. 245).
Stay updated, free articles. Join our Telegram channel

Full access? Get Clinical Tree


