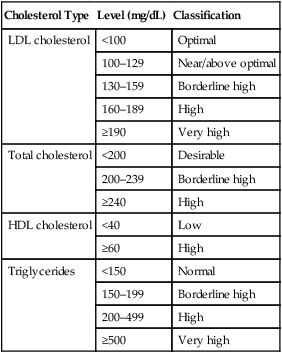
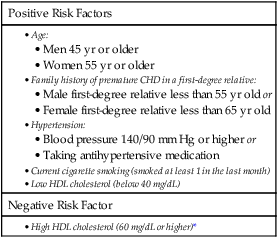
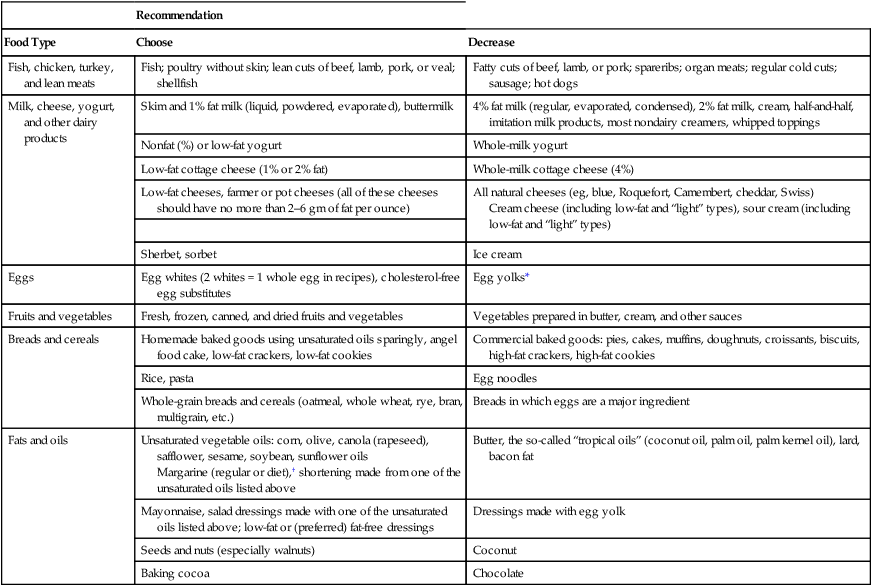
CHAPTER 50 Marshal Shlafer Our main topic for the chapter is drugs used to lower cholesterol. Drugs used to lower triglycerides are considered as well. Why focus on cholesterol? Because of its impact on coronary artery atherosclerosis (thickening of the coronary arteries), also known as coronary heart disease (CHD). Moderate CHD usually manifests first as anginal pain. Severe CHD sets the stage for acute coronary syndrome (ACS) and myocardial infarction (MI). In the United States, CHD is the leading killer of men and women, causing 406,000 deaths in 2007. According to the American Heart Association, about 16 million Americans have a history of coronary events (angina, MI, or both). More than half of these people are women. Additional sobering statistics are presented in Table 50–1. TABLE 50–1 The basic structure of lipoproteins is depicted in Figure 50–1. As indicated, lipoproteins are tiny, spherical structures that consist of a hydrophobic core, composed of cholesterol and triglycerides, surrounded by a hydrophilic shell, composed primarily of phospholipids. Because the hydrophilic shell completely covers the lipid core, the entire structure is soluble in the aqueous environment of the plasma. All lipoproteins have one or more apolipoprotein molecules embedded in their shell (see Fig. 50–1). Apolipoproteins, which constitute the protein component of lipoproteins, have three functions: • They serve as recognition sites for cell-surface receptors, and thereby allow cells to bind with and ingest lipoproteins. • They activate enzymes that metabolize lipoproteins. Of the six major classes of lipoproteins, three are especially important in coronary atherosclerosis. These classes are named (1) very-low-density lipoproteins (VLDLs), (2) low-density lipoproteins (LDLs), and (3) high-density lipoproteins (HDLs). Properties of these classes are summarized in Table 50–2. TABLE 50–2 Properties of the Plasma Lipoproteins That Affect Atherosclerosis *VLDL = very-low-density lipoprotein, LDL = low-density lipoprotein, HDL = high-density lipoprotein. • Attract monocytes from the circulation into the subendothelial space, after which the monocytes are converted to macrophages (which are critical to atherogenesis) • Inhibit macrophage mobility, thereby keeping macrophages at the site of atherogenesis • Undergo uptake by macrophages (macrophages do not take up LDLs that have not been oxidized) • Are cytotoxic, and hence can damage the vascular endothelium directly As macrophages engulf more and more cholesterol, they become large and develop large vacuoles. When macrophages assume this form, they are referred to as foam cells. Foam cell accumulation beneath the arterial epithelium produces a fatty streak, which makes the surface of the arterial wall lumpy, causing blood flow to become turbulent. Continued accumulation of foam cells can eventually cause rupture of the endothelium, thereby exposing the underlying tissue to the blood. This results in platelet adhesion and formation of microthrombi. As the process continues, smooth muscle cells migrate to the site, synthesis of collagen increases, and there can be repeated rupturing and healing of the endothelium. The end result is a mature atherosclerotic lesion, characterized by a large lipid core and a tough fibrous cap. In less mature lesions, the fibrous cap is not strong, and hence the lesions are unstable and more likely to rupture. As a result, arterial pressure and shear forces (from turbulent blood flow) can cause the cap to rupture. Accumulation of platelets at the site of rupture can rapidly cause thrombosis, and can thereby cause infarction. Infarction is less likely at sites of mature atherosclerotic lesions. The atherosclerotic process is depicted in Figure 50–2. It is important to appreciate that atherogenesis involves more than just deposition of lipids. In fact, atherogenesis is now considered primarily a chronic inflammatory process. When LDLs penetrate the arterial wall, they cause mild injury. The injury, in turn, triggers an inflammatory response that includes infiltration of macrophages, T lymphocytes, and other potentially noxious chemicals (eg, C-reactive protein [CRP]). In the late stage of the disease process, inflammation can weaken atherosclerotic plaque, leading to plaque rupture and subsequent thrombosis. The roles of inflammation and CRP in atherothrombosis are discussed further in Box 50–1. In 1988, the National Cholesterol Education Program (NCEP) began issuing guidelines on cholesterol detection and management. The most recent update was issued in 2001 and amended in 2004. A summary of the 2001 guidelines—Executive Summary of the Third Report of the National Cholesterol Education Program Expert Panel on Detection, Evaluation, and Treatment of High Blood Cholesterol in Adults (also known as Adult Treatment Panel III or simply ATP III)—was published in JAMA (Vol. 285, No. 19, 2486–2497, 2001) and is available online at www.nhlbi.nih.gov/guidelines/cholesterol/atp3xsum.pdf. The 2004 changes to the 2001 guidelines were published in Circulation (Vol. 110, 227–239, 2004) and are available online at www.nhlbi.nih.gov/guidelines/cholesterol/atp3upd04.pdf. Previous NCEP guidelines were issued in 1988 (ATP I) and 1993 (ATP II). The discussion below reflects recommendations in ATP III, including the 2004 updates. Management of high LDL cholesterol begins with screening, generally done every 5 years for adults over the age of 20. The ATP III guidelines recommend a more thorough screen than before, consisting of total cholesterol, LDL cholesterol, HDL cholesterol, and triglycerides (TGs). Blood for these tests should be drawn after fasting. Classification of total cholesterol and LDL cholesterol levels in ATP III (Table 50–3) is nearly identical to the older ATP II classifications. (The only change is that optimal LDL cholesterol is now defined in ATP III as less than 100 mg/dL, compared with less than 130 mg/dL under ATP II. In addition, the cutoff for low HDL cholesterol is now less than 40 mg/dL, up from less than 35 mg/dL under ATP II. TABLE 50–3 Health Classification of Blood Cholesterol and Triglyceride Levels* *Cholesterol values are from the Executive Summary of the Third Report of the National Cholesterol Education Program (NCEP) Expert Panel on Detection, Evaluation, and Treatment of High Blood Cholesterol in Adults (Adult Treatment Panel III). JAMA 285:2486–2497, 2001. Triglyceride values are from the National Heart, Lung, and Blood Institute of the National Institutes of Health. Elevated cholesterol in pediatric patients is a growing concern, and is not addressed in ATP III. However, it is addressed in other guidelines, including one created in 2011 by an expert panel appointed by the National Heart, Lung, and Blood Institute, and endorsed by the American Academy of Pediatrics. This report—Expert Panel on Integrated Guidelines for Cardiovascular Health and Risk Reduction in Children and Adolescents—is available online at www.nhlbi.nih.gov/guidelines/cvd_ped/summary.xhtml#chap9. When should testing be done? The guideline recommends lipid screening for all children between ages 9 and 11 years, followed by another screen between ages 18 and 21 years. For children with a family history of high cholesterol or heart disease, screening should start sooner: between ages 2 and 8 years. Cholesterol classification for children and adolescents is presented in Table 50–4. TABLE 50–4 NCEP Classification of Cholesterol Levels for Children and Adolescents* *HDL levels should be greater than or equal to 35 mg/dL and triglycerides should be less than or equal to 150 mg/dL. Data from National Cholesterol Education Program: Report of the Expert Panel on Blood Cholesterol Levels in Children and Adolescents. Pediatrics 89(3 Pt 2):525–584, 1992. Major risk factors that modify LDL treatment goals are summarized in Table 50–5. The table lists five positive risk factors (advancing age, family history of premature CHD, hypertension, cigarette smoking, and low HDL cholesterol) and one negative risk factor (high HDL cholesterol). (LDL itself is not listed because the reason for counting these risk factors is to modify treatment of high LDL.) For the purpose of CHD risk assessment, each positive factor counts as 1 point; if the patient has high HDL cholesterol (a negative risk factor), 1 point is subtracted. For example, if the subject were a 62-year-old female hypertensive smoker with an HDL level of 62 mg/dL, her point total score would be 2 (3 points for the three positive risk factors minus 1 point for the one negative risk factor). TABLE 50–5 Major Risk Factors (Other Than High LDL Cholesterol) That Modify LDL Treatment Goals *High HDL cholesterol (60 mg/dL or higher) is protective, and hence counts as a “negative” risk factor; its presence removes one risk factor from the total count. From the Executive Summary of the Third Report of the National Cholesterol Education Program (NCEP) Expert Panel on Detection, Evaluation, and Treatment of High Blood Cholesterol in Adults (Adult Treatment Panel III). JAMA 285:2486–2497, 2001. Box 50–1 discusses one additional factor—C-reactive protein (CRP)—that could aid with CHD risk prediction. ATP III defines three 10-year risk categories: more than 20%, 10% to 20%, and less than 10%. Some people are automatically in the highest risk group—specifically, those with existing CHD (or other forms of atherosclerotic disease) and those with diabetes. For all other people, 10-year risk must be calculated. The instrument employed most often is the Framingham Risk Prediction Score, which takes five factors into account: age, total cholesterol, HDL cholesterol, smoking status, and systolic blood pressure. These are similar to risk factors noted above. Framingham scores can be determined using either (1) the tables for men and women shown in Figure 50–3 or (2) a web-based risk calculator, such as the one provided by the NCEP at hp2010.nhlbihin.net/atpiii/calculator.asp. Under ATP III, there are four categories of CHD risk, labeled I, II, III, and IV (Table 50–6). People in category I are at highest risk: Their risk of a major coronary event within 10 years is over 20%. In comparison, the 10-year risk for people in category IV is low—less than 10%. TABLE 50–6 LDL Cholesterol Goals and Therapeutic Interventions for People in Specific CHD Risk Categories *TLCs = therapeutic lifestyle changes. †CHD risk equivalents include diabetes, forms of atherosclerosis other than CHD (eg, peripheral arterial disease, symptomatic coronary artery disease), and any combination of risk factors that creates a 10-year Framingham Risk Prediction Score of greater than 20%. ‡For patients at very high risk (eg, those with a recent heart attack or those with CV disease combined with diabetes), the LDL goal may be set at less than 70 mg/dL, rather than 100 mg/dL. §When LDL-lowering drugs are used in patients at high risk or moderately high risk, treatment should be sufficient to decrease the LDL level by 30% to 40%. ¶Almost all people with 0 to 1 risk factor and no CHD have a 10-year risk below 10%, and hence formal evaluation of 10-year risk is not needed. Modified from the Executive Summary of the Third Report of the National Cholesterol Education Program (NCEP) Expert Panel on Detection, Evaluation, and Treatment of High Blood Cholesterol in Adults (Adult Treatment Panel III). JAMA 285:2486–2497, 2001; as updated in Implications of Recent Clinical Trials for the National Cholesterol Education Program Adult Treatment Panel III Guidelines. Circulation 110:227–239, 2004. Category assignment is based on (1) the presence or absence of CHD (or a CHD risk equivalent, such as diabetes), (2) the number of risk factors the individual has (other than high LDL cholesterol), and (3) the individual’s 10-year Framingham Risk Prediction Score. Although this assessment sounds complicated, it’s not. Let’s consider the hypothetical case of Ralph J.—and follow along by looking at Figure 50–3. Mr. J. is 62 years old, hypertensive, and smokes—but, remarkably, his HDL cholesterol is high (above 60 mg/dL). He has no family history of premature CHD, does not have CHD himself, and does not have diabetes. His 10-year Framingham Risk Prediction Score is 11%. What CHD risk category does he belong in? Well, his age, blood pressure, and smoking status represent three major risk factors, but his high (healthy) HDL cholesterol allows subtraction of one risk factor, leaving a net of two risk factors. The presence of two major risk factors plus the 11% Framingham score place Mr. J. in CHD risk category II (the next to highest risk group). Pretty easy, huh? And even easier if you use an online computational tool, such as the ones available at www.framinghamheartstudy.org/risk/index.html. Treatment of high LDL cholesterol is based on the individual’s CHD risk category: The greater the 10-year risk, the more aggressive the treatment. As CHD risk increases, the target LDL goal gets lower, as does the LDL level at which treatment should commence. For example, among individuals in risk category I, the LDL goal is quite low (below 100 mg/dL—or below 70 in people at highest risk), compared with the higher goal (below 160 mg/dL) for people in category IV. Similarly, for individuals in category I, drugs are recommended if the LDL level is 100 mg/dL or above, compared with a much higher value (190 mg/dL or above) for those in category IV. Table 50–6 summarizes the LDL goal and the LDL levels at which to initiate treatment for people in all four CHD risk categories. This diet has two objectives: (1) reducing LDL cholesterol and (2) establishing and maintaining a healthy weight. The central feature of the diet is reduced intake of cholesterol and saturated fats: Individuals should limit intake of cholesterol to 200 mg/day or less and intake of saturated fat to 7% or less of total calories. Intake of trans fats—found primarily in crackers, commercial baked goods, and French fries—should be minimized. (Many food manufacturers are adding “no trans fat” labels to their product labels, making shopping somewhat easier.) ATP III recommendations for cholesterol, fats, and other nutrients are summarized in Table 50–7. A list of specific foods to choose, eat in moderation, or avoid, appears in Table 50–8. TABLE 50–7 Nutrient Composition of the TLC Diet Described in ATP III TLC = therapeutic lifestyle changes. *Trans–fatty acids should be kept to a minimum. †Carbohydrates should be derived mainly from foods rich in complex carbohydrates, such as fruits, vegetables, and grains (especially whole grains). ‡Daily energy expenditure should include at least moderate physical activity (contributing about 200 kcal/day). From the Executive Summary of the Third Report of the National Cholesterol Education Program (NCEP) Expert Panel on Detection, Evaluation, and Treatment of High Blood Cholesterol in Adults (Adult Treatment Panel III). JAMA 285:2486–2497, 2001. TABLE 50–8 Recommended Dietary Modifications to Lower Serum Cholesterol *Author’s note: Consuming up to 1 egg/day is not associated with an increased risk of fatal or nonfatal MI or ischemic or hemorrhagic stroke, except possibly in people with diabetes. †Author’s note: Since the publication of this table in 1988, new evidence indicates that stick margarine (but probably not newer low-fat spreads), which contains 17% trans fat, raises LDL cholesterol and lowers HDL cholesterol, and hence should not be recommended. From the National Cholesterol Education Program Adult Treatment Panel report. Arch Intern Med 148:36, 1988. If the basic TLC diet fails to lower LDL cholesterol adequately, ATP III recommends two additional measures: increased intake of soluble fiber (10 to 25 gm/day; oatmeal is a good source) and increased intake of plant stanols and sterols (2 gm/day). Plant stanols and sterols are cholesterol-lowering chemicals found (albeit in very small amounts) in certain vegetable oils (eg, canola), nuts (walnuts are a good source), certain fruits, and most beans and many other vegetables. They are also found in some of the cholesterol-lowering margarines, commonly advertised as “buttery spreads” (see below under Plant Stanol and Sterol Esters).
Prophylaxis of coronary heart disease: drugs that help normalize cholesterol and triglyceride levels


Plasma lipoproteins
Structure and function of lipoproteins
Basic structure.
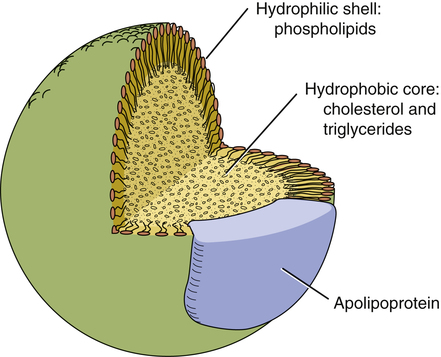
 Basic structure of plasma lipoproteins.
Apolipoproteins.
Classes of lipoproteins

Lipoprotein Class*
Major Core Lipids
Apolipoproteins
Transport Function
Influence on Atherosclerosis
VLDL
Triglycerides
B-100, E, others
Delivery of triglycerides to nonhepatic tissues
Probably contribute to atherosclerosis
LDL
Cholesterol
B-100
Delivery of cholesterol to nonhepatic tissues
Definitely contribute to atherosclerosis
HDL
Cholesterol
A-I, A-II, A-IV
Transport of cholesterol from nonhepatic tissues back to the liver
Protect against atherosclerosis

Role of LDL cholesterol in atherosclerosis
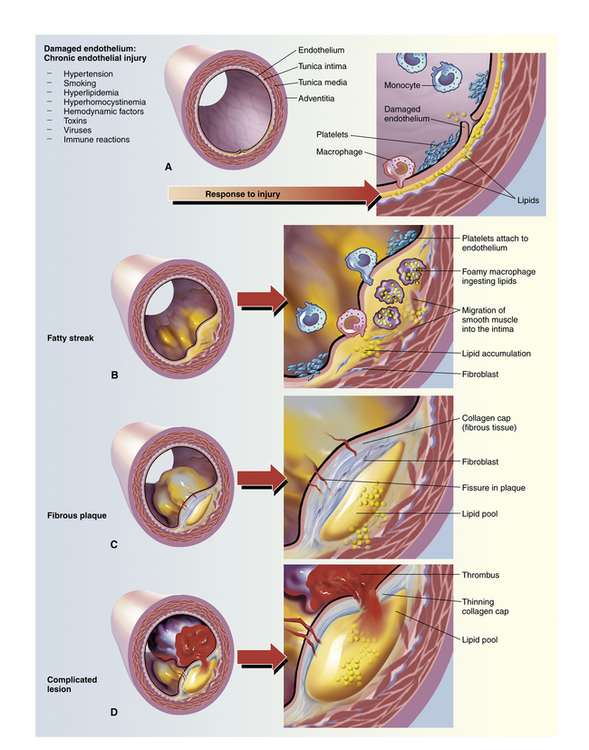
 Progression of atherosclerosis.
A, Damaged endothelium. B, Diagram of fatty streak and lipid core formation. C, Diagram of fibrous plaque. Raised plaques are visible: some are yellow and some are white. D, Diagram of a complicated lesion, showing a thrombus (in red) and collagen (in blue). (From McCance KL, Huether SE: Pathophysiology: The Biologic Basis for Disease in Adults and Children, 5th ed. St. Louis: Elsevier Mosby, 2006.)
Detection, evaluation, and treatment of high cholesterol: recommendations from ATP III
Cholesterol screening
Adults

Cholesterol Type
Level (mg/dL)
Classification
LDL cholesterol
<100
Optimal
100–129
Near/above optimal
130–159
Borderline high
160–189
High
≥190
Very high
Total cholesterol
<200
Desirable
200–239
Borderline high
≥240
High
HDL cholesterol
<40
Low
≥60
High
Triglycerides
<150
Normal
150–199
Borderline high
200–499
High
≥500
Very high
Children and adolescents

Category
Total Cholesterol (mg/dL)
LDL Cholesterol (mg/dL)
Acceptable
<170
<110
Borderline
170–199
110–129
Elevated
≥200
≥130
CHD risk assessment
Factors in risk assessment
Identifying CHD risk factors.

Positive Risk Factors
Negative Risk Factor
Calculating 10-year CHD risk.
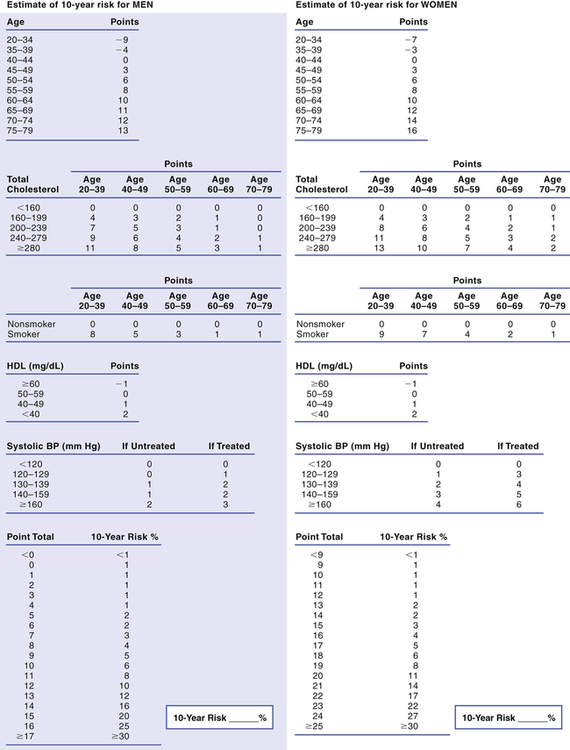
 Tables for calculating Framingham Risk Prediction Scores.
To determine an individual’s 10-year risk of developing clinical coronary disease, simply circle the appropriate points for each of the five risk factors considered (age, total cholesterol, smoking status, HDL cholesterol, and systolic blood pressure) and then add up the points. The point total indicates the 10-year risk. For example, a total of 13 points indicates a 10-year risk of 12% for men. (Framingham scores can also be determined using a web-based calculator, such as the one provided by the NCEP at hp2010.nhlbihin.net/atpiii/calculator.asp.)
Identifying an individual’s chd risk category

CHD Risk Category
LDL Goal
LDL Level at Which to Initiate TLCs*
LDL Level at Which to Consider Drug Therapy
I High Risk: Has CHD or a CHD risk equivalent† (10-year risk is >20%)
<100 mg/dL (with an optional goal of <70 mg/dL)‡
Any level
≥100 mg/dL (at <100 mg/dL, LDL-lowering drugs are optional)§
II Moderately High Risk: Has 2 or more risk factors, but not CHD, and 10-year risk is 10–20%
<130 mg/dL (with an optional goal of <100 mg/dL)
Any level
≥130 mg/dL (between 100 and 129 mg/dL, LDL-lowering drugs are optional)§
III Moderate Risk: Has 2 or more risk factors, but not CHD, and 10-year risk is <10%
<130 mg/dL
≥130 mg/dL
≥160 mg/dL
IV Low to Moderate Risk: Has 0–1 risk factor, but not CHD (10-year risk is probably <10%)¶
<160 mg/dL
≥160 mg/dL
≥190 mg/dL (between 160 and 189 mg/dL, LDL-lowering drugs are optional)

Treatment of high LDL cholesterol
Therapeutic lifestyle changes
The TLC diet.

Nutrient
Recommended Intake
Cholesterol
Less than 200 mg/day
Saturated fat*
Less than 7% of total calories
Polyunsaturated fat
Up to 10% of total calories
Monounsaturated fat
Up to 20% of total calories
Total fat
25%–35% of total calories
Carbohydrates†
50%–60% of total calories
Protein
About 15% of total calories
Fiber
20–30 gm/day
Total calories
Balance energy intake and expenditure‡ to maintain a desirable body weight or prevent weight gain

Recommendation
Food Type
Choose
Decrease
Fish, chicken, turkey, and lean meats
Fish; poultry without skin; lean cuts of beef, lamb, pork, or veal; shellfish
Fatty cuts of beef, lamb, or pork; spareribs; organ meats; regular cold cuts; sausage; hot dogs
Milk, cheese, yogurt, and other dairy products
Skim and 1% fat milk (liquid, powdered, evaporated), buttermilk
4% fat milk (regular, evaporated, condensed), 2% fat milk, cream, half-and-half, imitation milk products, most nondairy creamers, whipped toppings
Nonfat (%) or low-fat yogurt
Whole-milk yogurt
Low-fat cottage cheese (1% or 2% fat)
Whole-milk cottage cheese (4%)
Low-fat cheeses, farmer or pot cheeses (all of these cheeses should have no more than 2–6 gm of fat per ounce)
All natural cheeses (eg, blue, Roquefort, Camembert, cheddar, Swiss)
Cream cheese (including low-fat and “light” types), sour cream (including low-fat and “light” types)
Sherbet, sorbet
Ice cream
Eggs
Egg whites (2 whites = 1 whole egg in recipes), cholesterol-free egg substitutes
Egg yolks*
Fruits and vegetables
Fresh, frozen, canned, and dried fruits and vegetables
Vegetables prepared in butter, cream, and other sauces
Breads and cereals
Homemade baked goods using unsaturated oils sparingly, angel food cake, low-fat crackers, low-fat cookies
Commercial baked goods: pies, cakes, muffins, doughnuts, croissants, biscuits, high-fat crackers, high-fat cookies
Rice, pasta
Egg noodles
Whole-grain breads and cereals (oatmeal, whole wheat, rye, bran, multigrain, etc.)
Breads in which eggs are a major ingredient
Fats and oils
Unsaturated vegetable oils: corn, olive, canola (rapeseed), safflower, sesame, soybean, sunflower oils
Margarine (regular or diet),† shortening made from one of the unsaturated oils listed above
Butter, the so-called “tropical oils” (coconut oil, palm oil, palm kernel oil), lard, bacon fat
Mayonnaise, salad dressings made with one of the unsaturated oils listed above; low-fat or (preferred) fat-free dressings
Dressings made with egg yolk
Seeds and nuts (especially walnuts)
Coconut
Baking cocoa
Chocolate
< div class='tao-gold-member'>
![]()
Stay updated, free articles. Join our Telegram channel

Full access? Get Clinical Tree


Prophylaxis of coronary heart disease: drugs that help normalize cholesterol and triglyceride levels
Only gold members can continue reading. Log In or Register to continue
Get Clinical Tree app for offline access

