Principles of Electrocardiography
Learning Objectives
1. Define, spell, and pronounce the terms listed in the vocabulary.
2. Apply critical thinking skills in performing the patient assessment and patient care.
3. Illustrate the electrical conduction system through the heart.
4. Explain the concepts of cardiac polarization, depolarization, and repolarization.
5. Identify the PQRST complex on an electrocardiographic tracing.
6. Summarize the properties of the electrocardiograph.
7. Describe the electrical views of the heart recorded by the 12-lead electrocardiograph.
8. Discuss the process of recording an electrocardiogram.
9. Perform an accurate recording of the electrical activity of the heart.
10. Compare and contrast electrocardiographic artifacts and the probable cause of each.
11. Identify a typical electrocardiograph tracing.
12. Describe common electrocardiographic arrhythmias.
13. Summarize cardiac diagnostic tests.
14. Fit a patient with a Holter monitor.
15. Discuss the legal and ethical issues involved when performing ECGs.
Vocabulary
atria The two upper chambers of the heart.
atrioventricular (AV) node The part of the cardiac conduction system between the atria and the ventricles.
bundle of His Specialized muscle fibers that conduct electrical impulses from the AV node to the ventricular myocardium.
cardiac arrest A condition in which cardiac contractions stop completely.
cardioversion The use of electroshock to convert an abnormal cardiac rhythm to a normal one.
defibrillator A machine that delivers an electroshock to the heart through electrodes placed on the chest wall.
ectopic (ek-tohp′-ik) Originating outside the normal tissue.
infarction An area of tissue that has died from lack of blood supply.
ischemia (is-ke′-mia) Decreased blood flow to a body part or organ, caused by constriction or blockage of the supplying artery.
myocardial (my-oh-kar′-de-uhl) Pertaining to the heart muscle.
palpitations A pounding or racing of the heart; may or may not indicate a serious heart disorder.
sinoatrial (SA) node The pacemaker of the heart; it is located in the right atrium.
systole The contraction of the heart.
ventricles The two lower chambers of the heart.
Scenario
Martha Reyes has worked for almost 4 years at a local family practice office, but she has decided to take a new position in the cardiology practice next door, where she will be working for Dr. Julie Lee. Martha is very enthusiastic about the new position, but she realizes that she has a great deal to learn to provide the best patient service possible in Dr. Lee’s practice. Although Martha is familiar with general cardiology practices from her previous employment, she must understand and be able to perform procedures performed for cardiac patients, especially electrocardiography.
While studying this chapter, think about the following questions:
• How does an electrocardiography (ECG) machine work?
• How should a patient be prepared for an electrocardiogram?
• How will Martha perform an ECG diagnostic procedure?
• What is the normal appearance of ECG complexes?
• What are the characteristics of common ECG arrhythmias that Martha must be able to recognize?
• What additional cardiac tests should Martha be prepared to assist with and explain to patients?
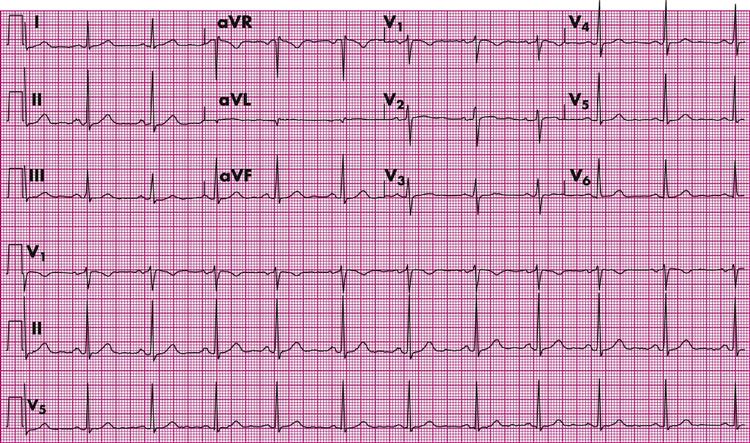
Electrocardiography is a painless, safe procedure and is the test most frequently used for the diagnosis of heart disease in the ambulatory care setting. In electrocardiography, electrodes are attached to the patient’s skin and connected to wires that go to the electrocardiograph. Electrocardiography amplifies the electrical impulses from the beating heart, and a pattern of these impulses is recorded on electrocardiographic paper. This record is called the electrocardiogram (ECG). The ECG is read and evaluated by the physician and becomes a part of the patient’s medical record (Figure 49-1). Medical practices using electronic medical records can record an ECG tracing directly into the patient’s electronic record.
To accurately represent the true cardiac activity, the ECG must be performed with a high degree of accuracy and skill. A medical assistant must have an understanding of both the normal cardiac function and the relationship of the ECG recordings to cardiac function. The medical assistant is responsible for ensuring that the patient is prepared mentally and physically for the test and that the equipment is set up properly. When performing electrocardiography, the medical assistant must be able to recognize problems with the recording and make appropriate corrections so that the physician has a clear record of the patient’s cardiac activity. The goal is to obtain the most accurate ECG possible.
The Electrical Conduction System of the Heart
The Cardiac Cycle
The cardiac cycle includes all the events that occur in the heart during one single heartbeat. Each chamber of the heart goes through two phases during the cardiac cycle: systole and diastole. During systole, both the atria and the ventricles contract and empty of blood. During diastole, the relaxation phase of the heart, the chambers refill with blood. Venous blood from the inferior and superior venae cavae empties into the right atrium during atrial diastole. As the right atrium fills, increased pressure in the chamber causes the tricuspid valve to open, and the right ventricle begins to fill. At the same time, blood returning from the lungs via the pulmonary veins fills the left atrium, causing the mitral valve to open, emptying blood into the left ventricle. Before systole occurs, the ventricles are already 70% filled. The cardiac cycle for a healthy adult lasts approximately 0.8 second. However, the amount of time it takes for the heart to empty and refill depends on many factors, including the condition of the myocardium and the heart’s electrical system.
The electrocardiograph records both the intensity of the electrical impulses and the actual time it takes for each part of the cardiac cycle to occur. It measures the electrical conductive impulses of the heart muscle, allowing the physician to see any disturbances or disruptions in normal heart activity. In addition to being recorded as an ECG, the cardiac cycle can appear as a continuously moving pattern on a monitor screen, accompanied by a sound for each beat.
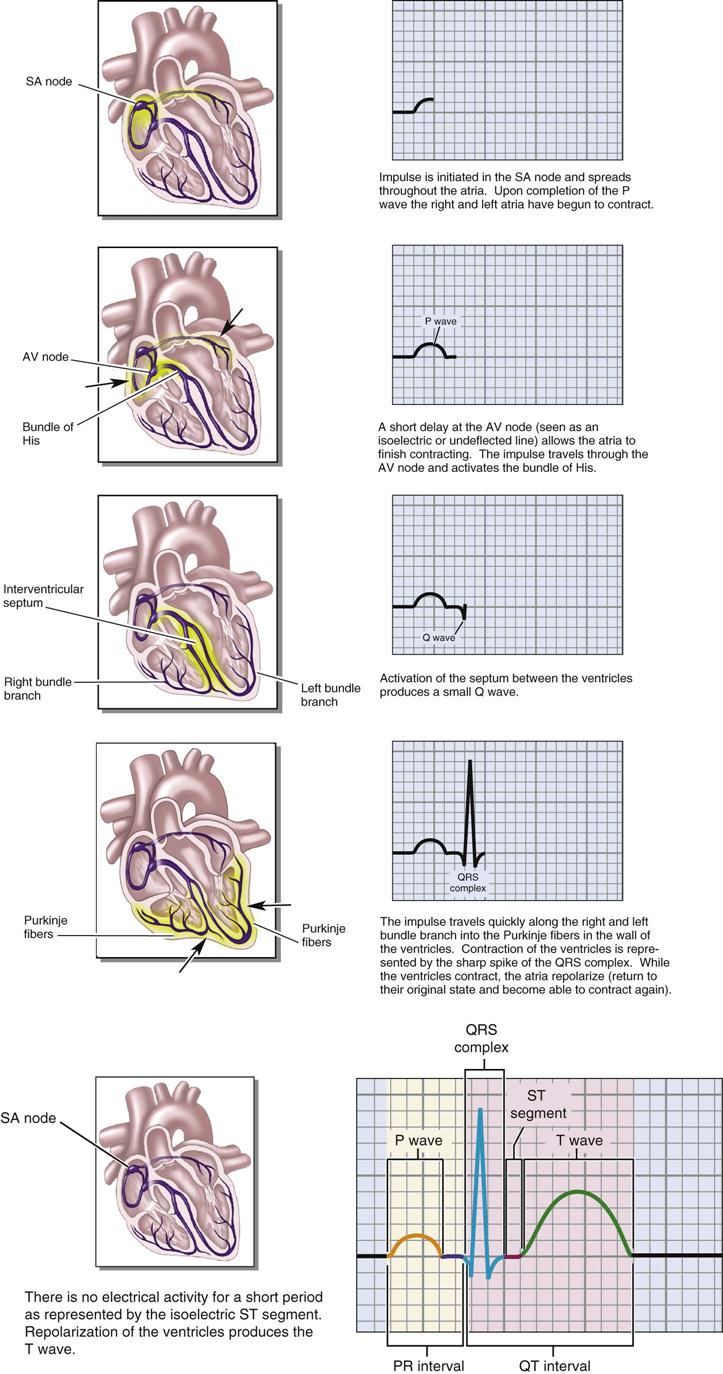
The specialized electrical conduction system of the heart (Figure 49-2) initiates each heartbeat. The main part of this system is the sinoatrial (SA) node, which is located in the upper back wall of the right atrium at the junction of the superior vena cava and the right atrium. The SA node controls the rate of heart contractions by initiating electrical impulses 60 to 100 times per minute. Each cardiac cycle, or heartbeat, starts with the SA node generating an electrical impulse that travels in a wavelike pattern across the cardiac muscle of the atria, causing them to contract almost simultaneously. This electrical impulse then stimulates the atrioventricular (AV) node, which is located in the posterior, superior portion of the right atrial septal wall, directly behind the tricuspid valve. A slight delay in conduction at this point allows the atria to empty completely. The electrical impulse then is transmitted to a special group of conduction fibers, the bundle of His, in the upper part of the interventricular septal wall. The bundle of His divides into two branches; the right bundle branch carries electrical impulses to the right ventricle, and the left bundle branch carries impulses to the left ventricle. The right and left bundle branches divide into smaller and smaller branches, ending in the Purkinje fibers, which spread across the apex of the heart and through the myocardium, stimulating ventricular contraction. The ventricles contract in a twisting sort of action, forcing the blood out of the chambers and into the pulmonary artery on the right side of the heart and the aorta on the left side.
Normal sinus rhythm (NSR) refers to a regular heart rate that falls within the average range of 60 to 80 beats per minute (beats/min). Sinus bradycardia is a heart rate below 60 beats/min; sinus tachycardia is a rate above 100 beats/min. In both of these conditions, the rhythm remains even, but the rate is pathologic. An irregular cardiac rhythm is called an arrhythmia. Conditions that interrupt the conduction pathway, SA node to AV node to bundle of His to right and left bundle branches, can cause arrhythmias.
Polarization, Depolarization, and Repolarization
Polarization is the resting state of the myocardial wall; no electrical activity occurs in the heart during this phase, which is recorded on the ECG strip as a flatline. In this state the myocardial cells are ready for stimulation. When the electrical system of the heart stimulates a myocardial cell, depolarization occurs, resulting in the contraction of the stimulated heart muscle. After depolarization the heart muscle cells must return to a resting state before they can be electrically stimulated again. The process of reaching this resting state is called repolarization.
The electrocardiograph records a series of waves, or deflections, above or below a baseline on the ECG paper. Each deflection corresponds to a particular part of the cardiac cycle (Table 49-1). The normal ECG cycle consists of waveforms that are labeled the P wave, the Q wave, the R wave, the S wave, and the T wave. The Q, R, and S waves usually are grouped together; this is called the QRS complex. One entire cardiac cycle can be called the PQRST complex. In the next section, each part of the ECG is discussed in more detail.
TABLE 49-1
| STAGE | HEART ACTIVITY | ELECTRICAL CURRENT |
| P wave* | Atrial contraction | Atrial depolarization |
| PR interval† | Contraction traversing the atrioventricular (AV) node | Depolarization traversing the AV node |
| QRS complex‡ | Ventricular contraction | Ventricular depolarization |
| ST segment | Time interval between ventricular contraction and the beginning of ventricular recovery | Time interval between ventricular depolarization and ventricular repolarization |
| T wave | Ventricular contraction subsides | Ventricular repolarization (electric recovery) |
| U wave (not always present) | Associated with further ventricular relaxation | Associated with further ventricular repolarization |
| Baseline§ | The heart at rest | Polarization |
| PR interval | Time interval between atrial contraction and ventricular contraction | Time interval between atrial depolarization and ventricular depolarization |
| QT interval | Time interval between the beginning of ventricular contraction and the subsiding of ventricular contraction | Time interval between the beginning of ventricular depolarization and ventricular repolarization (electric recovery) |
*Wave: A uniformly advancing deflection (upward or downward) from a baseline on a recording.
†Interval: The lapse of time between two different electrocardiographic events; represents the time needed for an electrical current to move on.
‡Complex: The portion of the ECG tracing that represents the sum of three waves (contraction of the ventricles).
§Baseline: A neutral line against which waves are valued as they deflect upward (positive) or downward (negative) from the line.
PQRST Complex
The P wave occurs during the contraction of the atria and shows the beginning of cardiac depolarization. The P wave is the first deflection from the baseline; it typically is smooth and rounded and should occur before each QRS complex. Atrial repolarization is not recorded on the ECG strip, because its electrical impulse is small and is hidden in the QRS complex. The PR segment is the return to baseline after atrial contraction. The PR interval is the time from the beginning of atrial contraction to the beginning of ventricular contraction. It contains the P wave (depolarization of the atria) and the spread of the electrical impulse through the AV node, bundle of His, right and left bundle branches, and Purkinje fibers. As the heart rate increases, the PR interval typically shortens. The QRS complex shows the contraction of both ventricles and also reflects the completion of cardiac depolarization. Repolarization of the atria also occurs during this time, but it cannot be seen on the ECG because the recording of the much stronger QRS activity overshadows it. Depolarization of the ventricles results in the contraction of a much larger muscle mass than does depolarization of the atria. Therefore, the QRS complex is recorded as a much more significant electrical activity than the P wave.
The ST segment reflects the time between the end of ventricular contraction and the beginning of ventricular recovery. The T wave represents ventricular recovery or repolarization of the ventricles. After the T wave comes a period of complete heart rest, also called polarization, which is indicated on the ECG as a straight line. The QT interval is the time between the beginning of the QRS complex through the T wave. During this time the ventricles contract and relax. A U wave occasionally can be seen as a small waveform just after the T wave in patients with a low serum potassium level or other metabolic disorders.
By measuring the actual configuration and location of each wave in relation to the other waves and to the baseline, in addition to the intervals between waves and segments, the physician is able to detect rhythmic disturbances of the heart and identify different types of cardiac disorders.
The Electrocardiograph
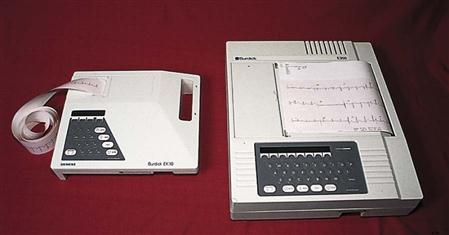
Electrocardiograph machines (Figure 49-3) record 12 leads simultaneously and are also referred to as six-channel ECG machines. Limb and chest electrodes must be placed on the patient at specific anatomic locations before the recording starts. When the ECG is started, the machine records all 12 leads automatically and marks each lead with identifying letters. These multichannel ECG tracings take seconds to perform and can be placed in the patient’s medical record without mounting or can be recorded directly into the patient’s electronic medical record.
Electrocardiograph Paper
Electrocardiograph paper is heat and pressure sensitive, which means that either heat or pressure can cause a mark to appear. The stylus on an ECG machine makes the image on the ECG paper. When the machine is on, the stylus becomes hot and burns a marking on the paper as it moves horizontally past the stylus. Because the paper is pressure sensitive, it must be handled carefully to prevent any additional markings that would blemish the tracing.
ECG paper is graph paper that has horizontal and vertical lines at 1-mm intervals. This is an agreed-on international standard that allows physicians anywhere in the world to interpret a patient’s ECG in the same manner. A medical assistant needs to know both the size and the meaning of each square on the ECG paper to understand its significance.
The horizontal axis represents time, and the vertical axis represents amplitude. Each small square measures 1 mm on each side. Every fifth line, both vertically and horizontally, is darker than the other lines and creates a larger square measuring 5 mm on each side. When the electrocardiograph runs at normal speed, one small 1-mm square passes the stylus every 0.04 second, which means that one large 5-mm square passes the stylus every 0.2 second. Continuing this logic, in 1 second, five large squares pass the stylus. Therefore, five sequential large squares show the record of what occurred in the heart during a time span of 1 second (5 large squares ⋅ 0.2 seconds = 1 second). Another way to say this is that at normal speed, the ECG paper travels past the stylus at a rate of 25 mm per second (Figure 49-4).
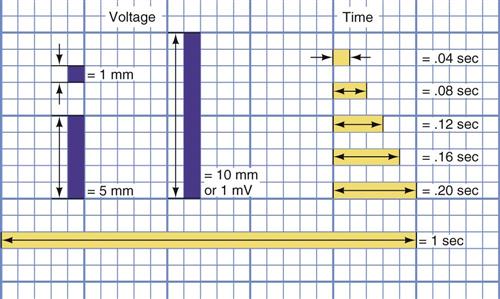
The voltage, or strength, of the heartbeat also is recorded on the paper. Voltage can be displayed as either a positive or a negative deflection. One millivolt (mV) of electrical activity moves the stylus upward over 10 mm (two large squares). This is the standard normally used for obtaining an ECG, and it can be adjusted to match the strength of the electrical activity of the heart. The machine must be calibrated so that 1 mV of electrical activity produces a deflection that is 10 mm either above or below the baseline. When properly calibrated, the ECG records both the strength of the electrical activity of the heartbeat in millivolts and the speed of the heartbeat over time.
Electrodes and Leads
Ten sensors, called electrodes, are placed on the patient’s arms (two), legs (two), and chest (six) to pick up the electrical activity of the heart. Electrodes must be applied to specific locations to record the heart’s electrical activity from different angles and planes. Ten color-coded and labeled lead wires that end in a small metal clip are attached to the electrodes. The lead wires carry the signal of the heart’s electrical activity to the ECG machine. Most machines require single-use, self-stick, disposable electrodes that are packaged with conductive jelly in the center.
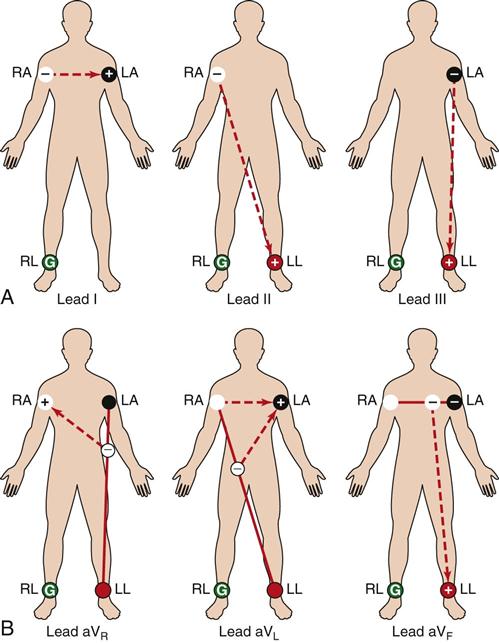
The leads to the electrocardiograph carry the cardiac electrical impulses into the machine, where they are magnified by an amplifier. These amplified impulses are converted into mechanical action, which is recorded on the ECG paper by the stylus and/or shown on a monitor. A single lead records the electrical activity of the heart between two different electrodes, one positive and one negative. The placement of the positive electrode determines the particular view of the heart recorded. If depolarization occurs toward the positive electrode, the deflection is upright; if it moves toward the negative electrode, the waveform is deflected downward. Each lead records the average electrical flow at a specific time in a specific location of the heart. The ECG records views of the heart on both a frontal and a transverse plane. The frontal leads include leads I, II, III, aVR, aVL, and aVF. Horizontal plane leads include the six precordial, or chest, leads (V1 to V6).
Lead Recordings
The standard ECG consists of 12 separate leads, or recordings of the electrical activity of the heart, from different angles.
Standard Leads
The first three leads recorded are called the standard or bipolar leads, because they each use two limb electrodes to record the heart’s electrical activity (Figure 49-5, A). The right arm electrode is the negative pole, and the left leg or left arm electrodes are the positive poles. Roman numerals I, II, and III are used to designate these leads.
Augmented Leads
The next three leads are the augmented, or combined, leads (Figure 49-5, B). These are designated augmented voltage right arm (aVR), augmented voltage left arm (aVL), and augmented voltage left leg (aVF). Because the electrical activity recorded by these leads is relatively small, the ECG machine amplifies (or augments) the electrical potential when recorded. These are all unipolar leads with a single positive electrode that uses the right leg for grounding.
Precordial Leads
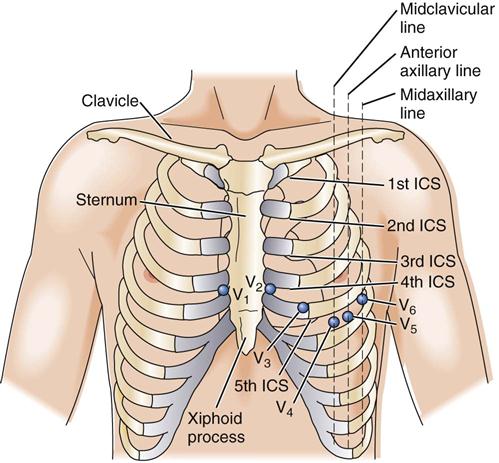
The precordial, or chest, leads are unipolar and provide a transverse plane view of the heart. They are designated V1, V2, V3, V4, V5, and V6. The V means chest, and each of the numbers represents a specific location on the chest. The QRS complex shows as a negative deflection in V1 and V2, and views with each subsequent lead become more positive. Precordial leads measure the electrical activity among six specific points on the chest wall and a point within the heart (Figure 49-6). It is important to avoid placing electrodes directly over a bony prominence.
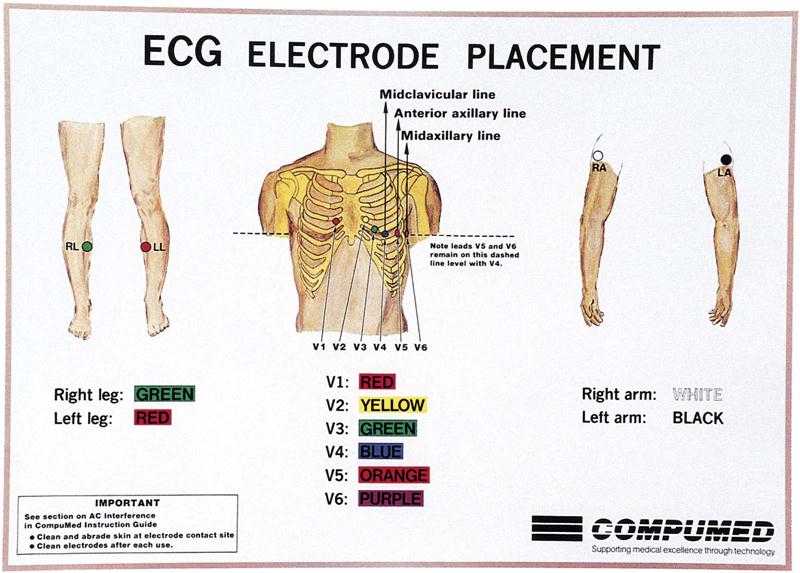
• V1—The electrode is placed in the fourth intercostal space, just to the right of the sternum.
• V2—The electrode is placed in the fourth intercostal space, just to the left of the sternum.
• V3—The electrode is placed midway between V2 and V4.
• V4—The electrode is placed in the fifth intercostal space, at the left midclavicular line.
• V5—The electrode is placed horizontal to V4 in the left anterior axillary line.
• V6—The electrode is placed horizontal to V4 in the left midaxillary line.
Performing Electrocardiography
Preparation of the Room and Patient
The room should be in the quietest location in the office and should be as far as possible from all other electrical equipment, including x-ray machines, diathermy devices, laboratory equipment, centrifuges, fans, refrigerators, and air conditioners. The room should be warm and should have adjustable lighting.
The treatment table should be comfortable and wide enough to provide full support for the patient. The table should be wood or should have an electrically insulated surface. Position the table so that you can work from the side of the patient that is most comfortable for you. Electrocardiographers most often work on the patient’s left side, but as long as the electrodes are placed in the proper position, it really makes no difference which side you use.
Small pillows are helpful for helping the patient relax and providing maximum comfort during the procedure. Offer a pillow for the head and one for under the knees. If a head pillow is used, it should not elevate the patient’s shoulders.
The patient should disrobe to the waist and put on the patient gown with the opening in the front; easy access to the patient’s extremities must be available. Pantyhose must be removed.
Place the patient in a supine position with the arms comfortably at the sides and the legs not touching one another. If the patient has dyspnea or orthopnea, a semi-Fowler’s position should be used, or alternatively the patient can be seated on a wooden chair. However, make sure you check with the physician before obtaining an ECG in an alternative position. If a seated position is used, the patient’s feet must rest comfortably on the floor or on a footstool. Note any alternative position on the ECG recording.
The patient should empty the bladder and then rest for at least 10 minutes before the ECG recording is made. Check to see whether the patient followed all the instructions provided in Figure 49-7. Record the patient’s vital signs and current medications on the patient’s chart. This information can be programmed into some ECG machines and automatically printed on the ECG recording.
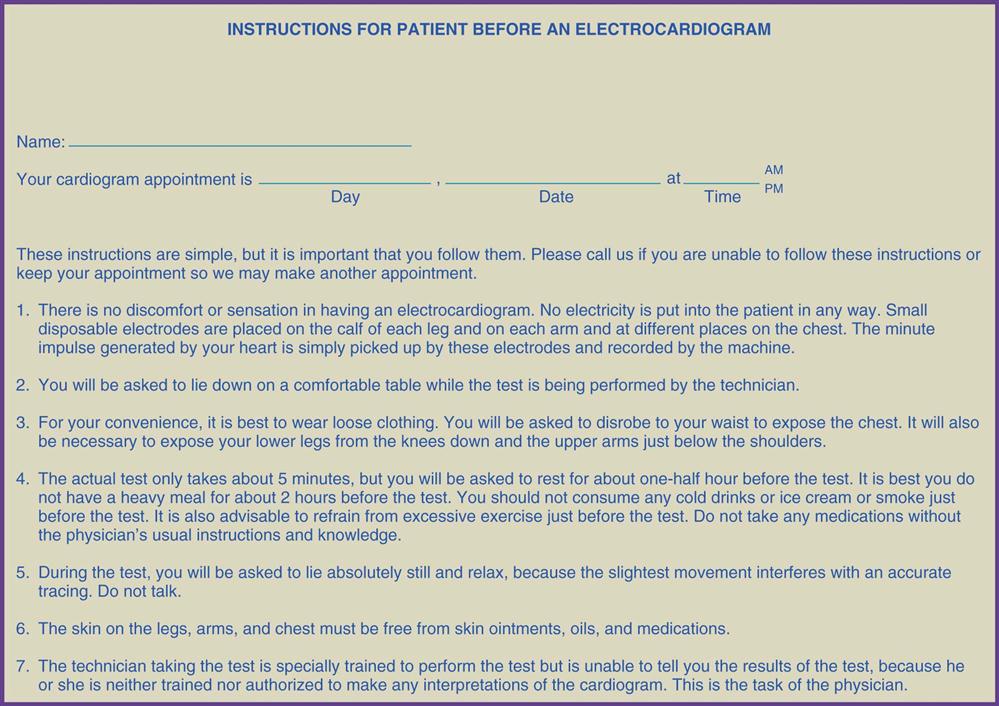
Explain to the patient the nature and purpose of the ECG. Attempt to answer all questions and make the patient as comfortable as possible during the procedure. Stress the importance of not moving during the entire procedure, and assure the patient that there is no danger of shock. Soften the lighting in the room to obtain maximum patient comfort. When you tell the patient to lie still, observe that he or she is breathing normally. Patients often hold their breath when asked to lie still.
Attaching Leads to the Patient
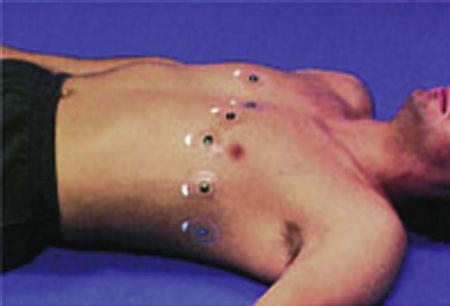
Disposable, single-use electrodes are placed on the patient’s limbs and chest in very specific locations (Figure 49-8). The lead wires from the machine then are connected to the electrodes. Making the proper connections is facilitated by specific lead markings or color coding on the end of each lead wire (Figure 49-9).
• RA lead is attached to the electrode on the patient’s right arm.
• LA lead is attached to the electrode on the patient’s left arm.
• RL lead is attached to the electrode on the patient’s right leg.
• LL lead is attached to the electrode on the patient’s left leg.
• The labeled lead wires then are placed on each precordial electrode.
