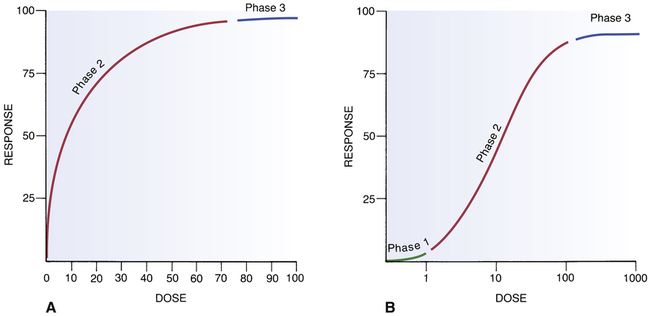
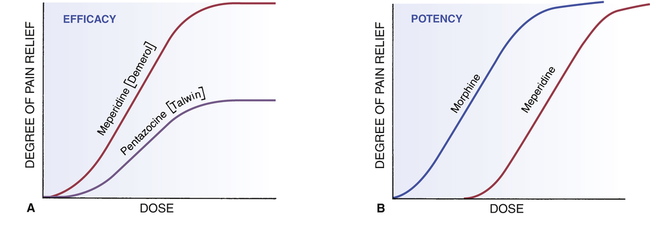
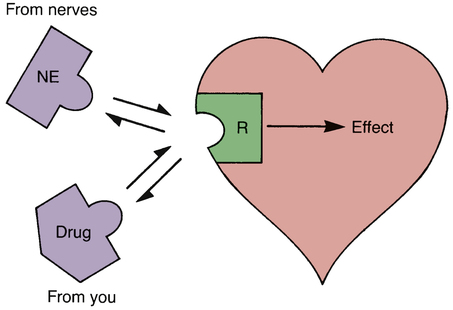
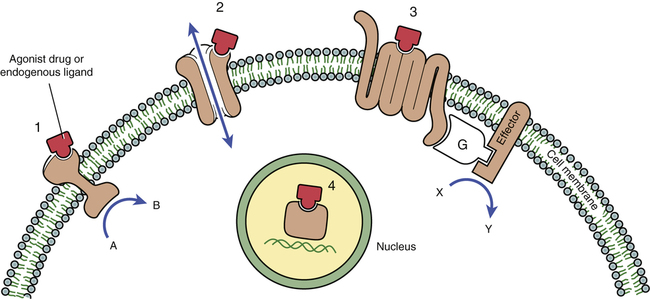
CHAPTER 5 The basic characteristics of dose-response relationships are illustrated in Figure 5–1. Part A shows dose-response data plotted on linear coordinates. Part B shows the same data plotted on semilogarithmic coordinates (ie, the scale on which dosage is plotted is logarithmic rather than linear). The most obvious and important characteristic revealed by these curves is that the dose-response relationship is graded. That is, as the dosage increases, the response becomes progressively larger. Because drug responses are graded, therapeutic effects can be adjusted to fit the needs of each patient. To tailor treatment to a particular patient, all we need do is raise or lower the dosage until a response of the desired intensity is achieved. If drug responses were all-or-nothing instead of graded, drugs could produce only one intensity of response. If that response were too strong or too weak for a particular patient, there would be nothing we could do to adjust the intensity to better suit the patient. Clearly, the graded nature of the dose-response relationship is essential for successful drug therapy. As indicated in Figure 5–1, the dose-response relationship can be viewed as having three phases. Phase 1 (Fig. 5–1B) occurs at low doses. The curve is flat during this phase because doses are too low to elicit a measurable response. During phase 2, an increase in dose elicits a corresponding increase in the response. This is the phase during which the dose-response relationship is graded. As the dose goes higher, we eventually reach a point where an increase in dose is unable to elicit a further increase in response. At this point, the curve flattens out into phase 3. Dose-response curves reveal two characteristic properties of drugs: maximal efficacy and relative potency. Curves that reflect these properties are shown in Figure 5–2. The concept of maximal efficacy is illustrated by the dose-response curves for meperidine [Demerol] and pentazocine [Talwin], two morphine-like pain relievers (Fig. 5–2A). As you can see, the curve for pentazocine levels off at a maximum height below that of the curve for meperidine. This tells us that the maximum degree of pain relief we can achieve with pentazocine is smaller than the maximum degree of pain relief we can achieve with meperidine. Put another way, no matter how much pentazocine we administer, we can never produce the degree of pain relief that we can with meperidine. Accordingly, we would say that meperidine has greater maximal efficacy than pentazocine. The concept of potency is illustrated by the curves in Figure 5–2B. These curves plot doses for two analgesics—morphine and meperidine—versus the degree of pain relief achieved. As you can see, for any particular degree of pain relief, the required dose of meperidine is larger than the required dose of morphine. Because morphine produces pain relief at lower doses than meperidine, we would say that morphine is more potent than meperidine. That is, a potent drug is one that produces its effects at low doses. It is important to note that the potency of a drug implies nothing about its maximal efficacy! Potency and efficacy are completely independent qualities. Drug A can be more effective than drug B even though drug B may be more potent. Also, drugs A and B can be equally effective even though one may be more potent. As we saw in Figure 5–2B, although meperidine happens to be less potent than morphine, the maximal degree of pain relief that we can achieve with these drugs is identical. As suggested by the equation, binding of a drug to its receptor is usually reversible. An illustration should help clarify the receptor concept. Let’s consider receptors for norepinephrine (NE) in the heart. Cardiac output is controlled in part by NE acting at specific receptors in the heart. Norepinephrine is supplied to those receptors by neurons of the autonomic nervous system (Fig. 5–3). When the body needs to increase cardiac output, the following events take place: (1) the firing rate of autonomic neurons to the heart increases, causing increased release of NE; (2) NE then binds to receptors on the heart; and (3) as a consequence of the interaction between NE and its receptors, both the rate and force of cardiac contractions increase, thereby increasing cardiac output. When the demand for cardiac output subsides, the autonomic neurons reduce their firing rate, binding of NE to its receptors diminishes, and cardiac output returns to resting levels. • The receptors through which drugs act are normal points of control of physiologic processes. • Under physiologic conditions, receptor function is regulated by molecules supplied by the body. • All that drugs can do at receptors is mimic or block the action of the body’s own regulatory molecules. • Because drug action is limited to mimicking or blocking the body’s own regulatory molecules, drugs cannot give cells new functions. Rather, drugs can only alter the rate of pre-existing processes. In other words, drugs cannot make the body do anything that it is not already capable of doing.* • Drugs produce their therapeutic effects by helping the body use its pre-existing capabilities to the patient’s best advantage. Put another way, medications simply help the body help itself. • In theory, it should be possible to synthesize drugs that can alter the rate of any biologic process for which receptors exist. Although the body has many different receptors, they comprise only four primary families: cell membrane–embedded enzymes, ligand-gated ion channels, G protein–coupled receptor systems, and transcription factors. These families are depicted in Figure 5–4. In the discussion below, the term ligand-binding domain refers to the specific region of the receptor where binding of drugs and endogenous regulatory molecules takes place. As shown in Figure 5–4, receptors of this type span the cell membrane. The ligand-binding domain is located on the cell surface, and the enzyme’s catalytic site is inside. Binding of an endogenous regulatory molecule or agonist drug (one that mimics the action of the endogenous regulatory molecule) activates the enzyme, thereby increasing its catalytic activity. Responses to activation of these receptors occur in seconds. Insulin is a good example of an endogenous ligand that acts through this type of receptor. Like membrane-embedded enzymes, ligand-gated ion channels span the cell membrane. The function of these receptors is to regulate flow of ions into and out of cells. Each ligand-gated channel is specific for a particular ion (eg, Na+, Ca++). As shown in Figure 5–4, the ligand-binding domain is on the cell surface. When an endogenous ligand or agonist drug binds the receptor, the channel opens, allowing ions to flow inward or outward. (The direction of flow is determined by the concentration gradient of the ion across the membrane.) Responses to activation of a ligand-gated ion channel are extremely fast, usually occurring in milliseconds. Several neurotransmitters, including acetylcholine and gamma-aminobutyric acid (GABA), act through this type of receptor. As shown in Figure 5–4, the receptors that couple to G proteins are serpentine structures that traverse the cell membrane 7 times. For some of these receptors, the ligand-binding domain is on the cell surface. For others, the ligand-binding domain is located in a pocket accessible from the cell surface.
Pharmacodynamics
Dose-response relationships
Basic features of the dose-response relationship

 Basic components of the dose-response curve.
A, A dose-response curve with dose plotted on a linear scale. B, The same dose-response relationship shown in A but with the dose plotted on a logarithmic scale. Note the three phases of the dose-response curve: Phase 1, The curve is relatively flat; doses are too low to elicit a significant response. Phase 2, The curve climbs upward as bigger doses elicit correspondingly bigger responses. Phase 3, The curve levels off; bigger doses are unable to elicit a further increase in response. (Phase 1 is not indicated in A because very low doses cannot be shown on a linear scale.)
Maximal efficacy and relative potency

 Dose-response curves demonstrating efficacy and potency.
A, Efficacy, or “maximal efficacy,” is an index of the maximal response a drug can produce. The efficacy of a drug is indicated by the height of its dose-response curve. In this example, meperidine has greater efficacy than pentazocine. Efficacy is an important quality in a drug. B, Potency is an index of how much drug must be administered to elicit a desired response. In this example, achieving pain relief with meperidine requires higher doses than with morphine. We would say that morphine is more potent than meperidine. Note that, if administered in sufficiently high doses, meperidine can produce just as much pain relief as morphine. Potency is usually not an important quality in a drug.
Maximal efficacy
Relative potency
Drug-receptor interactions
Introduction to drug receptors

 Interaction of drugs with receptors for norepinephrine.
Under physiologic conditions, cardiac output can be increased by the binding of norepinephrine (NE) to receptors (R) on the heart. Norepinephrine is supplied to these receptors by nerves. These same receptors can be acted on by drugs, which can either mimic the actions of endogenous NE (and thereby increase cardiac output) or block the actions of endogenous NE (and thereby reduce cardiac output).
The four primary receptor families

 The four primary receptor families.
1, Cell membrane–embedded enzyme. 2, Ligand-gated ion channel. 3, G protein–coupled receptor system (G = G protein). 4, Transcription factor. (See text for details.)
Cell membrane–embedded enzymes.
Ligand-gated ion channels.
G protein–coupled receptor systems.
![]()
Stay updated, free articles. Join our Telegram channel

Full access? Get Clinical Tree


Pharmacodynamics
D + R I D-R COMPLEX → RESPONSE
Only gold members can continue reading. Log In or Register to continue
Get Clinical Tree app for offline access
