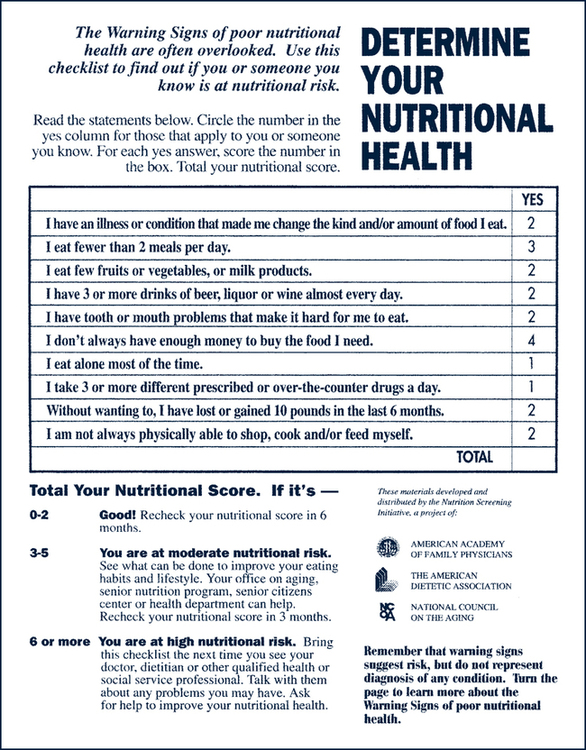
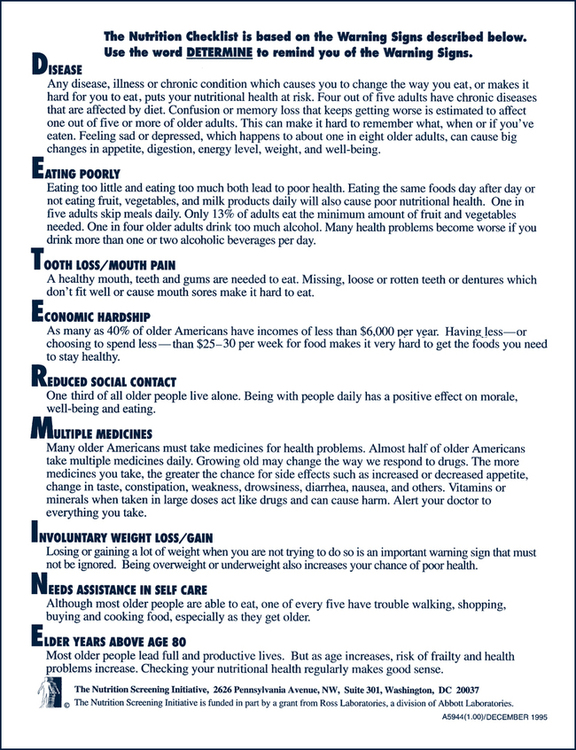
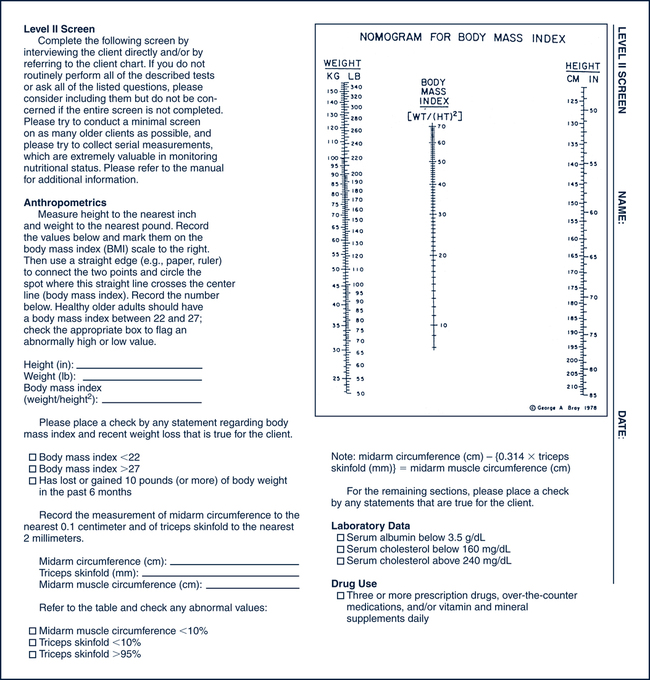
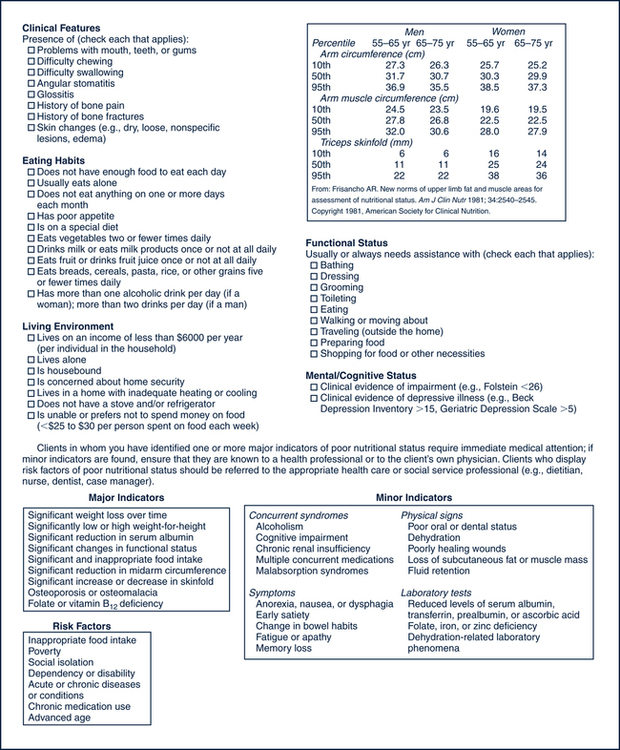
Kathleen M. Rourke, PhD, RN, RD, CHES On completion of this chapter, the reader will be able to: 1. Differentiate between the social, cultural, and emotional aspects of food as well as the physiologic aspects of nutrients in food. 2. Correlate the physiologic changes of aging with food intake patterns. 3. Differentiate between a nutritional screen and a nutritional assessment. 4. Identify the steps and core data collection elements of a nutritional assessment. 5. Describe the changes in nutritional requirements for aging persons. 6. Describe the role of therapeutic diets and nutritional support in nutritional therapies. 7. Identify major dietary guidelines and recommendations for healthy persons of all ages. Although at its core the role of food is simply that of providing energy and nutrients for bodily functions, few individuals view food from this perspective. Over the course of history, different types of foods have served as poisons, potions, or panaceas for health, potency, long life, and love. Hippocrates (460–377 bc), the “Father of Medicine,” reflected his commitment to the importance of diet in a statement from the Hippocratic Oath: “I will apply dietetic measures for the benefit of the sick according to my ability and judgment; I will keep them from harm and injustice” (Tannahill, 1988). Cato the Elder (234–149 bc), a Roman statesman, ate large amounts of cabbage in the belief it had special healing properties. A later Roman scholar, Pliny the Elder (23–79 AD), ate the foot and snout of the hippopotamus to enhance sexual potency, whereas a Chinese physician of the sixth century bc prescribed certain foods for clients to stimulate the yin (female principle) and the yang (male principle) to keep a person healthy (Tannahill, 1988). In present societies food and diet are manipulated to enhance athletic performance, carbohydrates are avoided to force the body into ketosis in an effort to burn fat for weight loss, and supplements are taken to replace the vitamins and minerals missing from the “fad diets” many Americans try. Comfort foods are now a designated and popular category, particularly after September 11, 2001, when purchases of donuts and pastries increased significantly (Balon, 2002; Comforted but unfattened, 2002). • January: New Year’s Day and the Super Bowl • March: St. Patrick’s Day, March Madness • May: Mother’s Day and Memorial Day studying this use of nutrients have coined the term nutriceuticals to imply that these nutrients and nutrient substrates have pharmaceutical effects. It is no secret that the aging population is growing. The 85 and older age cohort, which represented 3.4 million of the total population in 1993, is the fastest growing segment and makes up 10% of the older population. In the 120-year period between 1870 and 1990, individuals older than age 65 grew from 1 million to 32 million. In 2030 those older than 65 years of age are expected to reach 71 million individuals (American Dietetic Association [ADA] position paper, 2005b). Chronic diseases are compromising health status at later stages of life; these chronic diseases have repeated and direct correlates with dietary intake, exercise, stress management, and locus of control and include cardiovascular disease, cancer, stroke, osteoporosis, and diabetes. More often, the diagnoses of such diseases occur among the old-old (ages 85 or older), closer to the period of dying and death (the ninth and tenth decades of life). Life expectancy has increased, but life span has not. Today’s average life expectancy at birth is about 75.7 years, whereas the life span is still considered to be 115 years, although a record of 128 years appears to have been set in January of 2009 by a woman in Uzbekistan who has provided documentation to the BBC that she was born in July of 1881 (BBC News, January 29, 2009). The old-old will continue to be the fastest growing group, and it is predicted (by the U.S. Census Bureau) to be 8.6 million by 2030. By 2050 this group may be 25% of the population age 65 or older (AARP, Administration on Aging, 2005). The social and economic consequences of America growing older, coupled with lower birth and mortality rates, are vast, including a heavy demand on the health care industry. Nutrition, exercise, and engagement in other activities such as lifelong learning and education will enhance the functional capacity of this generation of individuals and their families, as well as reduce the incidence of depression, found to be increasingly prevalent, especially in older U.S. women (Stadler & Teaster, 2002; McGuire, Strine, Vachirasudiekha, et al, 2008). Aging produces physiologic changes; however, assumptions about the aged are often generalizations without merit. A distinction should be made between the healthy aging person and the aging person with acute or chronic disease. For the healthy aging person, exercise and the resulting maintenance of muscle mass are emerging in research as one of the greatest determinants of maintaining vitality (Campbell, Johnson, McGabe, & Carnell, 2008). Loss of lean body mass, which is essentially loss of skeletal muscle, can lead to decreased strength and mobility, predisposing aging adults to falls and affecting (although minimally) metabolism. Exercise is effective in maintaining skeletal muscle mass, and it enhances functional status and fitness levels for aging adults by 10 to 20 years (Campbell et al, 2008). Functional impairment often leads to malnutrition. Older adults with functional impairments may have difficulty performing, or be unable to perform, activities of daily living (ADLs) related to eating. They may be unable to shop for groceries, prepare food, or eat. Conditions that result in shortness of breath, pain, or limited mobility affect an individual’s ability and desire to eat. In addition, some medications further alter sensory receptors, resulting in greater differences in taste or smell. Changes in flavor, taste, and odor perception generally decline with age and can become quite exaggerated with some medications. For many of the elderly, foods that were once cherished and enjoyed as part of their culture now smell very different and are simply avoided. A report published by the AARP found that almost 22% of aging adults who live at home have health-related impairments in ADLs (AARP, 2005). Physiologic changes that are common in older adults can lead to problems with nutrition. Organ function declines with age; this can affect digestion, metabolism, absorption of nutrients, and the ability to eliminate waste products via the kidneys (Keithley, 1996). The gastrointestinal system slows with age, resulting in less efficient absorption of nutrients (Zulkowski & Albrecht, 2003). Changes in the oral cavity include tooth loss or ill-fitting dentures, mouth dryness, and decreased esophageal motility. Satiety triggers are diminished in older adults, yet given the increased risk for skin breakdown and the likelihood of a compromised immune, circulatory, and respiratory system, the majority of the elderly populations have increased protein requirements (Zulkowski & Albrecht, 2003). Older adults are at risk of dehydration caused by a decreased intake of fluids, loss of sodium, and increased fluid losses. Physiologically, the decreased intake can be related to altered thirst; older adults may not feel thirsty even when hypovolemic and often do not compensate for fluid losses during illness. Confusion, depression, and dementia also contribute significantly to reduced food and fluid intake. Dehydration can take three main forms. Isotonic dehydration results from the loss of sodium and water, such as during a gastrointestinal illness. Hypertonic dehydration results when water losses exceed sodium losses. This type of dehydration is the most common and can occur from fever or limited fluid intake. Hypotonic dehydration can occur with diuretic use when sodium loss is higher than water loss (Weinberg & Minaker, 1995). Poverty is a significant problem for older Americans, particularly as individuals age. The U.S. Census Bureau reports that 10.1% of adults ages 65 or older were below the poverty level; in the 75 or older subgroup, 43% fell into a substandard level (AARP, 2005). When individuals have a fixed income to cover housing, clothing, utilities, food, health care, medications, and other expenses, food may be sacrificed, especially as the percentage of income required for health care rises. It is estimated that 61% of women and 31% of men older than 65 live on annual incomes less than $10,000. The cost of medication for the elderly has significantly compromised many already low-income budgets, forcing individuals to choose between food or the medication (Zulkowski & Albrecht, 2003). Food may initially be limited in quality as a transition to high-fat, high-carbohydrate convenience foods occurs, followed by a limitation in quantity. Social isolation is another factor contributing to malnutrition. Older adults may skip meals completely when they live alone and have no one with whom to prepare and share meals. Grieving over the loss of a spouse or friends also affects diet quality and intake. It is important to keep in mind that as individuals age their loss of friends and family members can be significant and overwhelming. These psychosocial factors, such as isolation and depression, and economic issues, such as poverty or the limitations of a fixed income, can affect food purchases and, ultimately, total intake. Approximately 8% to 16% of older adults do not have access to a nutritious, culturally acceptable diet, and federal programs to combat hunger and malnutrition reach only about one third of the population they are intended to benefit. Many of those who receive home-delivered meals have two or three chronic health conditions. While those that receive home-delivered meals have most likely been hospitalized within the previous year (Ponza, Ohls, & Millen, 1996), the lack of companionship during mealtime can result in home-delivered meals being left uneaten. Both older women and men report eating more when with others, including family and friends, than when alone (ADA position paper, 2005b). Meals-on-Wheels programs and congregate dining arrangements can bring meals and socialization opportunities to older adults who are at risk. Physiologic, psychosocial, and economic factors must be assessed by the nurse or dietitian during nutritional screening or a comprehensive nutritional assessment. Nutritional screening is an abbreviated assessment of nutritional risk factors that determines which clients are in need of a more comprehensive assessment and nutritional interventions. A variety of tools have been developed to conduct nutritional screening. Perhaps the most widely used of these tools is the “Determine Your Nutritional Health” screening tool developed as part of the Nutrition Screening Initiative (NSI) (Fig. 10–1). The NSI (Dwyer, 1991), a 5-year, multifaceted national effort to promote routine nutrition screening, began in 1990 under the direction of the American Academy of Family Physicians, the American Dietetic Association, and the National Council on the Aging. As part of the initiative, a nutritional health checklist was developed to be used by older adults or caregivers to determine risk factors associated with nutrition and health. A score of 3 or more indicates moderate to high nutritional risk and triggers the need for a more comprehensive nutritional assessment. The Level II Screen is a tool that health care professionals use to conduct a more in-depth assessment of nutritional status (Fig. 10–2). The importance of nutritional screening is emphasized in the standards and guidelines developed by the Health Care Financing Administration (HCFA) (now the Centers for Medicaid and Medicare Services [CMS]) and the Joint Commission on Accreditation of Healthcare Organizations (JCAHO). The Outcome and Assessment Information Set (OASIS) implemented by CMS includes data elements relating to food intake and nutritional status (HCFA, 1998). This massive project is designed to collect and measure client care outcomes for home care clients. Nutrition-related outcomes for OASIS in home care include “improvement in eating and stabilization in light meal preparation.” The focus of the OASIS project is to develop outcome measures that lead to performance improvement. A variety of studies have shown that nutrition affects immune status and length of hospital stay (Feldblum et al, 2008). Outcome management attempts to identify critical interventions that produce a positive clinical outcome at lower cost. Because nutrition is an integral intervention in many diseases, disease state management programs or clinical pathways often incorporate nutritional interventions. Malnourished, hospitalized clients have more infections and other complications, which significantly increase the costs of hospitalization and care (Feldblum et al, 2008). Standards developed by the JCAHO require nutritional screening of all hospitalized and home care clients who receive clinical services (JCAHO, 1998). The standards also require referral for a comprehensive assessment if the client is found to be at moderate to severe nutritional risk. A nutritional assessment is a comprehensive evaluation of a client’s nutritional status and typically includes data collection in each of the following areas: demographic and psychosocial data, medical history, dietary history, anthropometrics, medications and laboratory values, and a physical assessment. Nutritional assessment may be performed as a result of an identified risk on a nutritional screening or when the risk status is obvious without a preliminary screening. The American Society for Parenteral and Enteral Nutrition (ASPEN) published standards that identify nutritionally at-risk clients (Box 10–1) (ASPEN, 1995). ASPEN also identified the goals of a nutritional assessment as follows: • Establish baseline subjective and objective nutrition parameters. • Identify specific nutritional deficits. • Determine nutritional risk factors. • Establish nutritional needs. • Identify medical and psychosocial factors that may influence the prescription and administration of nutritional support. Height and weight are the mainstays of anthropometric measurements. Ideally the client is weighed in the morning while wearing light clothing. Height is measured, if possible. For clients who are unable to stand without assistance, height can be estimated by measuring the distance from the heel to the top of the knee (knee height) with the use of a broad-bladed caliper. This measure can be used to estimate height with the following formula (Nutritional assessment of the elderly through anthropometry, 1988): In comparing weight and height, the nurse can use instruments such as the Metropolitan Life Insurance Table of Weight for Height as a reference. Surveys of weight changes with age reveal that the young-old are more likely to be overweight, whereas the old-old tend to be underweight (Andres et al, 1985). With age there is a loss of lean body mass and an increase of body fat; therefore body weight alone can be misleading. Older adults should be cautioned against extreme leanness. Andres et al (1985) report an increased mortality risk in lean older adults compared with older adults who have 10% to 15% more body weight. With this information, Andres et al created a table of heights and weights (Table 10–1). TABLE 10–1 A WEIGHT TABLE FOR OLDER ADULTS
Nutrition
Social and Cultural Aspects of Food
is a young science. Changes in nutrition and food policy occur frequently, confusing the consumer as well as the health care practitioner who is not solely focused on nutrition. Many new frontiers remain to be discovered. For instance, there is a major focus in research regarding the impact of nutrient substrates on disease prevention, immune system stimulation, and response to critical illness (Petchetti, Frishman, Petrillo, & Raju, 2007; Rattan, 2007; Szekely, Breitner, & Zandi, 2007). Researchers
Demographics of the Aging Population
Physiologic Changes in Aging that Affect Nutritional Status
Psychosocial and Socioeconomic Factors Related to Malnutrition
Nutritional Screening and Assessment
Nutritional Screening
Nutritional Assessment
Anthropometrics

This age-adjusted weight chart, devised by Johns Hopkins University gerontologist Dr. Reubin Andres, indicates medically sound weight ranges for people in their 50s and 60s. The ideal weight for most people is around the midpoint for each person’s age and height. Those in the lower ranges are probably heavy enough to maintain good health, as long as there is no sudden or unexplained weight loss. Weights in the upper ranges may also be acceptable, but if a client finds himself or herself on the high side, he or she should talk with a physician about the possibility of losing weight. A physician makes recommendations based on where the client tends to store fat and his or her general health.
HEIGHT
WEIGHT (LB) AGES 50 TO 59
WEIGHT (LB) AGES 60 TO 69∗
4’10”
107–135
115–142
4’11”
111–139
119–147
5’0”
114–142
123–152
5’1”
118–148
127–157
5’2”
122–153
131–163
5’3”
126–158
135–168
5’4”
130–163
140–173
5’5”
134–168
144–179
5’6”
138–174
148–184
5’7”
143–179
153–190
5’8”
147–184
158–196
5’9”
151–190
162–201
5’10”
156–195
167–207
5’11”
160–201
172–213
6’0”
165–207
177–219
6’1”
169–213
182–225
6’2”
174–219
187–232
6’3”
179–225
192–238
6’4”
184–231
197–244 ![]()
Stay updated, free articles. Join our Telegram channel

Full access? Get Clinical Tree


