Drugs for diabetes mellitus

CHAPTER 57


Drugs for diabetes mellitus


Marshal Shlafer and Rich Lehne


Diabetes mellitus: basic considerations


The term diabetes mellitus is derived from the Greek word for fountain and the Latin word for honey. Hence, the term describes one of the prominent symptoms of untreated diabetes: production of large volumes of glucose-rich urine. Indeed, long ago, the disease we now call diabetes was “diagnosed” by the sweet smell of urine—and, yes, by its sweet taste, too. In this chapter we use the terms diabetes mellitus and diabetes interchangeably.


Diabetes is primarily a disorder of carbohydrate metabolism. Symptoms mainly result from a deficiency of insulin or from cellular resistance to insulin’s actions. The principal sign of diabetes is sustained hyperglycemia, which results from impaired glucose uptake by cells and from increased glucose production. When hyperglycemia develops, it can quickly lead to polyuria, polydipsia, ketonuria, and weight loss. Over time, hyperglycemia can lead to hypertension, heart disease, renal failure, blindness, neuropathy, amputations, impotence, and stroke. There is an often-overlooked point about diabetes: In addition to affecting carbohydrate metabolism, insulin deficiency disrupts metabolism of proteins and lipids as well. We refer to regulation of blood glucose levels as glycemic control.


Diabetes is a major public health concern. In the United States, diabetes is the most common endocrine disorder, and the sixth leading cause of death by disease. According to the 2011 National Diabetes Fact Sheet, compiled by the Centers for Disease Control and Prevention, about 26 million Americans have diabetes, and nearly one-quarter of them have not been diagnosed. Another 79 million or so Americans are prediabetic, and hence are at increased risk of developing diabetes in the future. In 2007, diabetes cost the U.S. economy an estimated $174 billion ($116 billion in direct medical expenditures and $58 billion in lost productivity). These costs represent a 32% increase over the estimated costs for 2002. Put anther way, the total cost of diabetes is going up by roughly $8.4 billion every year.


We need to do a better job of diagnosing diabetes and treating it—and we need to do what we can to reduce the risk of developing the disease in the first place. Unfortunately, the risk of developing diabetes is largely genetic, a factor that can’t be modified. Nonetheless, we can still reduce risk significantly by adopting a healthy lifestyle, centered on getting more exercise and esablishing a healthy diet.


Types of diabetes mellitus


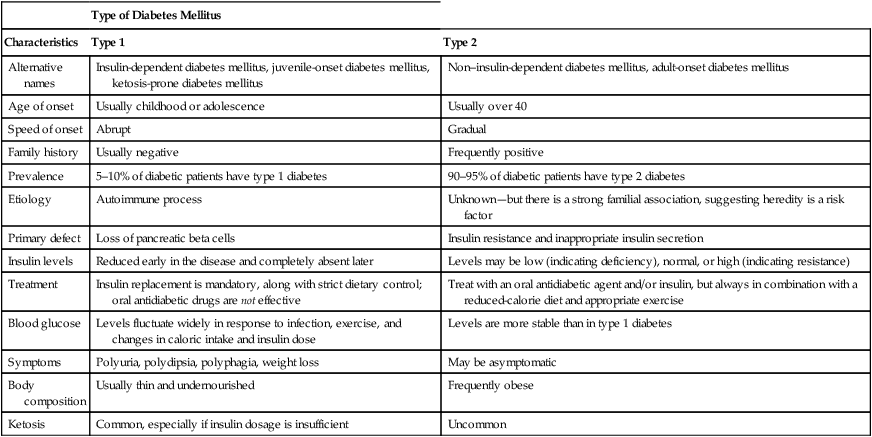
There are two main forms of diabetes mellitus: type 1 diabetes mellitus and type 2 diabetes mellitus. Both forms have similar signs and symptoms. Major differences concern etiology, prevalence, treatments, and outcomes (illness severity and deaths). The distinguishing characteristics of type 1 and type 2 diabetes are summarized in Table 57–1 and discussed immediately below. Another important form—gestational diabetes—is discussed later under Diabetes and Pregnancy.


TABLE 57–1 


Characteristics of Type 1 and Type 2 Diabetes Mellitus


  Type of Diabetes Mellitus
Characteristics Type 1 Type 2
Alternative names Insulin-dependent diabetes mellitus, juvenile-onset diabetes mellitus, ketosis-prone diabetes mellitus Non–insulin-dependent diabetes mellitus, adult-onset diabetes mellitus
Age of onset Usually childhood or adolescence Usually over 40
Speed of onset Abrupt Gradual
Family history Usually negative Frequently positive
Prevalence 5–10% of diabetic patients have type 1 diabetes 90–95% of diabetic patients have type 2 diabetes
Etiology Autoimmune process Unknown—but there is a strong familial association, suggesting heredity is a risk factor
Primary defect Loss of pancreatic beta cells Insulin resistance and inappropriate insulin secretion
Insulin levels Reduced early in the disease and completely absent later Levels may be low (indicating deficiency), normal, or high (indicating resistance)
Treatment Insulin replacement is mandatory, along with strict dietary control; oral antidiabetic drugs are not effective Treat with an oral antidiabetic agent and/or insulin, but always in combination with a reduced-calorie diet and appropriate exercise
Blood glucose Levels fluctuate widely in response to infection, exercise, and changes in caloric intake and insulin dose Levels are more stable than in type 1 diabetes
Symptoms Polyuria, polydipsia, polyphagia, weight loss May be asymptomatic
Body composition Usually thin and undernourished Frequently obese
Ketosis Common, especially if insulin dosage is insufficient Uncommon

image


Type 1 diabetes

Type 1 diabetes accounts for about 5% to 10% of all diabetes cases. Between 1.2 million and 2.4 million Americans have this disorder. In the past, type 1 diabetes was called juvenile-onset diabetes mellitus or insulin-dependent diabetes mellitus (IDDM). As a rule, type 1 diabetes develops during childhood or adolescence, and symptom onset is relatively abrupt.


The primary defect in type 1 diabetes is destruction of pancreatic beta cells—the cells responsible for insulin synthesis and release into the bloodstream. Insulin levels are reduced early in the disease and usually fall to zero later. Beta cell destruction is the result of an autoimmune process (ie, development of antibodies against the patient’s own beta cells). The trigger for this immune response is unknown, but genetic factors almost certainly play a role.


Type 2 diabetes

Type 2 diabetes is the most prevalent form of diabetes. Approximately 22 million Americans have this disease. In the past, type 2 diabetes was called non–insulin-dependent diabetes mellitus (NIDDM) or adult-onset diabetes mellitus. The disease usually begins in middle age and progresses gradually. Obesity is usually present, although people of normal weight can also develop the disease. In contrast to type 1 diabetes, type 2 diabetes carries little risk of ketoacidosis. However, type 2 diabetes does carry the same long-term risks as type 1 diabetes (see below).


Symptoms of type 2 diabetes usually result from a combination of insulin resistance and impaired insulin secretion. In contrast to patients with type 1 diabetes, those with type 2 diabetes are capable of insulin synthesis. In fact, early in the disease, insulin levels tend to be normal or slightly elevated, a state known as hyperinsulinemia. However, although insulin is still produced, its secretion is no longer tightly coupled to plasma glucose content: release of insulin is delayed and peak output is subnormal. More importantly, the target tissues of insulin (liver, muscle, adipose tissue) exhibit insulin resistance: For a given blood insulin level, cells in these tissues are less able to take up and metabolize the glucose available to them. Insulin resistance appears to result from three causes: reduced binding of insulin to its receptors, reduced receptor numbers, and reduced receptor responsiveness. Over time, hyperglycemia leads to destruction of pancreatic beta cells, and hence insulin production and secretion eventually decline.


Although the underlying causes of type 2 diabetes are unknown, there is a strong familial association, suggesting that genetics play a role. This possibility was reinforced by a study that implicated the gene for insulin receptor substrate-2 (IRS-2), a compound that helps mediate intracellular responses to insulin.


Long-term complications of diabetes


The long-term consequences of type 1 and type 2 diabetes usually take years to develop. More than 90% of diabetic deaths result from long-term complications, not from acute episodes of hyperglycemia, hypoglycemia, or ketoacidosis. Ironically, among patients with type 1 diabetes, insulin therapy can be viewed as having made long-term complications possible: Prior to the discovery of insulin, people with type 1 diabetes usually died long before chronic complications could arise.


Most long-term complications occur secondary to disruption of blood flow, owing to either macrovascular or microvascular damage. There is strong evidence that tight control of blood glucose can reduce microvascular injury. Tight glycemic control may also reduce macrovascular injury, although other measures (eg, exercise, healthy diet, control of blood pressure and blood lipids) are probably more important.


Microvascular damage

Damage to small blood vessels and capillaries (the microvasculature) is common in diabetes. The basement membrane of capillaries thickens, causing blood flow in these narrow vessels to fall. Destruction of small blood vessels contributes to kidney damage, blindness, and various neuropathies. Microvascular injury is directly related to the degree and duration of hyperglycemia.


Nephropathy.

Diabetic damage to the kidneys—diabetic nephropathy—is characterized by proteinuria, reduced glomerular filtration, and increased blood pressure. Diabetic nephropathy is the most common cause of end-stage renal disease, a condition that requires dialysis or a kidney transplant for survival. Between 10% and 20% of people with diabetes have or will develop kidney disease. The risk of nephropathy among patients with type 1 diabetes is 12 times higher than among patients with type 2 diabetes. Nephropathy is the primary cause of morbidity and mortality in patients with type 1 diabetes. If the injured kidney is replaced with a transplant, the new kidney is likely to fail within a few years unless tight glycemic control is established.


We can screen for kidney damage by testing for microalbuminuria (the presence of small amounts of albumin in the urine). Recall that albumin is the blood’s major protein. When the kidney is healthy, the urine contains no albumin. Why? Because albumin is so large it cannot be filtered by the glomerulus. However, when the glomerulus is damaged, even slightly, some albumin gets filtered and enters the urine. If renal function undergoes further decline, larger amounts of albumin will enter the urine, causing albuminuria. After that? Eventually, renal failure.


Treatment of diabetes can delay the onset of nephropathy and reduce its severity. The Diabetes Control and Complications Trial (DCCT) revealed that tight glucose control decreases the risk of nephropathy by 35% to 57%. As discussed in Chapter 44, treatment with an angiotensin-converting enzyme (ACE) inhibitor or an angiotensin II receptor blocker (ARB) can slow progression of mild-to-moderate nephropathy that is already present. However, these drugs are not effective for primary prevention. Of note, ACE inhibitors and ARBs have an additional benefit: they can help control hypertension, a common complication of diabetes.


Sensory and motor neuropathy.

Nerve degeneration often begins early in the course of diabetes, but symptoms are usually absent for years. Sensory and motor nerves may be affected. Symptoms of diabetic neuropathy—which are usually bilateral and symmetric—include tingling sensations in the fingers and toes (paresthesias), increased pain or decreased ability to feel pain, suppression of reflexes, and loss of other sensations (especially vibratory sensation). These changes are one of the reasons why a complete foot exam for diabetic patients includes not only an examination for sores and possible infections, but also for sensory responses. The clinician will use a small needle or other stiff or sharp object to prod the bottoms of the feet, without the patient looking. Failure to detect the stimuli gives a good indication that neuropathies are developing.


Nerve damage is directly related to sustained hyperglycemia, which may cause metabolic disturbances in nerves or may injure the capillaries that supply nerves. In the DCCT, tight glycemic control reduced the incidence of peripheral neuropathy by 60%.


Amputations secondary to infection.

Diabetes is responsible for more than half of lower limb amputations in the United States. Each year about 54,000 diabetic patients lose a foot or leg. The underlying cause is severe infection, which can develop following local trauma, be it major or minor. There are three reasons why serious infection can occur. First, hyperglycemia provides a glucose-rich environment for bacteria to grow. Second, diabetes can suppress immune function, and thereby compromise host defenses against infection. And third, diabetic neuropathy can prevent the patient from feeling discomfort and other sensations that would signal that a serious infection is developing. Because of these factors, an infection that would be inconsequential and self-limiting in nondiabetics can become very serious in a diabetic. If the infection spreads and becomes gangrenous, the only realistic and effective solution is amputation. Because of these possibilities, regular foot exams and foot care are an important part of diabetes management.


Diabetes and pregnancy


Before the discovery of insulin, virtually all babies born to mothers with severe diabetes died during infancy. Although insulin therapy has greatly improved outcomes, successful management of the diabetic pregnancy remains a challenge. Three factors contribute to the problem. First, the placenta produces hormones that antagonize insulin’s actions. Second, production of cortisol, a hormone that promotes hyperglycemia, increases threefold during pregnancy. Both factors increase the body’s need for insulin. And third, because glucose can pass freely from the maternal circulation to the fetal circulation, hyperglycemia in the mother will stimulate excessive secretion of insulin in the fetus. The resultant hyperinsulinism can have multiple adverse effects on the fetus.


Successful management of diabetes during pregnancy demands that proper glucose levels be maintained in both the fetus and mother; failure to do so may be teratogenic or may otherwise harm the fetus. Achieving glucose control requires diligence on the part of the mother and her prescriber. Some experts on diabetes in pregnancy advise that blood glucose levels must be monitored 6 to 7 times a day. Insulin dosage and food intake must be adjusted accordingly.


Because fetal death frequently occurs near term, it is desirable that delivery take place as soon as fetal development will permit. Hence, when tests indicate sufficient fetal maturation, it is common practice to deliver the infant early—either by cesarean section or by inducing labor with drugs.


Gestational diabetes is defined as diabetes that appears during pregnancy and then subsides rapidly after delivery. Gestational diabetes is managed in much the same manner as any other diabetic pregnancy: Blood glucose should be monitored and then controlled with diet and insulin. In most cases, the diabetic state disappears almost immediately after delivery, permitting discontinuation of insulin. However, if the diabetic state persists beyond parturition, it is no longer considered gestational and should be rediagnosed and treated accordingly.


In women taking an oral drug for type 2 diabetes, current practice is to discontinue the oral drug and switch to insulin. The only exception is the oral agent metformin, which is often satisfactory for managing type 2 diabetes in pregnancy. Women who discontinue oral medications can resume oral therapy after delivery.


Diagnosis


Until recently, diagnosis of diabetes was made solely on measuring blood levels of glucose. However, in 2010, the American Diabetes Association (ADA) recommended an alternative test, based on measuring blood levels of a compound known as hemoglobin A1c. For all of these tests, values diagnostic of diabetes are summarized in Table 57–2.


Tests based on blood levels of glucose

Excessive plasma glucose is diagnostic of diabetes. Several tests may be employed: a fasting plasma glucose (FPG) test, a casual plasma glucose test, and an oral glucose tolerance test (OGTT). To make a definitive diagnosis, the patient must be tested on two separate days, and both tests must be positive. Any combination of two tests (eg, two FPG tests; one FPG test and one OGTT) may be used.


Prediabetes


Prediabetes is a state defined by impaired fasting plasma glucose (FPG between 100 and 125 mg/dL), or impaired glucose tolerance (2-hour OGTT result of 140 to 199 mg/dL). These values are below those that define diabetes, but are too high to be considered normal. People with prediabetes are at increased risk of developing type 2 diabetes and CVD—but not the microvascular complications associated with diabetes (ie, retinopathy, nephropathy, neuropathy). The risk of CVD can be reduced by diet, exercise, and, if indicated, use of appropriate drugs to control blood lipids and blood pressure. The risk of progression to diabetes may be reduced by diet and exercise, and possibly by certain oral antidiabetic drugs.


It is important to note that many people who meet the criteria for “prediabetes” never go on to develop diabetes—even if they don’t modify their lifestyle, and even if they don’t take antidiabetic drugs. Hence, although “prediabetes” indicates an increased risk of diabetes, it by no means guarantees that diabetes will occur.


Overview of treatment


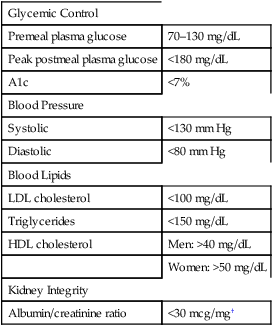
The primary goal of treating type 1 or type 2 diabetes is prevention of long-term complications, especially CVD, retinopathy, kidney disease, and amputations. To minimize these complications, treatment must keep glucose levels as low as safely possible. In addition, treatment must keep blood pressure and blood lipids within an acceptable range. In both type 1 and type 2 diabetes, proper diet and adequate exercise are central components of management. Major treatment targets are summarized in Table 57–3.


TABLE 57–3 


General Treatment Targets for Patients with Diabetes*


Glycemic Control
Premeal plasma glucose 70–130 mg/dL
Peak postmeal plasma glucose <180 mg/dL
A1c <7%
Blood Pressure
Systolic <130 mm Hg
Diastolic <80 mm Hg
Blood Lipids
LDL cholesterol <100 mg/dL
Triglycerides <150 mg/dL
HDL cholesterol Men: >40 mg/dL
  Women: >50 mg/dL
Kidney Integrity
Albumin/creatinine ratio <30 mcg/mg


image


*Treatment targets for certain subgroups of patients may differ from the targets in this table.


An albumin/creatinine ratio above 30 mcg albumin/1 mg creatinine indicates too much albumin in urine owing to glomerular injury.


Type 1 diabetes

Preventing complications of diabetes requires a comprehensive plan directed at glycemic control and reduction of cardiovascular risk factors. Glycemic control is accomplished with an integrated program of diet, self-monitoring of blood glucose (SMBG), exercise, and insulin replacement. Of importance, glycemic control must be achieved safely, that is, without causing hypoglycemia. An essential component of treatment—education of the patient and his or her caregivers about diet, exercise, and drugs—is usually left to the nurse and a dietitian or nutritionist.


Dietary measures.

Proper diet, balanced by insulin replacement, is the cornerstone of treatment. Because patients with type 1 diabetes are usually thin, the dietary goal is to maintain weight—not lose it. Dietary recommendations from the ADA include the following:


Unfortunately, although following these guidelines is clearly beneficial, many patients find long-term adherence difficult to achieve.


For people who like sweets, the ADA recommendations have good news: You can eat foods that contain sucrose (table sugar)—provided you reduce intake of other carbohydrates. What matters most is the total amount of carbohydrate ingested—not the type of carbohydrate or its source.


What’s the glycemic index and why is it important? The glycemic index is an indicator of how a particular carbohydrate will affect blood glucose levels. Specifically, eating foods that have a high glycemic index (eg, white bread, unprocessed white rice) will raise glucose levels more rapidly and to a higher peak than will eating foods that have a low glycemic index (eg, rolled oats, 100% whole wheat bread, lentils and legumes, most fruits and nonstarchy vegetables). In theory, foods with a low glycemic index should permit better glycemic control. Why? Because, when glucose levels rise slowly after eating, the body has more time to process the glucose load. Importantly, this advantage is lost if total intake of low-index foods is excessive. Put another way, we may be able to achieve better glycemic control by consuming high-glycemic-index foods in moderate amounts rather than by consuming low-index foods in enormous amounts. But the best control would be achieved by consuming low-index foods in moderate amounts—and minimizing consumption of high-index foods.


Type 2 diabetes

As with type 1 diabetes, preventing long-term complications requires a comprehensive treatment plan. Lifestyle measures (diet and exercise) and drug therapy are the foundation of glycemic control. Because patients are often obese, the usual dietary goal is to promote weight loss. Exercise provides the additional benefit of promoting glucose uptake by muscle, even when insulin levels are low. In addition to glycemic control, the plan should address other factors that can increase morbidity and mortality. Accordingly, all patients should be screened and treated for hypertension, nephropathy, retinopathy, and neuropathy. In addition, dyslipidemias (high LDL cholesterol, low HDL cholesterol, and high triglycerides) should be corrected.


Recommendations for glycemic control have changed. Until recently, treatment was started with lifestyle measures alone; drugs were added only if these measures failed. Today, treatment is started with lifestyle measures plus drug therapy. We no longer wait to use drugs. As a result, glycemic control is established sooner, and hence the risk of long-term complications is made lower.


Type 2 diabetes can be treated with a variety of oral and injectable drugs. Among the oral drugs, metformin and the sulfonylureas (eg, glipizide [Glucotrol]) are used most widely. Among the injectable drugs, insulin is used most widely. Although wide use of insulin may surprise you, it shouldn’t. Remember, as type 2 diabetes progresses, less and less insulin is produced. As a result, up to 40% of patients with advanced disease eventually require insulin therapy.


Given the many drugs available for type 2 diabetes, which ones are preferred? Evidence of safety and efficacy is best for metformin, sulfonylureas, and insulin, as discussed in a 2009 guideline—Medical Management of Hyperglycemia in Type 2 Diabetes: A Consensus Algorithm for the Initiation and Adjustment of Therapy—issued jointly by the ADA and the European Association for the Study of Diabetes. To treat type 2 diabetes, the guideline recommends a three-step approach:


Treatment should start at step 1, and then climb to steps 2 and 3 if needed. The guideline suggests alternative drugs (eg, pioglitazone [Actos], exenatide [Byetta]) if the preferred drugs are ineffective or poorly tolerated.


Tight glycemic control


The process of maintaining glucose levels within a normal range, around-the-clock, is referred to as tight glycemic control. In terms of A1c, the recommended target is less than 7%. Maintaining tight glycemic control is difficult but can be worth the trouble, especially for patients with type 1 diabetes. However, for many patients with type 2 diabetes, the risks of tight control may be greater than the benefits.


Type 1 diabetes


Benefits.

The benefits of tight glycemic control in type 1 diabetes were demonstrated conclusively in the Diabetes Control and Complications Trial (DCCT), in which patients received either conventional insulin therapy (1 or 2 injections a day) or intensive insulin therapy (4 injections a day). After 6.5 years, the patients who received intensive therapy experienced a 50% decrease in clinically significant kidney disease, a 35% to 57% decrease in neuropathy, and a 76% decrease in serious ophthalmic complications. Moreover, onset of ophthalmic problems was delayed and progression of existing problems was slowed. In addition to reducing these microvascular complications, tight control decreased macrovascular complications: 17-year follow-up data from the DCCT showed a significant reduction in myocardial infarction, coronary revascularization, and angina. Hence, with rigorous control of blood glucose, the high degree of morbidity and mortality traditionally associated with type 1 diabetes can be markedly reduced.


Drawbacks.

The greatest concern is hypoglycemia. Because glucose levels are kept relatively low, the possibility of hypoglycemia increases. Why? Because even a modest overdose with insulin can cause blood glucose to fall too low. Also, a meal that is skipped or exercise that is too strenuous can do the same. Results of the DCCT showed that, compared with patients using conventional therapy, those using intensive insulin experienced 3 times as many hypoglycemic events requiring the assistance of another person, and 3 times as many episodes of hypoglycemia-induced coma or seizures. In addition, patients on intensive insulin experienced greater weight gain (about 10 pounds, on average). Other disadvantages are greater inconvenience, increased complexity, and a need for greater patient motivation. Finally, the cost is higher: Whereas traditional therapy costs about $1700/year, intensive therapy costs about $4000/year (for multiple daily injections) or $5800 (for continuous infusion with a pump). The cost of test strips for the patient’s glucometer adds substantially more to the bill.


Type 2 diabetes

In patients with type 2 diabetes, benefits of tight glycemic control are limited mainly to microvascular complications; tight control does little to reduce macrovascular complications. Furthermore, benefits accrue more to younger adults with recent-onset disease, than to older adults with well-established disease. As in type 1 diabetes, tight glycemic control poses a significant risk of hypoglycemia and weight gain. In addition, tight control may increase the risk of death.


The effects of tight glycemic control in type 2 diabetes were demonstrated in four landmark trials:


These large randomized trials differed in patient populations: Whereas the UKPDS trial enrolled younger adults with recent-onset diabetes and no prior cardiovascular events, the ACCORD, ADVANCE, and VDAT trials enrolled older adults with long-standing diabetes as well as established CVD or cardiovascular risk factors.


Results of the UKPDS trial, released in 1998, showed a significant reduction in microvascular complications—but little or no reduction in macrovascular complications or death. In one branch of the study, nonobese patients were given either intensive therapy or conventional therapy. Mean values for A1c were 7% in the intensive group and 7.9% in the conventional group. Compared with patients in the conventional group, patients in the intensive group had a 12% reduction in total diabetes-related endpoints (cardiovascular, retinal, and renal damage). However, a reduction in microvascular complications (especially retinal damage) accounted for most of the benefit.


Results of ACCORD, ADVANCE, and VDAT were released in 2008. As in the UKPDS trial, tight glycemic control failed to reduce stroke, amputations, all-cause mortality, or mortality from cardiovascular causes. In fact, in the ACCORD trial, intensive therapy was associated with an increased risk of death. Tight control also increased the risk of severe hypoglycemia and weight gain. The ADVANCE trial did show a reduction in microvascular outcomes, but the ACCORD trial did not.


Taken together, these four studies suggest that tight glycemic control is most appropriate for younger adults who have recent-onset type 2 diabetes and no cardiovascular complications. Because even short periods of hyperglycemia increase the risk of microvascular and macrovascular complications, intensive therapy should be started as soon as diabetes is diagnosed.


Who should not receive intensive therapy? Intensive glycemic control may be inappropriate for patient with


For these patients, an A1c goal above 7% may be more appropriate than a goal below 7%.


Monitoring treatment


We need monitoring to (1) determine whether glucose levels are being maintained in a safe range, both short term and long term, and to (2) guide changes in the regimen when the range is not satisfactory or safe. Self-measurement of blood glucose levels is the standard method for day-to-day monitoring. A1c is measured to assess long-term glycemic control. Target levels for these tests are summarized in Table 57–4.


Self-monitoring of blood glucose

SMBG is recommended for all patients who use insulin. That is, SMBG is recommended for all patients with type 1 diabetes, and for all patients with type 2 diabetes receiving insulin. Many devices for measuring blood glucose (generally called glucometers) are available. With most of them, the patient places a small drop of capillary blood (eg, from a “finger stick”) on a chemically treated strip, which is then analyzed by the machine. The test is rapid and can be performed in almost any setting. Information on blood glucose concentration provides a guide for “fine tuning” dosages of insulin and other antidiabetic drugs. SMBG should be done 3 or more times a day—typically upon awakening, and before or after exercise or a meal. Target values for blood glucose are 70 to 130 mg/dL before meals and 100 to 140 mg/dL at bedtime.


Monitoring of hemoglobin A1C

Measurement of hemoglobin A1c—also called glycosylated hemoglobin or glycated hemoglobin—provides an index of average glucose levels over the prior 2 to 3 months. Glucose interacts spontaneously with hemoglobin in red blood cells to form glycosylated derivatives, the most prevalent being A1c. With prolonged hyperglycemia, levels of A1c gradually increase. Since red blood cells have a long life span (120 days), levels of A1c reflect average glucose levels over an extended time. Hence, by measuring A1c every 3 to 6 months, we can get a picture of long-term glycemic control. Please note, however, that measuring A1c tells us nothing about acute, hour-to-hour swings in blood glucose. Accordingly, although measuring A1c is an important part of diabetes management, it is clearly no substitute for SMBG.


How is testing done? Current tests use a tiny capillary blood sample from a “finger stick,” and yield results in minutes, while the patient is still in the office.


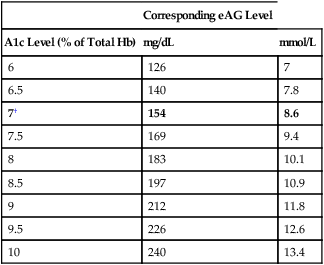
How are test results expressed? Results are usually reported as a percent of total hemoglobin in blood (eg, 7%). In addition, they may be reported as a value for estimated Average Glucose (eAG), expressed as mg glucose/dL of blood (ie, the same units patients see every day when doing SMBG). Selected A1c values and their eAG equivalents are listed in Table 57–4.


What’s the A1c target level? For most patients with diabetes, the goal is to keep A1c below 7% of total hemoglobin. According to a 2008 statement issued jointly by the ADA and the European Association for the Study of Diabetes, A1c should be measured every 3 months until the value drops to 7%, and at least every 6 months thereafter. As noted above, a value of 6.5% or greater is considered diagnostic of diabetes.


Although an A1c goal of below 7% is good for most patients, a less stringent goal (eg, below 8%) may be appropriate for some patients, such as those with a history of severe hypoglycemia, limited life expectancy, or advanced microvascular or macrovascular complications.


Insulin


Insulin is used to treat all patients with type 1 diabetes, and up to 40% of those with type 2 diabetes. Our discussion of insulin is divided into three sections: physiology, preparations and administration, and therapeutic use.


Physiology


Metabolic actions

The metabolic actions of insulin are primarily anabolic (ie, conservative, constructive). Insulin promotes conservation of energy and buildup of energy stores, such as glycogen. The hormone also promotes cell growth and division.


Insulin acts in two ways to promote anabolic effects. First, it stimulates cellular transport (uptake) of glucose, amino acids, nucleotides, and potassium. Second, insulin promotes synthesis of complex organic molecules. Under the influence of insulin and other factors, glucose is converted into glycogen (the liver’s way to store glucose for later use), amino acids are assembled into proteins, and fatty acids are incorporated into triglycerides. The principal metabolic actions of insulin are summarized in Table 57–5.


Metabolic consequences of insulin deficiency

Insulin deficiency puts the body into a catabolic mode (ie, a metabolic state that favors the breakdown of complex molecules into their simpler constituents). Hence, in the absence of insulin, glycogen is converted into glucose, proteins are degraded into amino acids, and fats are converted to glycerol (glycerin) and free fatty acids. These catabolic effects contribute to the signs and symptoms of diabetes. Note that the catabolic effects resulting from insulin deficiency are opposite to the anabolic effects when insulin levels are normal.


Insulin deficiency promotes hyperglycemia by three mechanisms: (1) increased glycogenolysis, (2) increased gluconeogenesis, and (3) reduced glucose utilization. Glycogenolysis, by definition, generates free glucose by breaking down glycogen. The raw materials that allow increased gluconeogenesis are the amino acids and fatty acids produced by metabolic breakdown of proteins and fats. Reduced glucose utilization occurs because insulin deficiency decreases cellular uptake of glucose, and decreases conversion of glucose to glycogen.


Preparations and administration


There are many insulin preparations or formulations. All of them have identical mechanisms. Major differences concern time course, appearance (clear or cloudy), concentration, and route of administration. Because of these differences, insulin preparations cannot be used interchangeably. In fact, if a patient is given the wrong preparation, the consequences can be dire. Unfortunately, medication errors with insulins remain all too common, which explains why insulin appears on all lists of “high-alert” agents.


Types of insulin


There are seven types of insulin: “natural” insulin (also known as regular insulin or native insulin) and six modified insulins. Three of the modified insulins—insulin lispro, insulin aspart, and insulin glulisine—act more rapidly than natural insulin but have a shorter duration of action. The other modified insulins act more slowly than natural insulin but have a longer duration. Two processes are used to prolong insulin effects: (1) complexing natural insulin with a protein, and (2) altering the insulin molecule itself. When the insulin molecule has been altered, we refer to the product as a human insulin analog. Specific alterations made to create the insulin analogs are summarized in Table 57–6.


TABLE 57–6 


Amino Acids Substitutions in Human Insulin Analogs*


Insulin Type Amino Acids in A-Chain Position Amino Acids in B-Chain Position
A8 A10 A21 B3 B28 B29 B30 B31 B32
Human Insulin
Native Thr Ilc Asn Asn Pro Lys Thr
Human Insulin Analogs
Glargine Thr Ilc Gly Gly Pro Lys Thr Arg Arg
Aspart Thr Ilc Asn Asn Asp Lys Thr
Lispro Thr Ilc Asn Asn Lys Pro Thr
Glulisine Thr Ilc Asn Lys Pro Glu Thr
Detemir Thr Ilc Asn Asn Pro Lys §
< div class='tao-gold-member'>

Only gold members can continue reading. Log In or Register to continue

Stay updated, free articles. Join our Telegram channel

Jul 24, 2016 | Posted by in NURSING | Comments Off on Drugs for diabetes mellitus

Full access? Get Clinical Tree

Get Clinical Tree app for offline access