Chapter 36 Care of Patients with Dysrhythmias
Safe and Effective Care Environment
Health Promotion and Maintenance
2. Teach patients and their families about drug therapy used for common dysrhythmias.
3. Educate patients and families about procedures and other interventions for common dysrhythmias.
4. Identify typical physical assessment findings associated with common dysrhythmias.
5. Explain how to perform an electrocardiogram (ECG) test.
6. Analyze an ECG rhythm strip to identify normal sinus rhythm and common or life-threatening dysrhythmias.
7. Plan collaborative care for patients experiencing common dysrhythmias.
8. Explain the purpose and types of pacing used as interventions for patients with dysrhythmias.
9. Connect and maintain pacing devices.
10. Explain how to perform emergency care procedures, such as cardiopulmonary resuscitation (CPR) and automated external defibrillation.
11. Plan community-based care for a patient after pacemaker or implantable cardioverter/defibrillator insertion.

http://evolve.elsevier.com/Iggy/
Animation: Conduction of Heart Impulses
Animation: Events Represented by the ECG
Answer Key for NCLEX Examination Challenges and Decision-Making Challenges
Review Questions for the NCLEX® Examination
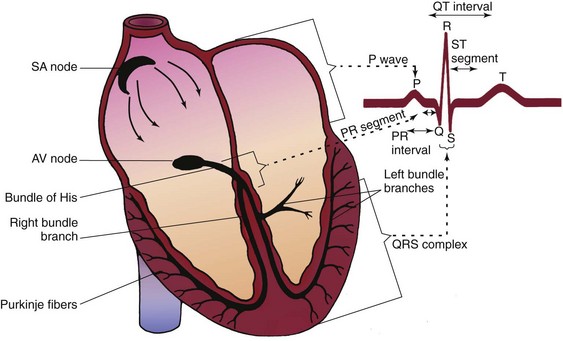
Review of Cardiac Conduction System
The cardiac conduction system consists of specialized myocardial cells (Fig. 36-1). The electrophysiologic properties of those cells regulate heart rate and rhythm and possess unique properties: automaticity, excitability, conductivity, and contractility.
Electrocardiography
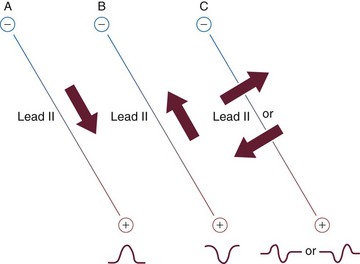
• The baseline is the isoelectric line. It occurs when there is no current flow in the heart after complete depolarization and also after complete repolarization. Positive deflections occur above this line, and negative deflections occur below it. Deflections represent depolarization and repolarization of cells.
• If the direction of electrical current flow in the heart (cardiac axis) is toward the positive pole, a positive deflection (above the baseline) is viewed (Fig. 36-2, A).
• If the direction of electrical current flow in the heart (cardiac axis) is moving away from the positive pole toward the negative pole, a negative deflection (below the baseline) is viewed (Fig. 36-2, B).
• If the cardiac axis is moving neither toward nor away from the positive pole, a biphasic complex (both above and below baseline) will result (Fig. 36-2, C).
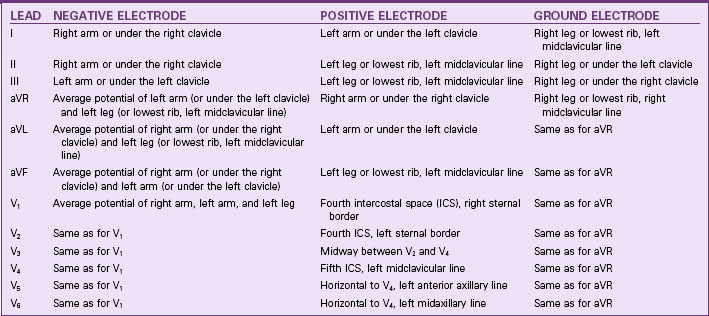
Lead Systems
Other lead systems include the 18-lead ECG, which adds six leads placed on the horizontal plane on the right side of the chest to view the right side of the heart. This is sometimes referred to as a “right-sided ECG.” The extra leads are sometimes placed on the back. The latest evidence indicates an 80-lead ECG, which looks at the heart from 80 views instead of only 12 and gives a 360-degree view of the heart. Evaluation of this 80-lead ECG revealed a 15% increase in diagnosing myocardial infarctions (MIs), particularly in the posterior wall, which was missed in the 12-lead ECG (New 80-lead ECG is easy to interpret, 2008).
Unipolar limb leads consist of a positive electrode only. The unipolar limb leads are aVR, aVL, and aVF, with a meaning augmented. V is a designation for a unipolar lead. The third letter denotes the positive electrode placement: R for right arm, L for left arm, and F for foot (left leg). The positive electrode is at one end of the lead axis. The other end is the center of the electrical field, at about the center of the heart (Table 36-1).
Continuous Electrocardiographic Monitoring
• Right arm electrode just below the right clavicle
• Left arm electrode just below the left clavicle
• Right leg electrode on the lowest palpable rib, on the right midclavicular line
• Left leg electrode on the lowest palpable rib, on the left midclavicular line
• Fifth electrode placed to obtain one of the six chest leads
• Watching a bank of monitors on a unit
• Printing ECG rhythm strips routinely and as needed
• Reporting the patient’s rhythm and significant changes to the nurse
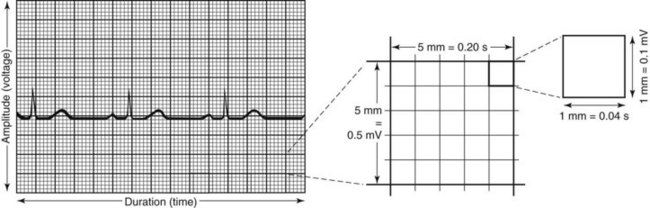
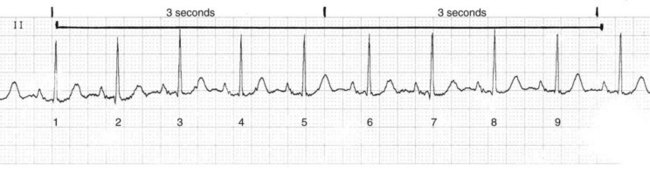
The ECG strip is printed on graph paper (Fig. 36-3), with each small block measuring 1 mm in height and width. ECG recorders and monitors are standardized at a speed of 25 mm/sec. Time is measured on the horizontal axis. At this speed, each small block represents 0.04 second. Five small blocks make up one large block, defined by darker bold lines and representing 0.20 second. Five large blocks represent 1 second, and 30 large blocks represent 6 seconds. Vertical lines in the top margin of the graph paper are usually 15 large blocks apart, representing 3-second segments (Fig. 36-4).
Electrocardiographic Complexes, Segments, and Intervals
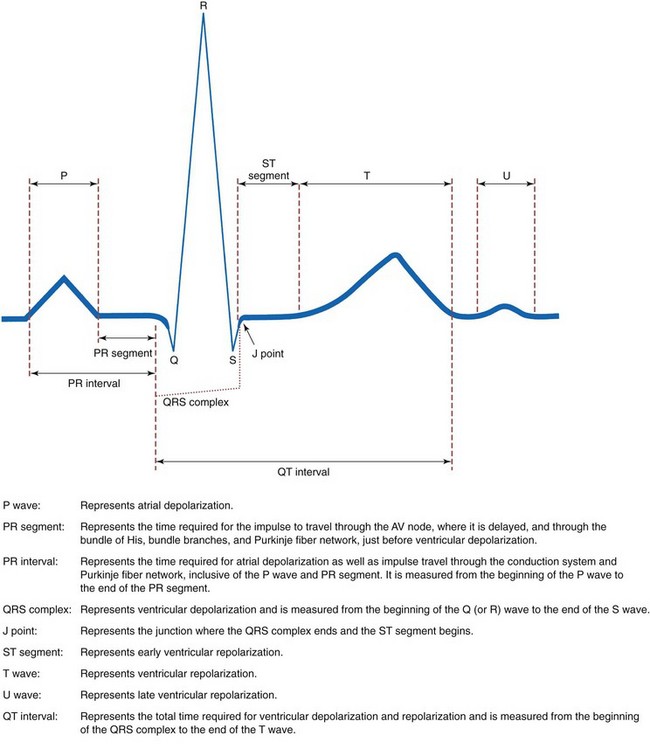
Complexes that make up a normal ECG consist of a P wave, a QRS complex, a T wave, and possibly a U wave. Segments include the PR segment, the ST segment, and the TP segment. Intervals include the PR interval, the QRS duration, and the QT interval (Fig. 36-5).
Determination of Heart Rate
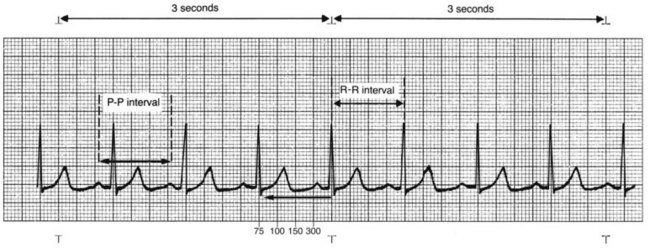
For accuracy, the big block method is used if the QRS complexes are regular or evenly spaced. Count the number of big blocks between the same point in any two successive QRS complexes (usually R wave to R wave) and divide into 300. There are 300 big blocks in 1 minute. It is easiest to use a QRS that falls on a dark line. If little blocks are left over when counting big blocks, count each little block as 0.2, add this to the number of big blocks, and then divide that total into 300 (Fig. 36-6).
Electrocardiographic Rhythm Analysis
1. Determine the heart rate. If the atrial and ventricular rhythms are regular, use any of the methods previously described to calculate the heart rate. If the rhythms are irregular, use the 6-second strip method for accuracy. Normal heart rates fall between 60 and 100 beats/min. A rate less than 60 beats/min is called bradycardia. A rate greater than 100 beats/min is called tachycardia.
2. Determine the heart rhythm. Heart rhythms can be either regular or irregular. Irregular rhythms can be regularly irregular, occasionally irregular, or irregularly irregular. Check the regularity of the atrial rhythm by assessing the PP intervals, placing one caliper point on a P wave and placing the other point on the precise spot on the next P wave. Then move the caliper from P wave to P wave along the entire strip (“walking out” the P waves) to determine the regularity of the rhythm. P waves of a different shape (ectopic waves), if present, create an irregularity and do not walk out with the other P waves. A slight irregularity in the PP intervals, varying no more than three small blocks, is considered essentially regular if the P waves are all of the same shape. This alteration is caused by changes in intrathoracic pressure during the respiratory cycle.
3. Analyze the P waves. Check that the P wave shape is consistent throughout the strip, indicating that atrial depolarization is occurring from impulses originating from one focus, normally the SA node. Determine whether there is one P wave occurring before each QRS complex, establishing that a relationship exists between the P wave and the QRS complex. This relationship indicates that an impulse from one focus is responsible for both atrial and ventricular depolarization. The nurse may observe more than one P wave shape, more P waves than QRS complexes, absent P waves, or P waves coming after the QRS, each indicating that a dysrhythmia exists. Ask these five questions when analyzing P waves:
4. Measure the PR interval. Place one caliper point at the beginning of the P wave and the other point at the end of the PR segment. The PR interval normally measures between 0.12 and 0.20 second. The measurement should be constant throughout the strip. The PR interval cannot be determined if there are no P waves or if P waves occur after the QRS complex. Ask these three questions about the PR interval:
5. Measure the QRS duration. Place one caliper point at the beginning of the QRS complex and the other at the J point, where the QRS complex ends and the ST segment begins. The QRS duration normally measures between 0.04 and 0.10 second. The measurement should be constant throughout the entire strip. Check that the QRS complexes are consistent throughout the strip. When the QRS is narrow (0.10 second or less), this indicates that the impulse was not formed in the ventricles and is referred to as supraventricular or above the ventricles. When the QRS complex is wide (greater than 0.10 second), this indicates that the impulse is either of ventricular origin or of supraventricular origin with aberrant conduction, meaning deviating from the normal course or pattern. More than one QRS complex pattern or occasionally missing QRS complexes may be observed, indicating a dysrhythmia.
Ask these questions to evaluate QRS intervals:
6. Interpret the rhythm. Using steps 1 to 5, you can interpret the cardiac rhythm and differentiate normal and abnormal cardiac rhythms.
Normal Rhythms
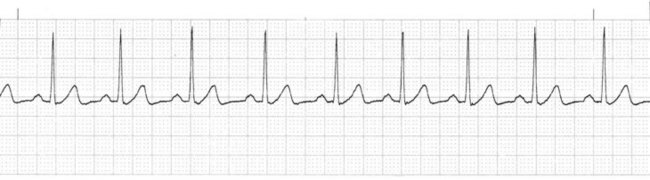
Normal sinus rhythm (NSR) is the rhythm originating from the sinoatrial (SA) node (dominant pacemaker) that meets these ECG criteria (Fig. 36-7):
• Rate: Atrial and ventricular rates of 60 to 100 beats/min
• Rhythm: Atrial and ventricular rhythms regular
• P waves: Present, consistent configuration, one P wave before each QRS complex
• PR interval: 0.12 to 0.20 second and constant
• Rate: Atrial and ventricular rates between 60 and 100 beats/min
• Rhythm: Atrial and ventricular rhythms irregular, with the shortest PP or RR interval varying at least 0.12 second from the longest PP or RR interval
• P waves: One P wave before each QRS complex; consistent configuration
• PR interval: Normal, constant
Dysrhythmias
Overview
• A disturbance in the relationship between electrical conductivity and the mechanical response of the myocardium
• A disturbance in impulse formation (either from an abnormal rate or from an ectopic focus)
• A disturbance in impulse conduction (delays and blocks)
Although many dysrhythmias have no clinical manifestations, many others have serious consequences if not treated. A summary of key features is found in Chart 36-1.
Sustained Tachydysrhythmias and Bradydysrhythmias
Dysrhythmia Terminology
• Shorten the diastolic time and therefore the coronary perfusion time (the amount of time available for blood to flow through the coronary arteries to the myocardium).
• Initially increase cardiac output and blood pressure. However, a continued rise in heart rate decreases the ventricular filling time because of a shortened diastole, decreasing the stroke volume. Consequently, cardiac output and blood pressure will begin to decrease, reducing aortic pressure and therefore coronary perfusion pressure.
• Increase the work of the heart, increasing myocardial oxygen demand.
The patient with a tachydysrhythmia may have:
Tachydysrhythmias may also lead to heart failure. Presenting symptoms of heart failure may include dyspnea, lung crackles, distended neck veins, fatigue, and weakness (see Chapter 37).
• Myocardial oxygen demand is reduced from the slow heart rate, which can be beneficial.
• Coronary perfusion time may be adequate because of a prolonged diastole, which is desirable.
• Coronary perfusion pressure may decrease if the heart rate is too slow to provide adequate cardiac output and blood pressure; this is a serious consequence.
Premature complexes may occur repetitively in a rhythmic fashion:
• Bigeminy exists when normal complexes and premature complexes occur alternately in a repetitive two-beat pattern, with a pause occurring after each premature complex so that complexes occur in pairs.
• Trigeminy is a repeated three-beat pattern, usually occurring as two sequential normal complexes followed by a premature complex and a pause, with the same pattern repeating itself in triplets.
• Quadrigeminy is a repeated four-beat pattern, usually occurring as three sequential normal complexes followed by a premature complex and a pause, with the same pattern repeating itself in a four-beat pattern.
Classification of Dysrhythmias
Sinus Dysrhythmias.
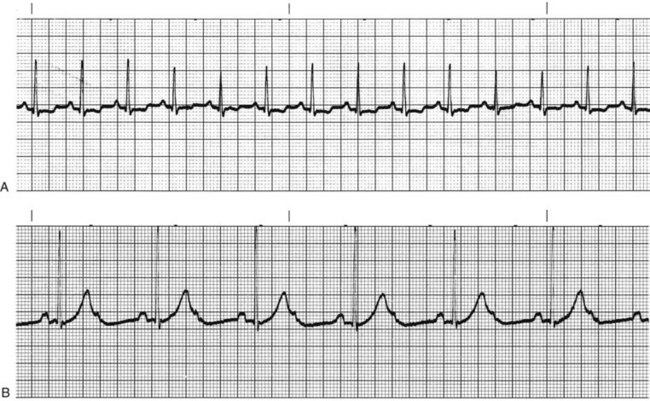
Sinus Tachycardia.
Sympathetic nervous system stimulation or vagal (parasympathetic) inhibition results in an increased rate of SA node discharge, which increases the heart rate. When the rate of SA node discharge is more than 100 beats per minute, the rhythm is called sinus tachycardia (Fig. 36-8, A). Sinus tachycardia, with temporary heart rates of 200 to 220 beats per minute, may be normal in infants and children. The rate gradually decreases until age 10 years. From age 10 years to adulthood, the heart rate normally does not exceed 100 beats per minute except in response to activity, and then usually does not exceed 160 beats per minute. Rarely does the heart rate reach 180 beats per minute.
 Nursing Safety Priority
Action Alert
Sinus Bradycardia.
The stimuli slow the heart rate and decrease the speed of conduction through the heart. When the sinus node discharge rate is less than 60 beats/min, the rhythm is called sinus bradycardia (Fig. 36-8, B). Sinus bradycardia increases coronary perfusion time, but it may decrease coronary perfusion pressure. However, myocardial oxygen demand is decreased. Well-conditioned athletes who are bradycardic have a hypereffective heart, in which the strong heart muscle provides an adequate stroke volume and a low heart rate to achieve a normal cardiac output.
 Nclex Examination Challenge
Health Promotion and Maintenance
Atrial Dysrhythmias.
Premature Atrial Complexes.
The causes of atrial irritability include:
• Caffeine, nicotine, or alcohol
• Drugs such as epinephrine, sympathomimetics, amphetamines, digitalis, or anesthetic agents
Supraventricular Tachycardia.
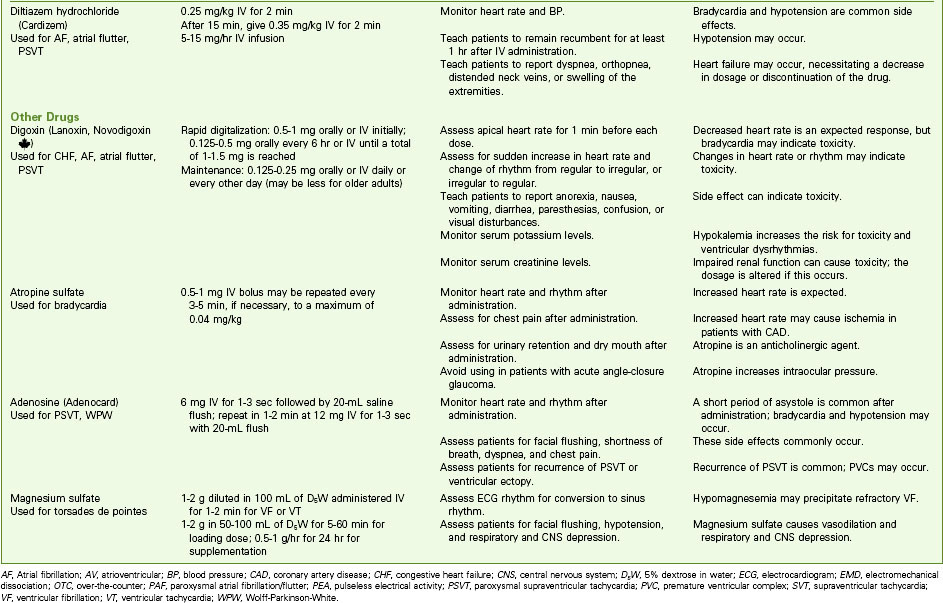
If SVT occurs in a healthy person and stops on its own, no intervention may be needed other than eliminating identified causes. If it continues, the patient should be studied in the electrophysiology study (EPS) laboratory. The preferred treatment for recurrent SVT is radiofrequency catheter ablation, described later in this chapter. In sustained SVT with a rapid ventricular response, the desired outcomes of treatment are to decrease the ventricular response, convert the dysrhythmia to a sinus rhythm, and treat the cause. Chart 36-2 lists drugs that may be used for SVT.
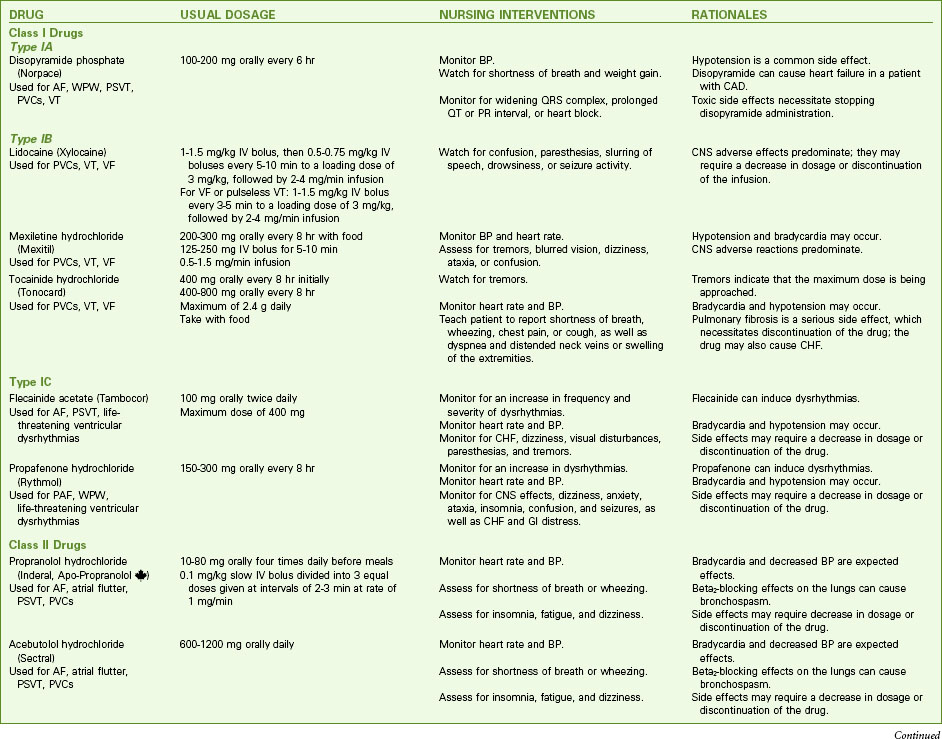
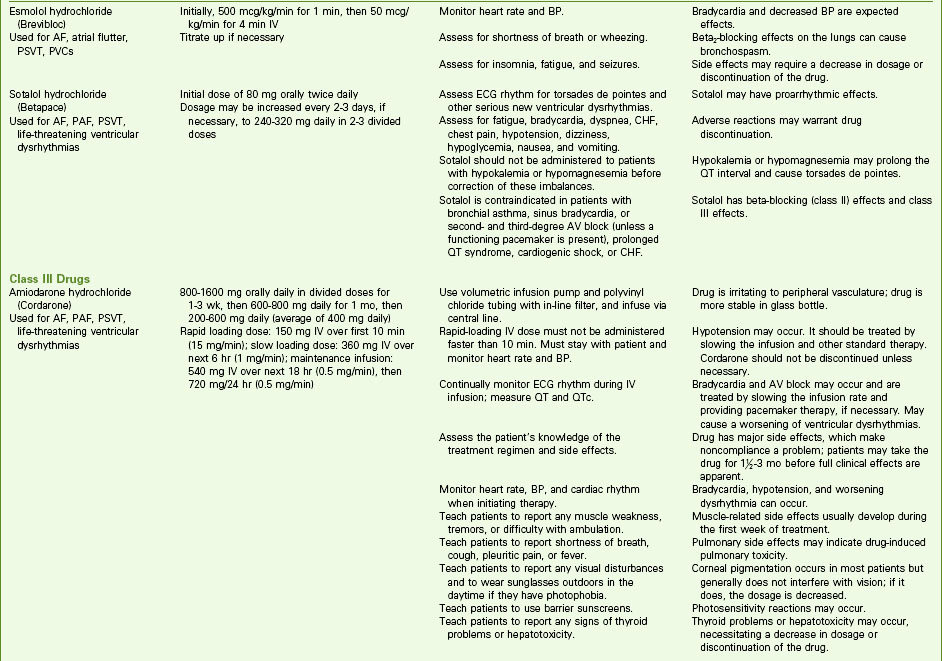
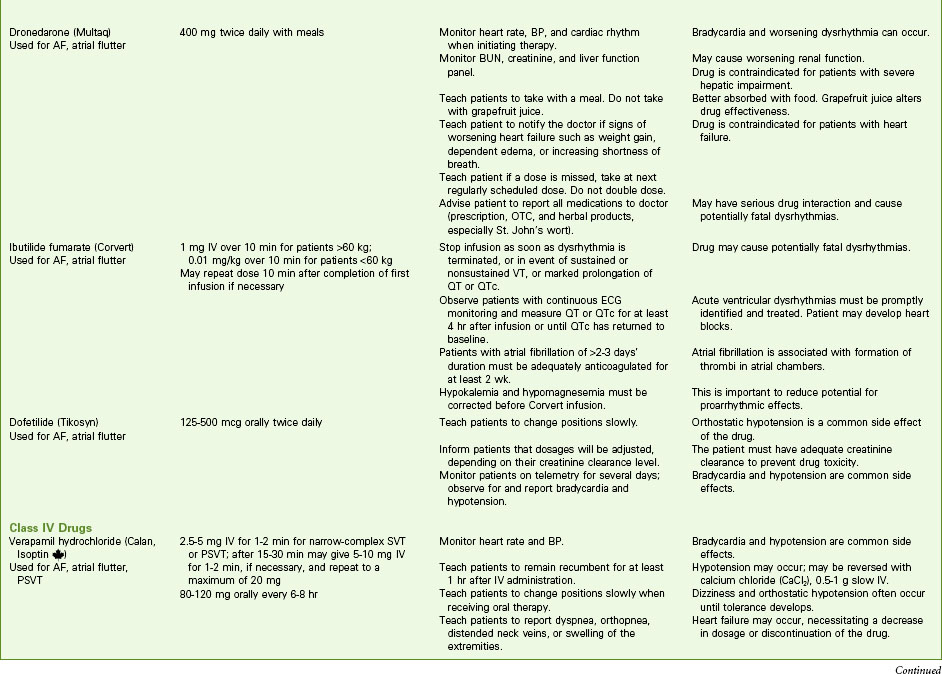
Chart 36-2 Common Examples of Drug Therapy
Common Dysrhythmias
< div class='tao-gold-member'>
Stay updated, free articles. Join our Telegram channel

Full access? Get Clinical Tree


