Describe activities that qualitative researchers perform to manage and organize their data
 Discuss the procedures used to analyze qualitative data, including both general procedures and those used in ethnographic, phenomenologic, and grounded theory research
 Assess the adequacy of researchers’ descriptions of their analytic procedures and evaluate the suitability of those procedures
 Define new terms in the chapter
Key Terms
 Axial coding
 Basic social process (BSP)
 Central category
 Constant comparison
 Core category
 Domain
 Emergent fit
 Hermeneutic circle
 Metaphor
 Open coding
 Paradigm case
 Qualitative content analysis
 Selective coding
 Substantive codes
 Taxonomy
 Theme
Theme
 Theoretical codes
Qualitative data are derived from narrative materials, such as transcripts from audiotaped interviews or participant observers’ field notes. This chapter describes methods for analyzing such qualitative data.
INTRODUCTION TO QUALITATIVE ANALYSIS
Qualitative data analysis is challenging, for several reasons. First, there are no universal rules for analyzing qualitative data. A second challenge is the enormous amount of work required. Qualitative analysts must organize and make sense of hundreds or even thousands of pages of narrative materials. Qualitative researchers typically scrutinize their data carefully, often reading the data over and over in a search for understanding. Also, doing qualitative analysis well requires creativity and strong inductive skills (inducing universals from particulars). A qualitative analyst must be proficient in discerning patterns and weaving them together into an integrated whole.
Another challenge comes in reducing data for reporting purposes. Quantitative results can often be summarized in a few tables. Qualitative researchers, by contrast, must balance the need to be concise with the need to maintain the richness of their data.

QUALITATIVE DATA MANAGEMENT AND ORGANIZATION
Qualitative analysis is supported by several tasks that help to organize and manage the mass of narrative data.
Developing a Coding Scheme
Qualitative researchers begin their analysis by developing a method to classify and index their data. Researchers must be able to gain access to parts of the data without having repeatedly to reread the data set in its entirety.
The usual procedure is to create a coding scheme, based on a scrutiny of actual data, and then code data according to the categories in the coding scheme. Developing a high-quality coding scheme involves a careful reading of the data, with an eye to identifying underlying concepts. The nature of the codes may vary in level of detail as well as in level of abstraction.
Researchers whose aims are primarily descriptive often use codes that are fairly concrete. The codes may differentiate various types of actions or events, for example. In developing a coding scheme, related concepts are grouped together to facilitate the coding process.
Example of a descriptive coding scheme
Ersek and Jablonski (2014) studied the adoption of evidence-based pain practices in nursing homes. Data from focus group interviews with staff were coded into broad categories of facilitators and barriers within Donabedian’s schema of structure, process, and outcome. For example, categories of barriers in the process group included provider mistrust, lack of time, and staff and family knowledge and attitudes.
Many studies, such as those designed to develop a theory, are more likely to involve the development of abstract, conceptual coding categories. In creating abstract categories, researchers break the data into segments, closely examine them, and compare them to other segments to uncover the meaning of those phenomena. The researcher asks questions such as the following about discrete statements: What is this? What is going on? What else is like this? What is this distinct from?
Important concepts that emerge from examining the data are then given a label. These names are abstractions, but the labels are usually sufficiently graphic that the nature of the material to which they refer is clear—and often provocative.
Example of an abstract coding scheme
Box 16.1 shows the category scheme developed by Beck and Watson (2010) to code data from their interviews on childbirth after a previous traumatic birth (the full study is in Appendix B). The coding scheme includes major thematic categories with subcodes. For example, an excerpt that described how a mother viewed this subsequent birth as healing because she felt respected during this subsequent labor and delivery would be coded 3A, the category for “Treated with respect.”
Box 16.1 Beck and Watson’s (2010) Coding Scheme for the Subsequent Childbirth After a Previous Traumatic Birth |
Theme 1: Riding the Turbulent Wave of Panic During Pregnancy A. Reactions to learning of pregnancy B. Denial during the first trimester C. Heightened state of anxiety D. Panic attacks as delivery date gets closer E. Feeling numb toward the baby Theme 2: Strategizing: Attempts to Reclaim Their Body and Complete the Journey to Motherhood A. Spending time nurturing self by exercising, going to yoga classes, and swimming B. Keeping a journal throughout pregnancy C. Turning to doulas for support during labor D. Reading avidly to understand the birth process E. Engaging in birth art exercises F. Opening up to health care providers about their previous birth trauma G. Sharing with partners about their fears H. Learned relaxation techniques Theme 3: Bringing Reverence to the Birthing Process and Empowering Women A. Treated with respect B. Pain relief taken seriously C. Communicated with labor and delivery staff D. Reclaimed their body E. Strong sense of control F. Birth plan honored by labor and delivery staff G. Mourned what they missed out with prior birth H. Healing subsequent birth but it can never change the past Theme 4: Still Elusive: The Longed for Healing Birth Experience A. Failed again as a woman B. Better than first traumatic birth but not healing C. Hopes of a healing home birth dashed |
Coding Qualitative Data
After a coding scheme has been developed, the data are read in their entirety and coded for correspondence to the categories—a task that is seldom easy. Researchers may have difficulty deciding the most appropriate code, for example. It sometimes takes several readings of the material to grasp its nuances.
Also, researchers often discover during coding that the initial coding system was incomplete. Categories may emerge that were not initially identified. When this happens, it is risky to assume that the category was absent in previously coded materials. A concept might not be identified as salient until it has emerged several times. In such a case, it would be necessary to reread all previously coded material to check if the new code should be applied.
Narrative materials usually are not linear. For example, paragraphs from transcribed interviews may contain elements relating to three or four different categories.
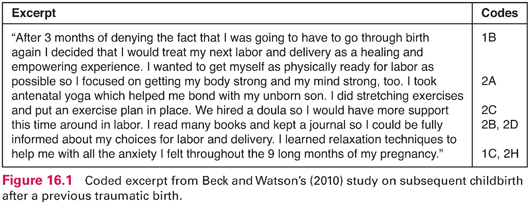
Example of a multitopic segment
Figure 16.1 shows an example of a multitopic segment of an interview from Beck and Watson’s (2010) subsequent childbirth after a previous traumatic birth study. The codes in the margin represent codes from the scheme in Box 16.1.
Methods of Organizing Qualitative Data
Before the advent of software for qualitative data management, analysts used conceptual files to organize their data. This approach involves creating a physical file for each category and then cutting out and inserting all the materials relating to that category into the file. Researchers then retrieve the content on a particular topic by reviewing the applicable file folder.
Creating conceptual files is a cumbersome, labor-intensive task, particularly when segments of the narratives have multiple codes. For example, in Figure 16.1, seven copies of the paragraph would be needed, corresponding to seven codes that were used. Researchers must also provide enough context that the cut-up material can be understood, and so it is often necessary to include material preceding or following the relevant material.
Computer-assisted qualitative data analysis software (CAQDAS) removes the work of cutting and pasting pages of narrative material. These programs permit an entire data set to be entered onto the computer and coded; text corresponding to specified codes can then be retrieved for analysis. The software can also be used to examine relationships between codes. Computer programs offer many advantages for managing qualitative data, but some people prefer manual methods because they allow researchers to get closer to the data. Others object to having a cognitive process turned into a technological activity. Despite concerns, many researchers have switched to computerized data management because it frees up their time and permits them to devote more attention to conceptual issues.
ANALYTIC PROCEDURES
Data management in qualitative research is reductionist in nature: It involves converting masses of data into smaller, more manageable segments. By contrast, qualitative data analysis is constructionist: It involves putting segments together into meaningful conceptual patterns. Various approaches to qualitative data analysis exist, but some elements are common to several of them.
A General Analytic Overview
The analysis of qualitative materials often begins with a search for broad categories or themes. In their review of how the term theme is used among qualitative researchers, DeSantis and Ugarriza (2000) offered this definition: “A theme is an abstract entity that brings meaning and identity to a current experience and its variant manifestations. As such, a theme captures and unifies the nature or basis of the experience into a meaningful whole” (p. 362).
Themes emerge from the data. They may not only develop within categories of data (i.e., within categories of the coding scheme) but may also cut across them. The search for themes involves not only discovering commonalities across participants but also seeking variation. Themes are never universal. Researchers must attend not only to what themes arise but also to how they are patterned. Does the theme apply only to certain types of people or in certain contexts? At certain periods? In other words, qualitative analysts must be sensitive to relationships within the data.
 | TIP Qualitative researchers often use major themes as subheadings in the “Results” section of their reports. For example, in their analysis of interviews about the experiences of 14 family caregivers of patients with heart failure, Gusdal and coresearchers (2016) identified two main themes that were used to organize their results: “Living in a changed existence” and “Struggling and sharing with healthcare.” Subthemes in the two categories were also given headings in the report. |
Researchers’ search for themes and patterns in the data can sometimes be facilitated by devices that enable them to chart the evolution of behaviors and processes. For example, for qualitative studies that focus on dynamic experiences (e.g., decision making), flow charts or timelines can be used to highlight time sequences or major decision points.
Some qualitative researchers use metaphors as an analytic strategy. A metaphor is a symbolic comparison, using figurative language to evoke a visual analogy. Metaphors can be expressive tools for qualitative analysts, but they can run the risk of “supplanting creative insight with hackneyed cliché masquerading as profundity” (Thorne & Darbyshire, 2005, p. 1111).
Example of a metaphor
Patel and colleagues (2016) studied the symptom experiences of women with peripartum cardiomyopathy. The researchers captured the nature of the main theme with the metaphor “Being caught in a spider web.”
A further analytic step involves validation. In this phase, the concern is whether the themes accurately represent the participants’ perspectives. Several validation procedures are discussed in Chapter 17.
In the final analysis stage, researchers strive to weave the thematic pieces together into an integrated whole. The various themes are integrated to provide an overall structure (such as a theory or full description) to the data. Successful integration demands creativity and intellectual rigor.
 | TIP Although relatively few qualitative researchers make formal efforts to quantify features of their data, be alert to quantitative implications when you read a qualitative report. Qualitative researchers routinely use words like “some,” “most,” or “many” in characterizing participants’ experiences and actions, which implies some level of quantification. |
In the remainder of this section, we discuss analytic procedures used by ethnographers, phenomenologists, and grounded theory researchers. Qualitative researchers who conduct descriptive qualitative studies may, however, simply say that they performed a content analysis. Qualitative content analysis involves analyzing the content of narrative data to identify prominent themes and patterns among the themes. Qualitative content analysis involves breaking down data into smaller units, coding and naming the units according to the content they represent, and grouping coded material based on shared concepts. The literature on content analysis often refers to meaning units. A meaning unit, essentially, is the smallest segment of a text that contains a recognizable piece of information.
Content analysts often make the distinction between manifest and latent content. Manifest content is what the text actually says. In purely descriptive studies, qualitative researchers may focus mainly on summarizing the manifest content communicated in the text. Often, however, content analysts also analyze what the text talks about, which involves interpretation of the meaning of its latent content. Interpretations vary in depth and level of abstraction and are usually the basis for themes.
Example of a content analysis
Herling and colleagues (2016) did a content analysis of semistructured interviews with 12 women with early-stage endometrial cancer who had had a robotic-assisted laparoscopic hysterectomy. Four overarching themes emerged: “Surgery was a piece of cake,” “Recovering physically after surgery,” “Going from being off guard to being on guard,” and “Preparing oneself by seeking information.”
Ethnographic Analysis
Analysis typically begins the moment ethnographers set foot in the field. Ethnographers are continually looking for patterns in the behavior and thoughts of participants, comparing one pattern against another, and analyzing many patterns simultaneously. As they analyze patterns of everyday life, ethnographers acquire a deeper understanding of the culture being studied. Maps, flow charts, and organizational charts are also useful tools that help to crystallize and illustrate the data being collected. Matrices (two-dimensional displays) can also help to highlight a comparison graphically, to cross-reference categories, and to discover emerging patterns.
Spradley’s (1979) research sequence is sometimes used for ethnographic data analyses. His 12-step sequence included strategies for both data collection and data analysis. In Spradley’s method, there are four levels of data analysis: domain analysis, taxonomic analysis, componential analysis, and theme analysis. Domains are broad categories that represent units of cultural knowledge. During this first level of analysis, ethnographers identify relational patterns among terms in the domains that are used by members of the culture. The ethnographer focuses on the cultural meaning of terms and symbols (objects and events) used in a culture and their interrelationships.
In taxonomic analysis, the second level in Spradley’s (1979) data analytic method, ethnographers decide how many domains the analysis will encompass. Will only one or two domains be analyzed in depth, or will several domains be studied less intensively? After making this decision, a taxonomy—a system of classifying and organizing terms—is developed to illustrate the internal organization of a domain.
In componential analysis, multiple relationships among terms in the domains are examined. The ethnographer analyzes data for similarities and differences among cultural terms in a domain. Finally, in theme analysis, cultural themes are uncovered. Domains are connected in cultural themes, which help to provide a holistic view of the culture being studied. The discovery of cultural meaning is the outcome.
Example using Spradley’s method
Michel and colleagues (2015) studied the meanings assigned to health care by long-lived elders and nurses in a health care setting. They used Spradley’s method of ethnographic analysis and identified and analyzed six domains. The overarching cultural theme that emerged was the real to the ideal—the health (un)care of long-lived elders.
Stay updated, free articles. Join our Telegram channel

Full access? Get Clinical Tree


