Sharing Research Knowledge During and After the Study
Key terms
Accessible
Dissemination
Linguistic sensitivity
Reporting
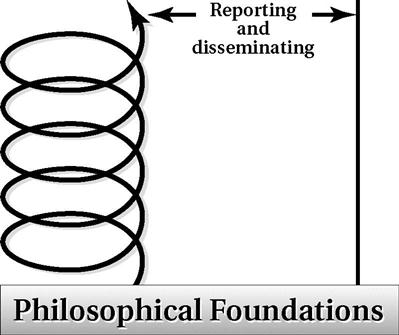
Although you may have completed the collection and analysis of information for a study, your efforts as a researcher are not quite complete. The 10th essential of research, “sharing research knowledge,” involves two important action processes: purposeful reporting and dissemination of knowledge gained from a study. Unless you report and disseminate, you have not completed the research process. Sharing knowledge is critical to knowledge building. Also, communicating knowledge gained from an inquiry with those who can benefit is an important ethical action.
By reporting research knowledge, we mean the preparation of a communication of all or part of an inquiry to one or more audiences. Dissemination follows reporting and is defined as the action process of purposely sharing the report. These action processes usually occur at the conclusion of a research project. Often, however, there are opportunities to communicate the progress of a study or report some of the methodological challenges before completing the actions of data collection and analysis. As example, many researchers participate in conference sessions designed to provide a venue for preliminary sharing of methods and results in order to obtain feedback to improve their projects.
Think about our definition of research in Chapter 1. Do you remember the four criteria to which a study must conform? These four criteria, which apply to any type of research inquiry, are the following: logical, understandable, confirmable, and useful. Reporting and disseminating are two research action processes that also reflect these criteria. However, “usefulness” is the one research criterion that cannot be accomplished without communicating to others the findings of a completed study and their meaning.
Reports are designed to fit a particular avenue or context that is chosen for the dissemination of research findings. The methods chosen for reporting research are purposeful. They are driven by several factors, the most important of which are the question or query and the particular audience or community on whom the researcher wants to have an impact. We believe that three basic principles should inform the action process of reporting: writing guidelines, accessibility, and linguistic sensitivity.
Writing and preparation guidelines
We begin our discussion with writing and preparation. For the mostpart reporting is shared through writing. However, more recent methods have been instrumental in creating new reporting methods, such as the creation of imagery to present research findings. Mapping is an example of images that are powerful in sharing results. It is not unusual for a single inquiry to generate multiple reports in multiple formats.
Because writing remains the primary method for reporting, we discuss this format now. As you probably have surmised by now, each type of inquiry has a distinct language or set of languages, images and structures that organize the reporting action process. However, all written reporting, regardless of the research tradition that the report will reflect, is based in a common set of guidelines.1 These include issues related to clarity, purpose, knowledge of target audience, and citation style.
Clarity
Writing a report serves little purpose if it is not understood.2 Therefore, an investigator should be certain that his or her report is clear and well written. There are many books on writing and many ways to approach this task, which is often difficult, particularly for the new investigator. As in any professional activity, the more you do it, the more proficient you will be and the easier the task will become. It is important to recognize that writing is an important aspect of the research process; it takes time, thought, and creative energy.
Purpose
As we have stated throughout this book, multiple purposes drive the selection of research action processes. These purposes also structure the nature of the reporting action process.3 Consider, for example, two different purposes for writing a report: for publication in a professional journal and a written evaluation for a community organization. Researchers who write for the purpose of publishing their research in scholarly journals must conform to the style and expectations of the journal to which the manuscript is submitted. The researcher may also consider writing an article for practitioners and thus will present results and interpretations somewhat differently. The researcher who has just completed an evaluation of a community program may need to write a report to the board of directors or the funding agency to ensure continuation of financial support. In this case, the researcher may emphasize positive programmatic outcomes and write the research report consistent with the expectations of the funding agency. For the journal, a full and detailed report using the technical and professional language of the journal and readership would be warranted. However, for the agency, an executive summary with bullet points might be a better means through which to report findings. Each purpose for conducting and reporting research must be carefully considered.
Multiple Audiences
As stated earlier, being aware of the many audiences that can benefit from an inquiry is critical to meet the “useful” criterion in our definition of research. Audiences are diverse in their languages, the meanings they attribute to language, and their values regarding credibility. Thus, along with purpose, the audiences for whom the report is written will determine, in large part, how the report will be structured, what information is contained within it, how the information is presented, and the degree of specificity that will be included. The audience may vary in areas of expertise and knowledge of research methodology. The important point is to identify your reason for writing a report to a particular audience and to assess how that purpose can be communicated to that audience. You need to write in a style that is consistent with the level of understanding and knowledge of the targeted reader. As an example, suppose you have completed a participatory action research project in which individuals with intellectual disabilities functioned as researchers and informants to identify recreation needs in rural communities. Careful attention to the literacy levels of multiple audiences including those with cognitive challenges would be warranted. To this end, the concepts of accessibility and linguistic sensitivity are important, as discussed later.
Citations
You need to be aware of several other important points as you develop reports. The first is the issue of plagiarism. We realize that most researchers who plagiarize do not intend to do so. To avoid this potential and devastating mistake, you need to be aware of the norms for citation and credit. All work produced by another person, even if not directly quoted in your work, must be cited. Many different citation formats are used in health and human service research. We refer you to your publication source for the correct format and urge you to become familiar with it. If necessary, have someone else check your work to ensure that you have properly credited other authors.
Another important point to remember in report writing is that it is not an acceptable practice to excessively quote from other research studies in the literature review of an article for a journal. Many students of research like to review a body of literature by stringing together a series of quotes from different articles. However, the review of the literature section in a report must reflect a summation and critical analysis of the most salient aspects of existing studies. Quoting simply reiterates the work of others without synthesis and critical commentary.
Another common error among newcomers to formal writing is the use of citations that you have not directly read. Consider the following example.
 You read an article by an author, Dr. Smith, and in her review of the literature, she cited a number of other authors and their studies. You are interested in these other studies and include them in your study on the basis of your reading of Dr. Smith’s article, and you cite them in your reference list. However, you have never obtained and read the original articles. In this case, you are actually using Dr. Smith’s interpretations of these studies. Remember, Dr. Smith selected the most salient points from these studies that supported her particular approach. Therefore, her interpretation may be different from the intent of the original work. If you had read the articles yourself, you may have derived a different understanding. In writing a research report, only primary citations are acceptable.
Therefore, you have two choices. You can report Dr. Smith’s interpretation of the studies she reviewed and cite her article in your reference list. For example, you may say, “According to Dr. Smith, the literature on the adequacy of home care for elders is underdeveloped.” A second strategy is to retrieve the articles cited in Dr. Smith’s report, read them, and report your interpretation of this body of literature. In this case, you will then cite each study you read and include it in your reference list.
Before we leave the section on citation, we call your attention to the wonders of technology. As we noted earlier, citation formats differ according to discipline and venue. Before the advent of electronic databases and automated formatting, one major element of report preparation was formatting the reference section and citations within the text. Now, with software programs such as Endnote and embedded bibliographic databases in word processing programs, citing and referencing is a snap. All you need to do is enter complete information about a source into fields in your database and select the format. The software does the rest by automatically locating citations in the text and formatting your reference or bibliography according to the style that you have chosen.
With these commonsense principles, let us now consider the specific writing considerations for each tradition.
Writing and presenting an experimental-type report
Reports of experimental-type research use a common language and follow a standard format and structure for presenting a study and its findings. The language used by the experimental-type researcher is “scientific” in nature. It is logical and detached from personal opinion. Interpretations are supported by numerical data. There are usually seven major sections of an experimental-type report (Box 22-1). Although investigators sometimes deviate from this order of presentation, these sections are usually considered the critical components of a scientific report. Let us examine each section.


The abstract appears before the full report and briefly summarizes or highlights the major points in each subsequent section of the report. It includes a statement of the research purpose, brief overview of method, and summary of the major findings and implications of the study. Usually the abstract does not exceed one or two paragraphs. Professional journals usually specify the length of the abstract; some journals require brief abstracts that are no longer than 100 words.
The introduction presents the problem statement, the purpose statement, and an overview of the questions that the study addresses. In this section, the researcher embeds the study in a particular body of literature and highlights the study’s specific intended contribution to the disciplinary and professional knowledge and practice.
The background and significance section reviews the literature that provides the conceptual foundation for your research study. In this section, key concepts, constructs, principles, and theory of the study are critically summarized. (Refer to your literature chart or concept matrix to help organize the background and significance section.) The degree of detail in presenting the literature will depend on the researcher’s purpose and intended audience. For example, in a journal article the researcher usually limits the literature review to an overview of the broad field of inquiry and then focuses on the seminal works that precede the study, whereas in a doctoral dissertation, all previous work that directly or indirectly informs the research question is detailed and critically reviewed. Some researchers combine the introduction and literature review into one section. Grinnell and Unrau3 named the combined introduction and literature review “the problem statement.”
The method section consists of several subsections, including a clear description of the design, an explication of the research question or questions, the population and sample, the measures or instrumentation, the specific data analysis strategies, and the procedures used to conduct the research. The degree of detail and specificity is again determined by the purpose and audience. However, sufficient information must be provided in each subsection of methods so that the reader has a clear understanding of how data were collected and the specific procedures that were implemented.
The analyzed data are presented in the results section. Usually, researchers begin by presenting descriptive statistics of their sample, then proceed to a presentation of inferential and associational types of statistical analysis. A rationale for statistical analysis is presented, and the findings are usually explained. However, interpretation of the data is not usually presented in this section. Data may be presented in narrative, chart, graph, or table form. You should be aware that there are prescribed formats for presenting statistical analyses. Ary et al.4 provided excellent information to guide both the preparation and the evaluation of written reports.
The discussion section may be the most creative part of the experimental-type research report. In this section the researcher discusses the implications and meanings of the findings, poses alternative explanations, relates the findings to published work contained in the literature review, suggests the potential application or use of the research results. Most researchers include a statement of the limitations of the study in this section as well, although this can also be found in the sections that discuss methods or findings.
The conclusion section is a short summary that provides interpretations and application of the study findings to future research directions or health care and human service practices.
As you can see, writing an experimental-type report follows a logical, well-accepted sequence that includes seven essential sections. The degree of detail and precision in each section depends on the purpose and audience for the report.
Also, it is important to note that there is a specific reporting structure for the true experimental design, the randomized controlled trial. Because this design strategy requires highly specified elements, such as randomization, a control group, a treatment group, and analysis and interpretation of treatment effects, the reporting follows a rather uniform presentation.
CONSORT Reporting
To enhance the scientific utility and transparency of each action process in this design strategy, efforts have been made to standardize the reporting of trials. In the 1990s, an international body of researchers engaged in clinical trials put forth the Consolidated Standards of Reporting Trials (CONSORT) in an effort to provide standard language and structure and enhance the ability of readers to evaluate the validity of trials. The CONSORT includes a checklist of the items that should be included in a report of a trial and a flow diagram indicating enrollment and participation status of study subjects. It has been adopted by many medical journals, including The Lancet and the Journal of the American Medical Association, which now require written manuscript submissions that are reporting trials to use the checklist and flow diagram.5 For example, the checklist for the method section indicates the need to report the following design elements: participants, interventions, study and intervention objectives, outcome measures, sample size, randomization procedures, blinding techniques, and statistical methods.6
Preparing tables and figures
Tables and figures are important parts of experimental-type research reports. They reduce complicated data by systematically organizing important findings. Different from narrative, which tells a story, tables and figures present visuals of rankings, relationships, and significance. In experimental-type reports, tables, charts, and figures are used to present data in the results section of a report.
Tables present numeric data in rows and columns, whereas charts are displays of information that may be numeric but may also be in the form of a picture or image. Both tables and charts can be univariate (presenting data from one variable) or multivariate (presenting data depicting the relationships among two or more variables). Tables also can present related numeric information, most typically raw scores adjacent to computed values of a statistic and probability.
Among the most frequently used univariate charts are pie charts (depicting relative percentages), bar charts comparing frequencies, scatterplots, and curves (such as the bell curve) showing the distribution of scores on a variable.
With the increasing use of computer programs, figures and tables are simple to create. Even freeware has built-in automated functions that convert numeric findings from numbers into tables. Of course, we have all seen tables and figures of the same data that visually present different pictures. Care should be taken to create figures, tables, and charts that are not misleading but are designed to clarify and highlight important findings. Your narrative about these visuals should call attention to important points and trends without repeating what is contained within the visual displays.
Consider the example of age. Suppose you have the following ages represented in your sample: 21, 25, 56, 67, 30, 32, 35, 65, 62, 32, and 25. What might you want to communicate about age? You could rank order the numbers from youngest to eldest for clarity, but you might want to make it easier for your readers to understand the age trends of your sample.
You might want to use a table to show the two extremes in your sample:
 Under 50
Over 50
6 (60%)
4 (40%)
Stay updated, free articles. Join our Telegram channel

Full access? Get Clinical Tree


