Preparing and Organizing Data
Key terms
Codebook
Data reduction
Database management
Memoing
Narrative
Raw data file
Transcription
Variable label
After learning about various strategies that researchers use to collect information, you may be asking what exactly the investigator does with all this collected information.
When you begin to collect information, you will find that you quickly obtain a massive amount of data and that you need to organize and account for every piece of it in a meaningful way. In experimental-type research, even a small survey study may yield more than 100 variables or data points for analysis. Think about all the items you need to
ask about even if your study is small or a pilot. Information concerning the person’s age, gender, other relevant personal characteristics, and living status are all important and common data points. Likewise, in naturalistic inquiry, a 1-hour interview may yield up to 50 or more pages of single-spaced typed narrative.
Organizing, or what we refer to as “managing,” all this information, whether the data take a numerical or narrative form, is an important action but is not usually discussed or written about by researchers. Most researchers learn to manage data through trial and error or by participating in the research process as mentored students or in graduate or postdoctoral training programs. Nevertheless, researchers in both traditions must engage in specific actions to prepare information for analyses that can be described and learned. This chapter discusses this specific action process—the action of preparing and managing information in each of the research traditions.
Managing data in experimental-type research
If you are conducting an experimental-type study, what type of data will you be collecting? Because you will be primarily interested in obtaining a quantitative understanding of phenomenon, your data will be numerical. The analysis of numerical data is an action process that is performed after all the data have been collected for the study. That is, at the conclusion of collecting data, you will have many numerical responses to each of your questionnaires, interviews, and observations.
 Consider a small study involving a survey of 100 students in a college of health professions. Assume the survey is designed to examine student satisfaction with the quality of health profession education. The survey will likely include a number of background questions, such as gender, level of education, financial assistance, marital status, and living arrangement of students. The survey will also include a scale that measures satisfaction with education, as well as a series of questions about other aspects of college life. As you will see, this type of study may have 50 to 100 items or variables that will be measured. In a study involving 100 students, this may represent a total of 10,000 data points that will be submitted to statistical analysis. Thus, even in a relatively small study, the amount of information obtained can be enormous and requires the assistance of computer technology.
After collecting all this information, what does the researcher do next? For experimental-type researchers, the primary action process is to prepare and organize the data first for entry into a computer program and then for statistical analyses. The researcher follows seven basic steps (Box 18-1).
First, the researcher must examine each interview or data collection form to check for missing information, double-coded responses, or unclear demarcations of responses. This information reflects possible interviewer errors that must be corrected before entering the numerical values into a computer program. The researcher should attempt to address all missing data before data entry. This step may require contacting respondents and seeking answers to missed questions or clarification for double-coded responses.
Second, the researcher must label each variable on the data collection instrument using a convention specified by the statistical package used. Statistical Analysis Software (SAS), Statistica, or the Statistical Package for the Social Sciences (SPSS) are three of the most popular, menu-driven, statistical computer programs that run on personal computers. Each package has a specific convention for labeling variables that is logical and straightforward.
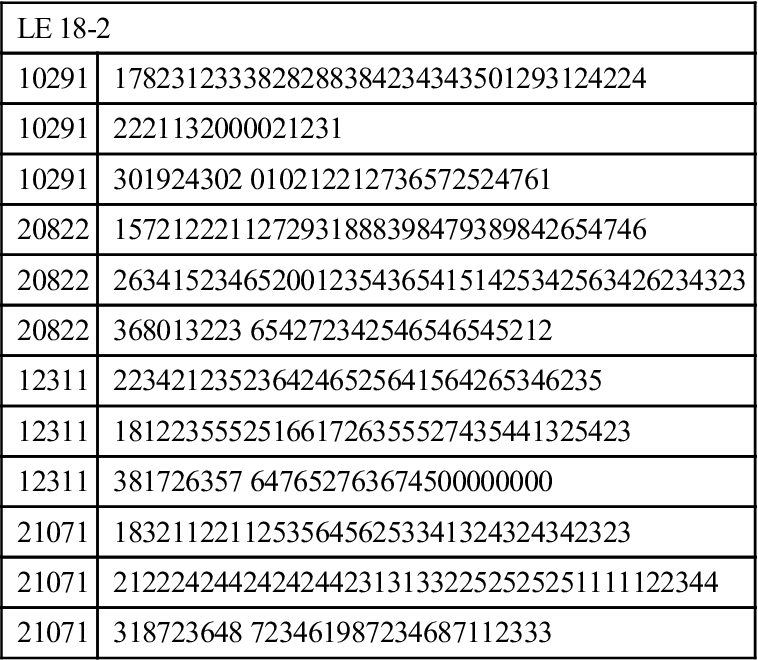
Third, the researcher must decide the order in which the variables will be entered into a data entry computer program. Most researchers use the convention of placing each observation along an 80- to 120-column format (Table 18-1). Usually, each subject or research participant is assigned a unique identification number located in the first 10 columns of a line or row, depending on the length of the case identifier. If there is more than one line of data for a case, the subject identification number is repeated for each row of data. In Table 18-1, each number represents a response to a data collection instrument—in this case, a closed-ended questionnaire. These numbers are often referred to as a “raw data set” and form the foundation from which the experimental-type researcher performs statistical manipulations. A data set merely consists of all the numbers obtained through data collection, which are organized in the data entry program according to the format designed by the researcher. Data are usually entered in the order in which the items are sequenced on the data collection form.
 In Table 18-1, the first column on each line refers to the subject’s group assignment (i.e., experimental or control group). Columns 02 through 04 refer to the personal identification number. Column 05 indicates the subject’s gender (1 = male; 2 = female). Column 06 is blank, and 07 refers to the line number.
TABLE 18-1
| LE 18-2 | |
| 10291 | 1782312333828288384234343501293124224 |
| 10291 | 2221132000021231 |
| 10291 | 301924302 010212212736572524761 |
| 20822 | 1572122211272931888398479389842654746 |
| 20822 | 26341523465200123543654151425342563426234323 |
| 20822 | 368013223 654272342546546545212 |
| 12311 | 2234212352364246525641564265346235 |
| 12311 | 181223555251661726355527435441325423 |
| 12311 | 381726357 647652763674500000000 |
| 21071 | 183211221125356456253341324324342323 |
| 21071 | 212224244242424423131332252525251111122344 |
| 21071 | 318723648 723461987234687112333 |
In the fourth step, the researcher establishes a computer-based control file that consists of a list of the variable labels. Also, a written or electronic record can be generated, referred to as a codebook or “data definition record.” This written record is a hard or electronic copy of the variable labels and the range or values that they represent. Some software statistical programs provide a separate window in which you can prepare a codebook simply by entering code information about your data set into menu-driven formats.
The fifth step involves entering the numerical values into a computer-based program by a scanner, automatically from Web-based data collection protocols, or by manual entry. Although there are a variety of data entry programs, they are basically similar. For small data sets (e.g., those under 50 variables), data entry can be conducted using a spreadsheet or database management program (e.g., Lotus 1-2-3, Microsoft Excel, FoxPro, Microsoft Access). For large data sets, it is preferable to use a computer-based program that has been specifically developed for the purpose of entering data. Most data entry computer programs enable the investigator to check for out-of-range codes, and some programs provide double verification. These are important quality-control features. Wild codes and out-of-range codes refer to errors in entering data in which characters or numbers entered in the program do not reflect the possible numerical scores assigned to the variable.
 Assume the only responses to a question regarding marital status are 1 for “not married” or 2 for “married.” The data entry operator, however, inadvertently types a 3. A data entry program can be created that will signal the operator that an error has been made or that will not permit the score of “3” to be entered.
For manual entry, it is preferable to enter data twice, on two separate occasions. Then a comparative program can compare each numerical entry against itself, referred to as double verification. The program either alerts the key operator when a discrepancy between two entries occurs, or it allows the operator to inspect the two entries visually to determine discrepancies. For discrepant entries, the keyed responses must be manually checked against the original hard copy of the instrument to determine the correct value. Scanning data or direct entry of information at the moment it is being gathered eliminates the need for double verification. However, these approaches are not 100% accurate either, and the data that is entered stills needs to be checked to ensure accuracy.
The sixth step in preparing experimental-type data involves a process of “cleaning” the data that have been entered into the computer, regardless how data entry occurs. Cleaning data is an action process in which the investigator checks the inputted data set to ensure that all data have been accurately transcribed from the data collection instrument to the computer entry program. This action step is essential to determine the extent of missing information, to ensure that each response has been correctly coded, and to confirm that no errors were made in entering the numerical scores into the computer. For scanned data or direct entry of data at time of data collection, conducting logical checks of the data is one way to ensure accuracy. For example, let’s suppose you enrolled only individuals 70 years of age or older. Checking the range of ages entered in the data set would be one way to detect potential errors.
 If the age of a subject was entered in a data entry program as 27 years rather than the true age of 57, this error would certainly skew an understanding of the mean age and range of ages represented in the study sample.
Thus, one important way to inspect the data for errors is computing the frequencies of responses for each variable in the data set. In addition to checking frequencies, some researchers manually check a random number of lines of data against the original hard copy of the data collection instrument. Others use these methods in combination with printing raw data files sorted both by line and subject identification numbers. These printouts allow the researcher to visually inspect for misaligned data, as well as for wild and out-of-range codes. However, this kind of quality check is not possible or necessary when data is directly entered into a Web-based or other data entry program.
In Chapter 15, we discussed the possibility of having either random or systematic errors. Data entry represents a possible source of random error.
Think about a particular study you plan to conduct or about which you have just read in a journal. Consider the way in which you will enter the information you will collect. What are the possible data errors that might occur with the method you chose? How can the researcher address them? Researchers use many techniques to clean data and reduce sources of random error.
 Assume you use a scale to ascertain the level of dependence in basic activities of daily living of the study sample. The possible responses for each self-care item range from 4 for “completely independent” to 1 for “completely dependent.” When you compute the frequencies for each self-care item, you discover that “bathing” has two responses with a value of 5. You will immediately know by inspecting the frequencies that the data are not correct. You will need to identify the subject identification numbers of the two individuals with the out-of-range values, then manually check their interview forms to determine the source of the error. The error may have been made inadvertently by the interviewer or data entry operator.
Stay updated, free articles. Join our Telegram channel

Full access? Get Clinical Tree


