Using NDNQI Reports for Quality Improvement
Effective quality improvement (QI) involves a series of steps or phases. Once a problem is identified, the QI team examines potential causes, then selects evidence-based structure and process remedies. Structure and process changes are implemented and adjusted as needed. Data from NDNQI® reports let nurses identify problem areas, explore possible causes, and monitor the effects of an improvement initiative. This chapter describes the QI steps (listed in Figure 1) and the role of NDNQI reports. Excerpts from the case studies in Chapter 3 are used to illustrate each step.
Over the years and across professions, authors have used various terms to describe the activities involved in quality improvement. Exact words and illustrations may vary, but all approaches to quality improvement share the same core elements. The particular author and the specific steps followed are less important than the use of an organized approach. An organized approach keeps the QI team focused and thorough, and helps to avoid reactionary changes made in an effort to quickly “do something”. The steps described here fit within the PDCA cycle. The steps are “linear” (that is, they proceed in order), but the first and last steps are not the beginning and end. In practice, QI is ongoing and best thought of as an upward spiral.
Identify Problematic Areas
Opportunities for improvement can be identified in numerous ways: bedside staff input, audits of medical records, occurrence of a serious adverse event, deviations from usual performance, and comparison to peers. Consistent measurement of quality indicators is an efficient way to recognize gaps between actual and ideal performance. Data is the driving force behind problem identification.
The Restraint and Fall Committee examined monthly fall data and used NDNQI benchmarks to evaluate total and injury fall rates … The previous fall program was noted by staff and nursing leadership to no longer be effective. Multiple acute care nursing units had injury fall rates above the NDNQI mean in 3Q07 and there had been several falls with major injuries. (Memorial Hospital)
Visual tools that display repeated measures of an outcome over time (e.g., control charts) facilitate recognition of problematic areas (Langley et al., 2009). NDNQI graphs allow nurses to track their quality indicators over time, with the added benefit of comparison to peers. NDNQI comparison data features
percentiles, which are calculated from a rank ordering of units. For example, NDNQI analysts list the catheter-associated urinary tract infection (CAUTI) rates on adult critical care units in non-teaching hospitals from lowest to highest. The 75th percentile is the level at which 75% of these critical care units have lower CAUTI rates. In Figure 2, the 75th percentile is represented by the top of the gray bar. The critical care unit in this example often has CAUTI rates above the 75th percentile, which indicates a definite need for improvement.
percentiles, which are calculated from a rank ordering of units. For example, NDNQI analysts list the catheter-associated urinary tract infection (CAUTI) rates on adult critical care units in non-teaching hospitals from lowest to highest. The 75th percentile is the level at which 75% of these critical care units have lower CAUTI rates. In Figure 2, the 75th percentile is represented by the top of the gray bar. The critical care unit in this example often has CAUTI rates above the 75th percentile, which indicates a definite need for improvement.
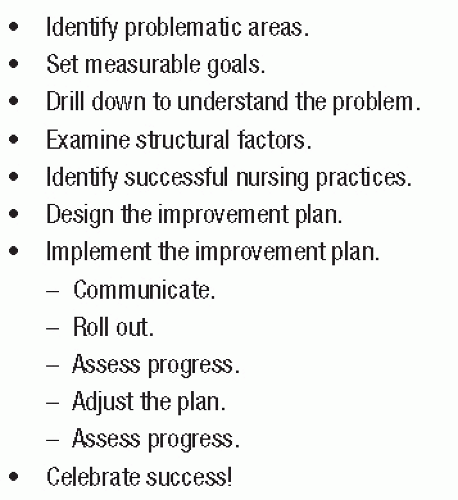 FIGURE 1. Steps Toward Improved Nursing Quality |
NDNQI percentiles provide normative standards for judging quality. The nurse manager of a unit with injury falls rates consistently above the 50th percentile (the median) knows that over half of the unit’s peers have fewer injury falls. Until 2008, NDNQI reports provided the mean instead of the median (50th per centile) for most indicators. Many hospitals used the mean (average) to identify problems. However, the mean is inflated when a few units have unusually high rates of adverse events. In such situations, the median is a more accurate reflection of “average” performance (Polit & Hungler, 1999). Therefore, the median is preferred over the mean when evaluating patient outcomes.
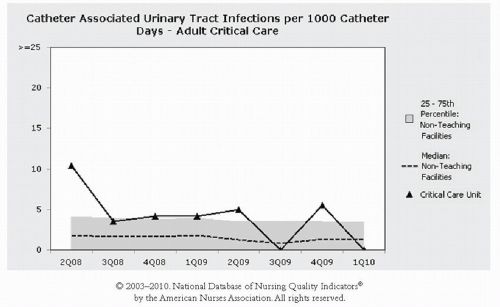 FIGURE 2. Sample NDNQI Graph (Simulated Data) |
The NDNQI median represents “middle-of-the-road” quality. The 10th, 25th, 75th, and 90th percentiles in NDNQI reports provide the distribution of performance and can help identify the degree of a problem. A unit with hospital-acquired pressure ulcers (HAPUs) above the 75th percentile should recognize that 75% of their peers have better HAPU rates. Similarly, a pediatric unit whose average number of pain assessments is at the 10th percentile would understand that 90% of peer units provide more frequent pain assessments.
Such reports should definitely spur these units to pursue the remaining QI steps described in this chapter.
Such reports should definitely spur these units to pursue the remaining QI steps described in this chapter.
HAPU rates in the intensive care units … were near the 90th percentile for NDNQI … in 2005 and 2006 … Subsequently, a series of changes in daily practice were used to promote a culture of HAPU prevention. (Scripps Memorial Hospital, La Jolla)
Once a problem is identified, a “process owner”, someone who will be responsible for the entire improvement effort, should be selected. While support from hospital executives is necessary, the owner may be a manager or clinician who can lead the improvement (Berwick, Godfrey, & Roessner, 1990). The owner works with an interprofessional team to further define the problem, implement improvements, and measure progress. The team can be newly formed or an existing group (e.g., quality council) and can be unit-based or hospital-wide depending on the scope of the problem. Representatives from multiple professions (nursing, medicine, pharmacy, physical therapy, hospital resource management, etc.) and from multiple levels of the organization (unit managers, bedside nurses, executives) bring unique views and solutions to the problem. Hospitals often form and empower interprofessional outcome-specific teams (such as a pressure ulcer prevention team) to continually design, test, and implement changes.
The Best Practice Council identifies quality problems and creates interprofessional teams to review and test evidence-based practices. These smaller teams identify promising interventions and test them in the current environment to ensure positive impact. The team then makes recommendations to the larger Best Practice Council, which then mandates the practice change throughout the organization. The Patient Falls Prevention Team … included nursing staff and management, physical therapy, radiology, clinical nurse specialists, and nursing research. (St. Luke’s Episcopal Hospital)
Before making any changes, the team should clearly define their purpose and examine possible causes of the problem. Setting goals and “drilling down” to the root of the problem are the next steps.
Set Measurable Goals
Goals keep a team focused and provide a ruler for measuring progress. Useful goals are quantifiable and specify the indicator, units, and timeframe. For example:
Achieve injury falls rates below the NDNQI 25th percentile for medical—surgical units in Magnet® hospitals by 3Q11.
Reduce the percent of critical care patients with unitacquired pressure ulcers by half within six months.
By March, patients on the pediatric surgical-trauma unit will be assessed for second-quarter pain hours in accordance with unit policy.
NDNQI reports provide ready-made goals. Percentiles tell you what qualifies as average, above average, and excellent quality (see Table 1). An acceptable mid-way goal is to reduce negative outcome rates to below the median. At the median (the middle), 50% of similar units have higher rates and 50% have lower rates. If a unit’s total falls per 1,000 patient days had been above the 75th percentile, achieving fall rates below the median would represent a considerable improvement. However, the median does not necessarily represent ideal care. NDNQI percentiles are based on actual practice, with some hospitals attaining the desired goals of zero—e.g., for fall rates—not because the value is above average and is above the 50th percentile. Being at the median shows your quality of nursing care is “typical” or “average” compared to your peers.
For negative outcomes, above average quality is seen in the 25th percentile. A unit with catheter-associated urinary tract infections at or below the 25th percentile is in the top 25% of peers. Excellent care, or best practice, is reflected in the 10th percentile. A unit with total falls at or below the 10th percentile is in the top 10% of peers. For positive structure or process indicators such as RN hours per patient day, percent of
RNs with certification, or pediatric pain assessment, the 90th percentile shows best practice.
RNs with certification, or pediatric pain assessment, the 90th percentile shows best practice.
TABLE 1. Guidelines for Evaluating Nursing Quality Measures Based on NDNQI Percentiles | ||||||||||||||||||||||||
|---|---|---|---|---|---|---|---|---|---|---|---|---|---|---|---|---|---|---|---|---|---|---|---|---|
| ||||||||||||||||||||||||
Targets to continue reducing the rate of hospitalacquired pressure ulcers were established annually as follows:
FY07 = NDNQI mean or better
FY08 = NDNQI mean or better
FY09 = NDNQI 50th percentile or better
FY10 = NDNQI 25th percentile or better (Washington Hospital Center)
Drill Down to a Better Understanding
To design effective improvements, an examination of the problem and its causes is needed. The team should invest some time drilling down to the problem’s core. In some cases, a problem’s causes and solutions may be quite obvious. In others, a little digging may reveal an unexpected process at work.
Nursing leadership … quickly identified several key issues contributing to HAPU prevalence. The hospital had very limited expert resources, specifically 1.5 FTEs for Certified Wound, Ostomy, and Continence Nurses (CWOCN) for 530 beds. There was also a lack of knowledge among all staff, lack of bedside expertise, lack of standardized protocols, ineffective utilization of Braden scores, equipment issues, and inadequate communication of timely HAPU prevalence data at the unit level. (Shands Hospital at University of Florida)
As the PDCA team investigated the 2007 CAUTI cases, they found … patients who developed a CAUTI were most often those who were assessed to be a high fall risk. The team hypothesized that some of the infections were related to prolonged use of the catheter to decrease the patient’s movement to the bathroom and mitigate a potential for a fall. (Medical Center of the Rockies)
Information from multiple sources paints a clearer picture of the problem. The team can examine medical records, review patient satisfaction surveys, and interview or observe direct-care providers.
The team recognized the necessity of conducting an institutional needs assessment as their first step in improving pain management … Results from the survey of more than 300 staff demonstrated need for improvement in several areas, including standardized assessment and documentation … Of the patients and parents who responded to the team’s survey, 28% responded that a pain rating scale was not used to assess pain. (Advocate Hope Children’s Hospital)
Health care has borrowed numerous analysis tools from the manufacturing industry (Graban, 2009; Ursprung & Gray, 2010). Tools such as root cause analysis and
process mapping can reveal the sources of poor outcomes. For example, in root cause analysis, teams diagram the details of a specific case, then repeatedly ask, “Why did this happen?” until the underlying causes are exposed (Ursprung & Gray, 2010). Several authors have provided excellent guides for conducting effective root cause analyses (Pham et al., 2010; Ursprung & Gray, 2010).
process mapping can reveal the sources of poor outcomes. For example, in root cause analysis, teams diagram the details of a specific case, then repeatedly ask, “Why did this happen?” until the underlying causes are exposed (Ursprung & Gray, 2010). Several authors have provided excellent guides for conducting effective root cause analyses (Pham et al., 2010; Ursprung & Gray, 2010).
NDNQI reports also help teams drill down. By examining NDNQI structure and process indicators, teams can identify factors contributing to undesirable patient outcomes. If a unit’s total hours of nursing care per patient day is below the 25th percentile, or their use of agency personnel is higher than 90% of their peers, improved staffing may be part of the solution.
Exploration of the causes for the high [HAPU] rates included structural and process issues … During the first quarter of 2006 … 2G had a high staff turnover. Four temporary travel nurses were contracted to support staffing. The use of agency nurses was 11% that quarter. In addition, 2G staffing included four newly hired permanent RNs in orientation and two newly graduated RN hires … Staffing turbulence may have contributed to high pressure ulcer prevalence coupled with inconsistent knowledge and application of evidence-based practice for pressure ulcer prevention. (Washington Hospital Center)
For outcomes such as falls and pressure ulcers, nursing care process indicators may reveal more about the problem. Figure 3 illustrates how data from NDNQI reports can help teams drill down on risk assessment and prevention interventions. On this unit, 16% of patients were not assessed for fall risk. Although 95% of the patients at risk had a prevention protocol in place, the unit’s high fall rate suggests the protocol may need to be improved. The team should explore:
Stay updated, free articles. Join our Telegram channel

Full access? Get Clinical Tree


