Parametric and non-parametric statistical tests
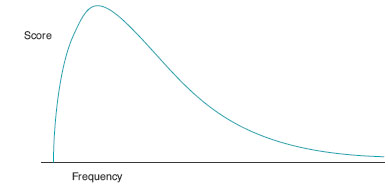
Parametric tests make a number of assumptions about the data for which they are used (the parameters to which the data should conform). The first of these is that the level of the data is interval or ratio. This is because parametric tests treat the numbers as if the intervals between them were equal, rather than simply ranks or categories. The second parameter to which the data should conform is that it should be normally distributed. This is because comparisons between the two groups are based on the premise that there should be a certain amount of separation between the distribution curves of the two groups for us to have confidence that they really represent two different populations, rather than subsets of a single one. This assertion is harder to justify using parametric tests if the data are not normally distributed (see Figure 20.2). Finally, the data must possess homogeneity of variance – in other words, the variance within the groups being analysed must be roughly similar. If we know the data are normally distributed and the variances are similar, then the only characteristic of the samples which can give rise to a difference is the means of those samples – the thing we are generally comparing in parametric tests.
Having said all this, it should be noted that some researchers and statisticians deny the distinction we have just made between parametric and non-parametric tests. They argue that the important difference is between continuous data and categorical data, and that this distinction should guide our choice of statistical tests. Non-statisticians, however, are probably best sticking with the conservative rationale for test selection we have given here.
Inferential statistics
Statistical significance
In speaking of statistical significance, we are asserting that a particular event or response would be unlikely to have occurred by chance. If it did not occur by chance, we assume that it was caused by some effect of the independent variable on the dependent variable, or some interaction between two or more variables. The criterion set in science for statistical significance is <5% (probability of p < 0.05). Both these statements say that the event or response would not have occurred by chance as frequently as one time in 20. This is a purely arbitrary convention, and circumstances might occur in which we would wish to set this criterion higher. Given the durability of the convention, however, our reasons for changing the criterion would have to be very strong indeed.
This means that every time we get a statistically significant result at the 5% level, we would have arrived at such a result one time in 20 by chance (called a type I error). Conversely, every time we get a nonsignificant result at the 5% level we have missed, by chance, a result that actually did not occur by chance (called a type II error). Moreover, if we run several tests on a dataset, we increase the chance that we will make a type I error. If we run two tests, it is two in 20, if few run three tests, it is three in 20 and so on. The best rule for avoiding type I error is to have a strong rationale for each test you run, and do not run any others. In other words, no fishing trips in the data. The best rule for avoiding a type II error is to increase sample size, because risk of type II error is related to sample size. Small studies are underpowered (see Chapter 14).
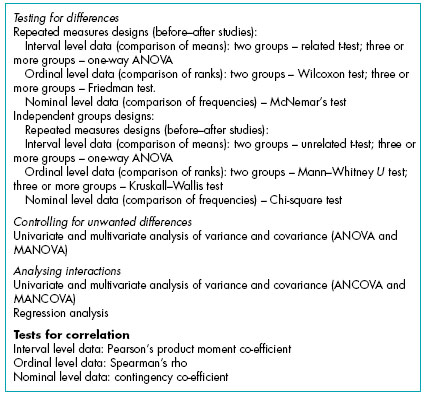
Designs and statistics
Different research designs require different statistical approaches. This is because different designs result in different sources of variation in the data, which are dealt with in different ways by different statistical tests. For example, in a repeated measures design, we know that the repeated responses of participants are likely to be correlated. The statistical test used has to be able to account for this naturally occurring correlation when allowing us to consider whether differences observed are statistically significant.
Stay updated, free articles. Join our Telegram channel

Full access? Get Clinical Tree


