CHAPTER 2 The health of Australians
When you finish this chapter you should be able to:
Introduction
During the outbreak of another epidemic in 1854 he decided to record on a map the incidence of each cholera case in central London and noticed as he did so that most were congregated around certain street pumps. In those days there was no running water in the houses and water had to be collected by pail from the nearest street pump. Dr Snow’s map indicated that some street pumps had no surrounding incidences of cholera while others had a very high incidence. When Snow matched the two water companies that provided water to London’s city pumps he found that one (the one with many cholera cases adjacent to their pumps — amounting to up to 200 deaths per day) was collecting water from the Thames River below the sewerage outlet, while the other (which had no cholera cases adjacent to their pumps) was collecting water from high up the river, above the sewerage outlet. He then marched the city fathers down to one of the contaminated pumps and removed the handle, forcing local residents to use safer pumps. The number of cholera cases in that area dropped immediately, thus proving his theory that cholera was a contagious disease transmitted through body fluids from person to person, and in this case via the medium of water.
Australia’s health: life expectancy and health expenditure
Over the past 100 years we have gained an extra 25 years of life expectancy. Currently Australia has one of the highest life expectancies worldwide at 77.6 years for males and 83.5 for females (Japan has the highest with 78 and 85 respectively). By 2050 in Australia these figures will rise to 90 years for females and 86 for males (Commonwealth Department of the Treasury 2007). Overall our health expenditure appears well managed at around 9–10% of the Gross Domestic Product (GDP) — this is very comparable with other OECD countries. The total expenditure on health in 2004–05 was $87.3 billion, or 9.8% of GDP, with an average of $3369 per non-indigenous person and $3974 per Indigenous person (Australian Institute of Health and Welfare [AIHW] 2006b). Hospital services took up 33.3% of these costs, while the rest was spent on medication (12.4%), dental services (5.8%), other health practitioner services, for example, physiotherapy and chiropractic (2.8%), health promotion (1.7%), aids and appliances, and research.
Epidemiology of disease in Australia
Non-communicable diseases
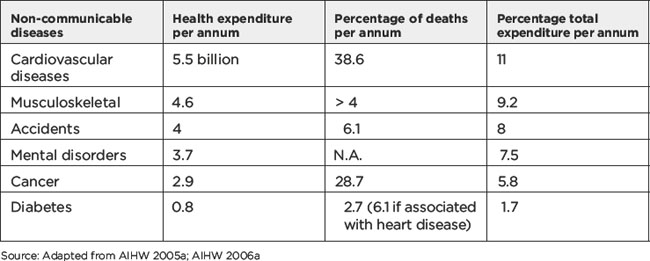
From Table 2.1 it is interesting to note that health expenditure is not necessarily tied to rates of death. For example, cancer has the second highest rate of death at 28.7% but the amount of money spent on it is lower than on musculoskeletal diseases with a death rate only around 4%. This is because cancer tends to be a much shorter-term illness and therefore claims less in terms of hospital and other medical costs than longer-term diseases.
Cancer
For both males and females the incidence of cancer is also on the decline. In 2004, 28% of deaths were caused by cancer, in particular of the lung, prostate, breast, colorectal area and lymph glands. Hospital separations have decreased from 9% to 7% (ABS 2006a) and health expenditure on cancer is around $2.9 billion (AIHW 2005a) but this does not reflect the lifetime cost (from diagnosis to death) for all those diagnosed. In 2005 this cost was estimated at around $94.6 billion (Access Economics 2007). Australians are four times more likely to develop a common skin cancer than any other form of cancer, with over 380 000 Australians being treated for skin cancer each year — that is over 1000 people every day with over 1500 Australians dying from skin cancer each year (AIHW 2004a). Skin cancer costs the health system around $300 million annually, the highest cost of all cancers (AIHW 2005a).
Stay updated, free articles. Join our Telegram channel

Full access? Get Clinical Tree


