- encourage exercise, achieve healthy weight and stop smoking;
- if appropriate, discuss the risks and benefits of protein reduction;
- ensure malnutrition is prevented;
- offer dietary advice to people with progressive CKD regarding potassium, phosphate, protein, calories and salt when indicated.
The Renal Association concur with all of these points and they have produced specific clinical guidelines (5th edition, 2009–2012), which cover the key elements of care, many of which also have nutritional implications. A more detailed discussion of the nutritional implications follows and includes:
- Detection, monitoring and care of patients with CKD includes management of hypertension, diabetes and cardiovascular risk factors. It also discusses management of hyperphosphataemia and hyperkalaemia (MacGregor and Taal 2011).
- Cardiovascular disease in CKD (Holt and Goldsmith 2010).
- CKD mineral and Bone Disorders (Steddon and Sharples 2010).
- Anaemia in CKD (Mikhail, Shrivastava and Richardson 2010).
- Nutrition in CKD; focus is on malnutrition (Wright and Jones 2010).
In Stages 1–3 CKD, the dietetic treatment of hypertension, cardiovascular risk (obesity, hyperlipidaemia) and diabetes control takes precedence. From stage 3 (usually 3b) to stage 5, the problems of preventing and controlling renal bone disease, hyperkalaemia, anaemia and malnutrition come to the fore.
Hypertension
Sodium (Na) and fluid retention occur in most types of renal disease and contribute to high blood pressure. The National Institute for Health and Clinical Excellence (2008) guideline and the ‘Kidney Disease Improving Global Outcomes’ (KDIGO) guidelines recommend that, to improve blood pressure control, patients should be advised to reduce dietary salt and alcohol intake, stop smoking and take regular exercise.
A moderate salt-reduced diet (about 80–120 mmol Na) will facilitate the action of antihypertensive medication such as diuretics and the commonly used angiotensin converting enzyme (ACE) inhibitors. The Renal Association guidelines and also the current government Food Standards Agency (FSA) guidelines for the general population recommend a maximum salt intake of 6 g/day or 100 mmol sodium. However KDIGO recommend a sodium intake of 90 mmol, which is equivalent to a salt intake of 5 g/day. In practice this is not simple as many people rely on the purchase of processed foods (see Appendix 13.2). About 80% of our salt intake is hidden in processed foods, including staple food items such as bread and breakfast cereals. Patients should be advised as follows:
- Prepare meals using fresh ingredients.
- Use spices and herbs to add flavour to food.
- Only use a little salt in meal preparation.
- Avoid adding salt to food after preparation.
- Avoid excessive amounts of salty foods such as cured and processed foods: this includes takeaway meals.
- Avoid using salt substitutes containing potassium salts such as potassium chloride (KCl): see ‘Hyperkalaemia’ section.
- Avoid meals prepared with monosodium glutamate. This is added to enhance the taste of food in restaurants, take-away outlets and ready-to-eat meals sold in supermarkets.
- Read food labels and check for additives like monosodium glutamate and salt substitutes. Note that 1 mmol Na = 23 mg Na; 2 g (2000 mg) Na = 5 g NaCl = 90 mmol Na
A small proportion of patients are ‘salt losers’ (due to a specific renal pathology) and need to add salt to their meals and/or use salt supplements such as slow sodium.
The KDIGO guidelines for the management of blood pressure in renal disease also recommend the following:
- Maintaining a healthy body weight (BMI 20 – 25 kg m–2).
- Undertaking exercise; compatible with cardiovascular health and tolerance. Aiming for 30 minutes, 5 times a week.
- Alcohol intake should be no more than 2 units per day for men and 1 unit per day for women.
Cardiovascular Risk and Hyperlipidaemia
The National Institute for Health and Clinical Excellence (2008) guidelines and the Renal Association guidelines recommend using the Joint British Societies (2005) guidelines to define cardiovascular risk; this risk assessor includes the traditional risk factors of age, gender, lipid levels and blood pressure. In patients with renal disease, other risk factors include calcium and phosphorus imbalance, hyperhomocysteinaemia, inflammation and possibly anaemia.
Recommendations from the K/DOQI (2003) guidelines were that CKD was a high risk factor for CVD and that ‘major findings from randomised trials in the general population are applicable to patients with CKD, until proven otherwise’. More recent intervention trials in the renal population have now supported this statement and blood pressure and lipid levels should be well controlled using a combination of lifestyle changes and medication; including ACE inhibitors for blood pressure and statins for cholesterol. Lifestyle changes include; weight loss where necessary to achieve a healthier BMI, lower salt intake, stopping smoking, avoiding excess alcohol and taking regular exercise.
Recommended lipid and HbA1c levels are; LDL < 2 mmol/l or a 30% reduction from baseline, total cholesterol < 4 mmol/l or a 25% reduction from baseline, triglycerides < 1.7 mmol/l, HbA1c between 6.5% and 7.5% (48-58 mmol/cmol). Due to the association with hyperhomocysteinaemia, folate and B12 levels should be monitored every six months in CKD stages 4/5 and ‘nutritionally at risk’ patients should be recommended to take nutritional supplements. As well as BMI, the National Renal Data Set requires that waist and hip circumference should be measured. An excess of body fat, particularly round the waist, is linked with metabolic disturbances including raised inflammatory cytokines and insulin resistance. In patients with CKD a raised waist: hip ratio has been associated with increased myocardial infarction and fatal coronary artery disease (Elsayed et al. 2008). Significant correlations have been shown between the presence of inflammation (measured by CRP, TNFa and fibrinogen) and carotid plaques in patients preparing for dialysis, who have simultaneously demonstrated signs of muscle/protein wasting (low serum creatinine, LBM and urea nitrogen appearance); the so-called malnutrition-inflammation-atherosclerosis (MIA) syndrome. It is unclear whether CRP is raised in response to endothelial cell damage or whether CRP and other acute phase reactants such as IL-6 are actually involved in the initiation and progression of atherosclerosis (Stenvinkel et al. 1999, Stenvinkel 2003).
More studies are still needed to elucidate the role of diet, exercise, and weight reduction in reducing the risk of CVD and MIA in patients with CKD.
Interventions in Patients with Diabetes
The results of the Diabetes Control and Complications Trial (DCCT) (type 1 diabetes) and the UK Prospective Diabetes Study (UKPDS) (1998) (type 2 diabetes) showed that the careful control of blood glucose and hypertension significantly decreases the renal complications of diabetes which often begin with the appearance of microalbuminuria (UK Prospective Diabetes Study 1998; Yale 2005). Observational studies indicate improved cardiovascular risk with good glycaemic control. The Renal Association guidelines recommend a target HbA1c of 6.5% to 7.5% (48–58 mmol/mol) stating the benefits mentioned above. Medication to control hyperglycaemia will need to be adjusted regularly as requirements diminish and renal function declines.
A Cochrane systematic review by Robertson, Waugh and Robertson (2007) concluded that reducing protein intake does seem to slow progression of diabetic nephropathy although in a nonsignificant way; that is, increasing time to dialysis by only two months. They noted that compliance with such a protein reduced diet was difficult to achieve and also added that factors worth considering included changing the type of protein: vegetable versus animal, fish/white meat versus red meat. This may be a more practical and achievable approach than restricting the amount of protein, however the trials evaluating the effectiveness only involved small numbers of patients. There was insufficient evidence to support the use of lower protein intakes to slow down progression of nephropathy in type 2 diabetes (CARI guidelines 2006). The Diabetes UK guidelines base their recommendations regarding protein reduction on the systematic review by Robertson et al. (2007) and suggest that a 6- month trial of reduced protein may be initiated and continued if there is a response.
With the rising levels of diabetes in the population there needs to be a concerted effort in primary care to maximise blood glucose and blood pressure control, in order to prevent nephrology services from being overwhelmed with patients who have diabetes.
Calcium, Phosphate and Vitamin D Metabolism
The first signs of impaired calcium (Ca) and phosphate (P) homeostasis arise early in renal impairment (CKD 2) as parathyroid hormone (PTH) levels start to rise. This is due to phosphate retention and impaired hydroxylation (activation) of vitamin D, which results in reduced absorption of Ca from food in the small intestine. The ensuing hypocalcaemia stimulates an increased release of parathyroid hormone, which, in an attempt to normalise plasma calcium levels, releases calcium and phosphate from the bone (eventually causing weakened bones). As renal disease progresses the release of calcium and phosphate from the bone and reduced excretion of phosphate in the urine leads to hyperphosphataemia.
Monitoring of calcium, phosphorus, PTH, calcidiol (25OH vitamin D) and alkaline phosphatase (ALP) is recommended from CKD stage 3b (progressive). Treatment can include the use of: calcium supplements, vitamin D (including activated forms, alfacalcidol and calcitriol), calcimimetics, dietary phosphate restriction and phosphate binders or transport blockers (Sexton and Vincent 2004).
Calcium supplements
The recommended daily Ca intake for predialysis patients is 1000 – 1500 mg. If this is not being reached (particularly if protein intake is low), calcium supplements may be needed but should be taken in between meals, preferably at bedtime to maximise Ca absorption.
‘Active’ vitamin D
Vitamin D is a fat-soluble vitamin and is obtained from a small number of foods but mostly from exposure to sunlight (this may be reduced in the elderly and certain ethnic groups). It needs to be converted to an active form by hydroxylation in the liver and kidney. The use of active forms of vitamin D, alfacalcidol and calcitriol, can be troublesome. On the one hand, they reduce PTH levels (which will reduce the negative effects on bone) but, simultaneously, calcium and phosphate absorption from the gut increases, which can lead to hypercalcaemia and hyperphosphataemia if not monitored closely. The precipitation of this excess calcium and phosphate in the soft tissues (blood vessels, coronary arteries and aortic valves), is considered to be one of the major causes of morbidity and mortality in adults, particularly young adults, with renal failure (Block et al. 1998; Goodman et al. 2000).
Steddon and Sharples (2010) recommend measuring calcidiol levels from stage 3b and supplementing if levels show insufficiency (< 75 mmol/l). As vitamin D has many metabolic roles, there is a strong rationale for ensuring adequate levels of this hormone, not simply to normalise bone metabolism (Cherniack et al. 2008; Armas and Heaney 2011).
Dietary phosphate reduction
The Renal Association has advised that ‘patients need dietary advice to reduce dietary phosphate.’ Although the optimal time to start a reduction in phosphate intake/commence phosphate binders has not been established, the K/DOQI guidelines recommend that:
Dietary phosphorus should be restricted to 800 to 1,000 mg/day (adjusted for dietary protein needs) when the serum phosphorus levels are elevated (1.49 mmol/l (>4.6 mg/dL)) at Stages 3 and 4 of CKD, and >1.78 mmol/l (5.5 mg/dL) in those with kidney failure (Stage 5).
UK guidelines suggest maintaining serum phosphate between 0.9 to 1.5 mmol/l and calcium should be within the normal reference range in Stages 3b to 5 CKD.
Calcium and phosphate are obtained from most foods with high protein content. Examples are milk and its products: cheese and yogurt. Phosphorus also appears in high-fibre cereal products and fish with edible bones, offal, pulses and nuts. Absorption from the gastrointestinal tract varies between 30–80%, and phosphorus from vegetable sources is less bioavailable.
Appendix 13.4 shows high-phosphorus foods, not all of which have alternatives with comparable nutrient content and therefore total elimination from the diet is not feasible. Hyperphosphataemia is difficult to control by dietary manipulation alone and needs to be combined with phosphate binders. A moderate protein reduction will also tend to reduce phosphate intake which is one of the arguments in favour of a protein reduction in the predialysis population. However, the impact on other nutrients must always be considered. For example wholemeal products contain more phosphorus as well as more fibre, yet fibre also improves bowel habits and the general well-being of patients. Serum phosphate levels may rise (by 0.25 mmol/l) with a high-fibre diet (Pender 1989); however, the benefits of a high fibre intake outweigh the risk of hyperphosphataemia and if necessary, phosphate binding agents can be increased.
Phosphate binders
Phosphate binding occurs in the stomach and small intestine and reduces the absorption of phosphate into the body. If calcium and aluminium salts are used as oral binders, these initially dissolve in the acid environment of the stomach and then form an insoluble precipitate with phosphate. This product is eliminated via the gastrointestinal route (not the kidneys). However a high gastric pH (i.e. less acidic), found generally in the elderly and particularly in people taking H2-receptor antagonists such as ranitidine, can reduce the effectiveness of the binders and hyperphosphataemia can result (Tan et al. 1996).
Phosphate binders should be taken with food, particularly main meals and snacks containing phosphate, and with milk-based nutritional supplements. Ideally, the dose of the binder should be altered to reflect the phosphate content in a particular meal.
Both the calcium and aluminium in the binder are absorbed to some extent and this has given rise to worries about aluminium toxicity and calcium overload. More recently developed phosphate binders such as sevelamer hydrochloride (Renagel) and lanthanum carbonate do not contain calcium or aluminium and sevelamer has an added benefit in that it also binds cholesterol. The vitamin niacin is also being used to block phosphate absorption as well as increase HDL cholesterol. Calcimimetic agents are recommended for use in patients with hyperparathyroidism and control of calcium and phosphate in Stage 5 CKD (Steddon and Sharples 2010).
The timing and dose of the binders is crucial for good phosphate control and support from the MDT can help improve compliance and biochemistry results (Evans and Gardiner 2008).
Hyperkalaemia
Plasma potassium levels are tightly controlled in the body and, in order to maintain normal levels, 90% of potassium is usually excreted by the kidney with the remainder excreted via the gastrointestinal route. Progressive renal failure is often complicated by hyperkalaemia, (plasma potassium > 5.5 mmol/l) and may occur when renal function has declined to a GFR of 5 ml/min despite normal urine output. Hyperkalaemia can also occur at an earlier stage when patients receive ACE inhibitors or angiotensin II receptor binders (ARBs) for blood pressure control. This can be exacerbated if combined with a high intake of potassium rich foods and is potentially life threatening, particularly as it is not associated with physical warning signs and requires immediate treatment. Dietary and nondietary causes of hyperkalaemia should be investigated at the same time.
Examples of nondietary causes are:
- metabolic acidosis;
- increased catabolism (and conditions which cause cell destruction: rhabdomyolysis, gastrointestinal bleed);
- endocrine abnormalities;
- drugs such as potassium supplements (i.e. slow K), some laxatives, potassium sparing diuretics, ACE inhibitors, ARBs and nonsteroidal anti-inflammatory drugs;
- constipation (and drugs that exacerbate constipation, for example iron tablets).
Dietary management
Dietary sources of potassium are listed in Appendix 13.5. A dietary intake of no more than 60–70 mmol/d (1 mmol/kg IBW) is sufficient to prevent or treat hyperkalaemia in the presence of an adequate urine output or dialysis treatment. However, serum K levels, in patients who are not on dialysis and not passing much urine, taking a 50 mmol potassium diet, can rise by 1 mmol/d despite gastrointestinal adaptation to increase potassium excretion.
Most foods contain potassium, but vegetables and fruits are major sources: some varieties contain more than others. Staple foods such as potatoes, yam, sweet potatoes, green bananas and plantain are high in potassium, but should be included in a potassium-reduced diet. Potassium-containing salts such as dipotassium phosphate, are used as food additives but in small quantities. Of greater concern is the use of potassium chloride as a substitute for sodium chloride as part of the food manufacturers’ attempt to reduce the sodium content of food.
Patients should receive dietary advice regarding the potassium content of specific foods, avoiding or at least limiting the quantities eaten of those that are high. Cooking techniques such as boiling (and throwing away the water) will remove some of the potassium in vegetables. On the other hand cooking methods which retain potassium include cooking in a pressure cooker or microwave, stir-frying, roasting and casseroling vegetables.
Potassium and high-fibre foods
Constipation is a common problem for patients on peritoneal dialysis (PD), older and sedentary patients. High-fibre cereal products are recommended to prevent constipation and can have a beneficial effect on hyperlipidaemia. Some high-fibre foods are high in potassium (Pagenkemper et al. 1994), although earlier studies have showed that the overall effect of a high fibre diet on serum potassium was not significant – increasing serum potassium levels by about 0.3 mmol/l (McKenzie and Henderson 1986).
Potassium exchange resins
Potassium binders such as calcium or sodium ion-exchange resin (i.e. calcium or sodium resonium) may be used to control hyperkalaemia. Calcium resonium is a gritty textured powder and is best taken with a sweet drink to mask its taste. Calcium ions (or sodium) are exchanged for potassium ions in the gut and the potassium is then eliminated. The long-term use of calcium resonium can lead to severe constipation (unless appropriate laxatives are prescribed) and is therefore not used for routine control of plasma potassium levels.
Anaemia
Anaemia due to renal impairment can be diagnosed when GFR < 60 ml/min i.e. CKD stage 3a, although it is more prevalent in stage 4 CKD (Mikhail et al. 2010). It can impact on general nutritional status by causing general lethargy, taste changes and a poor appetite, hence it is always worth checking the patient’s haemoglobin and ferritin levels if they present with these symptoms. Anaemia is also involved in the pathogenesis of left ventricular hypertrophy (LVH) and therefore increases the risk of CVD. A serum ferritin of < 100 ng/ml or a transferrin saturation of < 20% indicates relative iron deficiency. It is important to ensure an adequate intake of iron, B12 and folate. Vitamins B6 and C also have important roles in erythropoiesis. The consumption of foods which are high in iron, such as red meat, offal and pulses may be reduced in a renal diet, particularly if protein- or phosphate-restricted diets have been prescribed. A potassium lowering diet may result in decreased iron, folate and vitamin C intakes.
If oral iron (Fe) supplements are used, 200–300 mg Fe/day is required to restore iron status. These can cause side effects such as constipation and black stools. They can also interact with other medication such as the calcium-containing phosphate binders. In order to obtain a rapid improvement in iron status, intravenous preparations are more often used.
Malnutrition
Irrespective of whether a therapeutic diet is recommended to treat any of the other problems listed above, all patients at CKD stage 4–5 should receive a dietary assessment and be screened for malnutrition. This is because a spontaneous decrease in protein intake has been measured in patients with renal diseases as the disease progresses (Ikizler et al. 1995). A patient with poor nutritional status at the start of dialysis will have a poor outcome in terms of survival and therefore it is important to prevent malnutrition from occurring at the outset (Walters et al. 2002). Some expert nephrologists have recommended that if the patient’s protein intake has fallen below 0.8 g/kg/day, dialysis should be initiated (Hakim and Lazarus 1995).
Regular dietary follow-up in clinic or by telephone should help to maintain optimal nutritional status by ensuring that a balanced diet is being achieved – i.e. one that contains adequate macronutrients (protein, fat, carbohydrate) and micronutrients (vitamins and minerals). If specific dietary reductions are advocated, it is important that the impact of these reductions on the intake of other nutrients, as well as the social effects, are fully evaluated. The diet should provide sufficient dietary freedom and enable the patient to lead a near-normal life. This means that dietary flexibility must be incorporated and appropriate carers, relatives or friends should be involved while educating the patient to promote maximum dietary adherence.
Nutritional assessment
A full nutritional assessment includes collection of information from these five main categories:
- anthropometry: circumferences; MAC, MAMC, waist and hip. BIA, DEXA;
- biochemistry: Urea, creatinine, electrolytes, haemoglobin (Hb) and micronutrient screen;
- clinical;
- dietary intake;
- exercise : physical function: sit to stand, grip strength.
Renal Association (RA) guidelines recommend that patient with a GFR <20 ml/min who are not on dialysis, should have a nutritional assessment every 2–3 months.
Body composition changes
The Dialysis Outcome Quality Initiative (K/DOQI) (2003) guidelines have indicated the need for more information regarding ‘the appropriate parameters to be used for assessment of body composition‘. Nonetheless, simple ‘bedside’ measurements can indicate a decline in nutritional status as long as oedema and signs of fluid overload are identified. These include actual body weight (in comparison with ideal body weight), weight loss of 5% in 3 months, BMI < 20 kg m–2 (Wright and Jones 2010). These authors of the RA guideline ‘Nutrition in CKD’ also recommend use of the Subjective Global Assessment (SGA), where a grading of B/C on a three-point scale or a score of 1–5 on the 7-point scale indicate declining status.
Insufficient energy intake will lead to protein catabolism, which may present as muscle wasting. This can be detected using hand grip strength and other measures of physical function (sit to stand, shuttle test). Mid-arm muscle circumference (MAMC) can be estimated from measurements of mid-arm circumference (MAC) and triceps skinfold. Conditions that exacerbate protein/muscle loss include sarcopenia (muscle loss due to ageing), inflammation, acidosis and lack of activity/exercise. Blood biochemistry may indicate whether there is inflammation (raised CRP, low albumin, raised white cell count) or acidosis (low bicarbonate levels) and if present, appropriate treatment should commence. There is growing evidence that low vitamin D levels and raised PTH are determinants of sarcopenia (Visser et al. 2003) and Wright and Jones (2010) suggested that supplementation of ergocalciferol or cholecalciferol may be beneficial in undernourished CKD patients.
Where there is an energy deficit, fat stores will also be used to provide energy. This initially may not be a problem, particularly if the patient is obese and can therefore mobilise these excess stores. The advantages of not having excess body fat include a decreased risk of CVD, hypertension and diabetes. Formation of a fistula or insertion of a Tenckhoff catheter is also more difficult in patients who are overweight or obese. However, fat is used to insulate the body, to provide cushioning for bones, and to provide an energy source when food intake is poor. Recent evidence has shown that whereas being underweight increases mortality in patients on dialysis, being overweight may actually confer some advantage, at least in the first few years of dialysis (Friedman 2006). This is reflected in the K/DOQI guidelines (2003) that have stated that a BMI of up to 28 kg m–2 is acceptable. The UK Renal Association guidelines recommend that patients with a BMI >30 kg m–2 should receive advice to assist weight loss (MacGregor and Taal 2011).
Nutritional requirements
Protein
Protein is an important nutrient for the repair and maintenance of tissue and for growth.
Quantity
The level of dietary protein intake should maintain nitrogen balance (in a well nourished adult) or be sufficient for growth (in children) and repair (in patients recovering from malnutrition or illness). For instance, if a patient consumes a high protein diet (> 1.2 g/kg IBW), a reduction to 1.0 g/kg IBW may initially be sufficient which can be reduced to 0.8 g/kg IBW if renal function deteriorates at a later stage. This is an acceptable protein allowance for long-term use and it meets the maintenance requirement of 0.66 g/kg advised by WHO/FAO (Millward and Jackson 2003). The Renal Association guideline Nutrition in CKD (Wright and Jones 2010) recommended that a protein intake of no less than 0.75 g/kg is realistic and required an energy intake of 35 kcal/kg/day to prevent malnutrition.
Quality
The quality of protein is affected by its digestibility and amino-acid content. Meat, fish, eggs, milk and soy protein are usually referred to as containing high biological value (HBV) protein because of the levels of essential amino acids when compared with a reference protein. Proteins from plant sources (cereals, vegetables, pulses and nuts) may be limited in lysine, threonine, methionine and cysteine and have poorer digestibility. Despite this, the amino acid content of a UK vegetarian diet is comparable with UK omnivores. Rice-based vegetarian diets have poorer amino acid content (compared with wheat-based diets) as well as lower digestibility. In order to ensure that a reduced-protein diet contains adequate levels of all the amino acids, it is particularly important for vegetarians to have proteins from a variety of sources including cereals, pulses and legumes (Millward and Jackson 2003).
Energy
Protein, fat, carbohydrate and alcohol all contribute to a person’s energy intake.
Quantity
Example: to calculate energy requirements for a 70 kg person (IBW):
70 × 30–35 kcal (126–150 kJ) = 2100–2450 kcal (8.8–10.3 MJ)
The range of energy requirements, 30–35 kcal/kg, is similar to the result obtained using the Schofield equations for basal metabolic rate and assumes a physical activity level of 1.3–1.4, which is low (Todorovic and Micklewright 2007). Patients with increased metabolism due to infection, injury or increased activity levels should have their requirements calculated using equations such as Schofield or Oxford with appropriate factors added for metabolic stress and activity levels.
Quality
The quality of foods providing energy is as important as the quantity. Cardiovascular disease and some cancers are associated with a high proportion of saturated fat in the diet. Hypertriglyceridaemia (common in patients with renal disease) is associated with high intakes of rapidly absorbable carbohydrates and alcohol. If a protein reduction has been advised, there has to be an increase in calories to make up the deficit. This could take the form of mono-unsaturated fat (olive oil) and carbohydrates with a medium to low glycaemic index (pasta, basmati rice, new boiled potatoes, some fruits).
Micronutrients: vitamins and minerals
Vitamins and minerals regulate metabolic pathways and some of the most observable clinical features of uraemia (anaemia and renal bone disease) are caused, or at least exacerbated, by vitamin and mineral deficiencies. Metabolism of protein, carbohydrate and fat will be affected by deficiencies of vitamins and minerals. These can arise because uraemia alters their serum levels and body stores and also interferes with their function. Drug interactions can affect the absorption and utilisation of minerals (such as calcium, iron, zinc and magnesium) and vitamins (such as B6, folate and B12). Requirements for these three vitamins may be higher in renal disease in order to treat hyperhomocysteinaemia, which is a risk factor for CVD (Hong et al. 1998). Dietary reductions that limit protein, phosphate and potassium intake will inevitably limit the intake of various micronutrients. A low-protein diet can contain low levels of B vitamins (B1, B2, B6, B12), iron, calcium and zinc (Hadfield 1992). A low-potassium diet will limit intake of folic acid, vitamins C and E, as well as phytochemicals such as fructo-oligosaccharides, phytosterols and polyphenols. A review by Steiber and Kopple (2011) found that vitamin deficiencies (particularly B1 and B6) in CKD stages 3–5 were common, with intake of other B vitamins decreasing with lower protein intake as described above.
However, there may be reduced renal losses of some nutrients. Vitamin supplements containing the fat-soluble vitamins A, D, and E are contraindicated in patients with renal disease. Vitamin A metabolites are less well excreted and accumulate over time; toxicity has been reported in patients receiving total parenteral nutrition containing a high dose of vitamin A (Muth 1991). High-dose vitamin E supplementation may potentially disrupt the clotting mechanisms. Rocco and Makoff (1997) stated that vitamin K supplementation is also contraindicated unless a patient is on chronic antibiotic treatment. However a more recent literature review cited articles that found evidence of deficiency in 60–97% of patients with CKD 3–5 and recommended ensuring that people at least meet the recommended nutrient intake which, in the United Kingdom, is 1μg/kg/day (Steiber and Kopple 2011). It is recommended that vitamin and mineral status should be included in the nutritional assessment.
Prevention and treatment of malnutrition should be started during the predialysis phase. Many renal departments hold multidisciplinary education sessions for patients to provide information on treatment options, diet and support from social services. Ideally a specialist renal nurse, dietitian, social worker and consultant should be involved in the sessions, with access to a counsellor if available. All patients should also receive individual dietary advice, and frequent monitoring is essential to accommodate any changes in renal function.
Nephrotic Syndrome
Nephrotic syndrome (NS) is characterised by proteinuria > 3 g/day, which results in hypoalbuminaemia and generalised oedema. Hyperlipidaemia, clotting problems and hypertension are also present. Loss of immunoglobulins and proteins that bind iron, copper, zinc and vitamins A and D can result in an increased risk of infections and general malnutrition. The syndrome can arise in diseases that primarily cause glomerular damage such as focal segmental glomerulosclerosis (FSGS), membranous nephropathy (MN), minimal change nephropathy (MCN) or secondary to other diseases including diabetic nephropathy and auto-immune disease such as systemic lupus erythematosus (SLE). Treatment aims to control oedema, reduce proteinuria, and treat complications which arise including infections, hyperlipidaemia and clotting problems (Hull and Goldsmith 2008, de Seigneux and Martin 2009). Diet therapy has a role to play in several of these areas (Table 13.2).
Table 13.2 Management of nephrotic syndrome.
| Symptom | Dietary management |
| Hypertension and oedema | Dietary sodium reduction: 80–100 mmol/day. Fluid reductions may also be necessary, depending on the response to medication. Target weight loss 0.5–1 kg/day ACE inhibitors commonly used (monitor potassium levels) |
| Proteinuria/hypoalbuminaemia | Moderate protein reduction: 0.8–1 g/kg IBW/day Good control of blood glucose in diabetes Medication can include steroids to treat the primary disease. ACE inhibitors also help to reduce proteinuria (monitor potassium levels) |
| Hyperlipidaemia | Standard lipid lowering advice; 30% calories from fat. Statins and bile acid sequestrants |
| Lower immunity | A balanced, nutritious diet will help prevent protein-energy malnutrition (PEM) and maintain micronutrient levels: monitor for signs of vitamin D deficiency and anaemia |
Protein reduction
Historically, in nephrotic syndrome, a high-protein diet was advised with the aim of replacing protein losses. This is now thought to cause further damage to the glomerular basement membrane and exacerbate the proteinuria. An intake of 0.8–1 g protein/kg IBW/day is now recommended. This can result in reduced proteinuria, and improvements in other biochemical parameters such as, phosphate, lipid, renin and fibrinogen levels (thrombo-embolism is increased in NS: 10–30% of adult patients with NS may develop clotting problems). Not all studies have showed a corresponding increase in plasma albumin levels.
Hyperlipidaemia
The incidence of myocardial infarction has been reported as 5–6 times greater in NS compared with normal. Increased liver synthesis of lipoproteins and impaired metabolism of triglycerides results in raised triglycerides and cholesterol. Standard lipid lowering advice can be given as well as the use of lipid lowering agents such as 5-hydroxy-methyl-glutaryl-coenzme A (HMG-CoA) reductase inhibitors (statins) and bile acid sequesters.
Dietary Management: Dialysis Treatments
Historical review
Since the early 1990s, considerable progress has been made regarding modes and quality of treatment. Regular haemodialysis (HD) became available from the mid-1960s onwards when patients were initially selected for treatment, so were usually young and free from concomitant disease. Dietary management was aimed at controlling the patient’s fluid balance and biochemistry. During these early days of dialysis a strict diet (by present standards) was followed by many patients, which consisted of a daily intake of: 50 g protein, 50 mmol sodium, 50 mmol potassium, 3500 kcal and 300 ml fluid.
As the quality of dialysis treatment improved during the 1970s and 1980s, dietary reductions were relaxed to a daily intake of 60 g protein, 60 mmol sodium, 60 mmol potassium, 2500–3000 kcal and 300–500 ml fluid. Even this slightly more generous HD diet was nutritionally incomplete without the use of high-energy, low-electrolyte supplements and several books were published during the following years to promote dietary education (Vennegoor 1992).
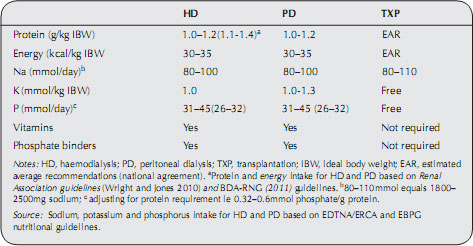
During the early 1980s CAPD became established as a new chronic dialysis technique, although it had been used since the 1960s for patients who were haemodynamically too unstable for HD. By the mid-1980s, the diet for both HD and PD was similar to that prescribed today: 1–1.2 g protein/kg IBW/day for HD and 1.2–1.5 g protein/kg IBW/day for PD (Vennegoor 1992).
Current concepts of dialysis dietary management
Specific dietary requirements will need adjusting when the mode of therapy (HD, PD or transplantation) commences or changes. Current recommendations for dietary requirements are shown in Table 13.3.
Table 13.3 Dietary recommendations for patients on renal replacement therapy.
Protein
During haemodialysis approximately 6–12 g of amino acids are lost per session. For peritoneal dialysis, 8–12 g protein, in addition to 3 g amino acids, are lost per day. On the basis of these figures alone the additional dietary protein required to replace these losses can be calculated as 0.1g/kg/day for patients on haemodialysis and 0.2g/kg/day for patients on PD. Some authors have argued that, as the minimum safe protein intake for healthy individuals (and in the predialysis phase) is approximately 0.75 g/kg/day as discussed above, the recommended minimum intake on dialysis should be as follows: 0.9 g/kg/day for HD and 1 g/kg/day for PD (Lim and Flanigan 2001). These are slightly lower levels than that recorded in Table 13.2 and, for some patients who are metabolically stable (i.e. not catabolic) nitrogen balance studies have shown that intakes at this level can be sufficient. As with any patient, in order to ensure that they are not becoming malnourished, it is important to measure nutritional status using a number of different methods such as those used in subjective global assessment (SGA) (McCann 1996). See Appendix 13.2.
Energy requirements
An intake of 35 kcal/kg IBW is recommended to maintain nitrogen (protein) balance in patients on HD and PD. For sedentary and older patients, 30–35 kcal/kg IBW is sufficient. Underweight patients may need additional calories (and supporting micronutrients) to encourage weight gain, while overweight patients may need a calorie adjustment to encourage weight loss if appropriate (Todorovic and Micklewright 2007; Wright and Jones 2010).
Dextrose (glucose) is used as an osmotic agent in peritoneal dialysis for the removal of fluid. Up to 70% of this glucose is absorbed through the peritoneum and this can exacerbate hyperglycaemia, hyperlipidaemia and obesity. The amount of glucose absorbed increases as the osmotic strength of the dialysate increases. When calculating energy requirements for patients on PD, the glucose (and hence calories) absorbed from the dialysate needs to be included in the calculation. Glucose absorption may provide approximately 70 kcal for a 2 L 1.36% exchange, 130 kcal for a 2 L 2.5% exchange and 200 kcal for a 2 L 3.86% exchange. Daily intake from this source could be between 100–300 g glucose (400–1200 kcal), depending on the strength and size of the exchanges used. Recent PD guidelines discourage the use of the higher glucose solutions and suggest the use of glucose polymers or amino acid containing solutions (Woodrow and Davies 2010). Icodextrin is a PD solution which contains glucose polymers with a larger molecular weight than glucose and is an effective osmotic agent. The calorie uptake is only half that of a comparable 3.86% exchange while achieving the same level of ultrafiltration. Some improvements in glycaemic control have been measured in patients who have diabetes, using one icodextrin exchange per day. See Chapter 9.
Sodium and fluid
Once a patient becomes oliguric and eventually anuric, the intake of salt and fluid will need to be reduced to control interdialytic weight gain (IDWG) with HD and fluid balance with PD. Excessive IDWG in patients on HD contributes to hypertension prior to HD treatments, necessitating antihypertensive medication (Ifudu et al. 1997). Longstanding fluid overload also results in left-ventricular cardiac hypertrophy (Konings et al. 2002).
A reduced fluid allowance is probably the most difficult part of the dialysis diet to cope with. Up to 86% of patients may exceed an IDWG guideline of 1.5 kg per day and there appears to be no difference between those who have diabetes and those who do not (Halverson et al. 1993). Some groups of patients with different ethnic backgrounds appear to have additional problems with IDWG. Indo–Asian patients in particular may often be unable to adhere to their fluid allowances and this is attributed to a higher fluid and salt content of traditional foods and meals (de Brito Ashurst et al. 2011).
Most renal centres in the United Kingdom regard an IDWG ranging from 1.5 to 2.0 kg as acceptable. Considering the differences in size of patients, it may be more appropriate to base IDWG on dry weight using 4–4.5% as an acceptable IDWG (EBPG 2007). However, an upper limit is recommended for patients with BMI > 25 kg m–2.
Sodium intake: the mechanism of thirst
It is important to remember what causes thirst. The sodium level in the body is finely tuned in healthy individuals as well as those with kidney disease. Too much dietary salt will cause the plasma sodium level to rise (transiently) and the thirst mechanism in the brain to act. It is then necessary to drink sufficient fluid to normalise the sodium level.
A sodium intake of 80–110 mmol/day can help control thirst. This can be achieved by following the advice listed in the earlier section on hypertension.
Excessive IDWG may not always be due to poor understanding of dietary advice. Even ‘solid’ food contains some fluid and patients with a good appetite will have higher IDWG; this can be established with a detailed dietary assessment, indicating a high protein and energy intake (Sherman et al. 1995).
Fluid includes anything liquid at room temperature (apart from vegetable oils) and includes jelly, ice-cream, ice cubes, gravy, soups, sauces and custard. A daily fluid allowance of 500–750 ml in addition to the average daily urine output is usually sufficient to prevent excess IDWG in patients on HD. Patients on PD can usually increase their intake to at least 750 ml plus average daily urine output. This amount may be modified depending on the level of ultrafiltration which is achieved with the lower strength exchanges of PD fluid. The following additional tips can help the patient keep to their fluid allowance:
- Measure the daily fluid allowance in a water jug: take out the equivalent amount after having a drink or if food with a significant amount of fluid is eaten.
- Divide the fluid allowance throughout the day.
- Use a small cup or glass instead of a mug or large glass.
- Drink only half a cup each time if possible.
- Ice cubes may be more thirst quenching, but each cube contains 30 ml fluid (2 tablespoons): lemon juice or other flavourings can be added.
- Rinse the mouth with water; gargle but do not swallow.
- Stimulate saliva production by sucking a piece of lemon or grapefruit, sherbets or chewing gum.
- Try artificial saliva sprays.
- Take medicines with meals unless contraindicated.
- When going out, save the allowance of fluid to allow for an extra drink when socialising.
- A daily weight check in the morning before breakfast will reveal the rate of fluid accumulation in between HD treatments and the fluid status on PD.
Potassium
Some patients starting dialysis continue to produce fairly good quantities of urine. This helps to some extent with the excretion of sodium, potassium and, of course, fluid. However the urine is often described as ‘poor quality’ in that the level of these solutes are lower than usual and plasma potassium levels should be monitored closely. The risk of hyperkalaemia is greater in patients who do not pass urine. The dietary intake of potassium should be reduced to 1 mmol/kg/IBW/day for patients on HD. Hyperkalaemia can be a frequent problem, especially on HD, and dietary indiscretion is sometimes partly to blame, although the amount of potassium removed during dialysis can vary by as much as 70%. Patients on PD, may have a more relaxed dietary potassium reduction, as potassium is constantly removed with PD and hypokalaemia has even been observed.
A detailed diet history should be taken for all patients so that the main sources of potassium in the patient’s diet are known and the level of reduction and dietary advice given is based on a risk assessment of their usual dietary intake, urine output and plasma potassium levels. Other reasons for hyperkalaemia should be investigated simultaneously as previously described. Some patients on haemodialysis consume foods with high potassium content during the first couple of hours on dialysis. However the transit of food and fluid through the gastrointestinal tract may be slower while the patient is dialysing and so it is advisable to put a limit on this consumption as the potassium may not be completely removed.
Phosphorus
The recommended intake varies from 1000 to 1400 mg (31–45 mmol/day), or approximately 0.5 to 0.6 mmol phosphorus per gram of protein up to 45 mmol/day. However, the more recent guidelines (EBPG 2007) are stricter than the previous nutritional guidelines as they suggest a maximum of 0.4 mmol phosphorus per gram of protein/day. It is recognised that with higher protein recommendations the phosphorus intake also increases and there has to be a balance between reductions which prevent hyperphosphataemia and preserving an adequate and acceptable diet for the patient to follow. Close collaboration of the multidisciplinary team is required to prevent hyperphosphataemia. A combination of adequate dialysis prescription and attainment, binders which are acceptable to the patient and taken at the right dose at the right time and clear dietary messages have been shown to improve phosphate biochemistry (Yokum et al. 2008, Gonzalez-Parra et al. 2012).
Vitamins and minerals
During dialysis the small molecules, such as water-soluble vitamins are removed; losses are even higher with high flux HD. The fat-soluble vitamin A is a larger molecule and vitamin A metabolites are therefore more difficult to remove and could lead to toxicity. However, with a functioning kidney there are also vitamin losses and so the question is whether dialysis removes greater amounts of vitamins than would normally occur. Evidence of vitamins at risk includes thiamin (B1) in PD patients, pyridoxine (B6) and ascorbic acid (vitamin C) in PD and HD, and folate in HD. To reduce cardiovascular risk the Renal Association guidelines recommend monitoring folate and B12 every 3 months if patients remain anaemic. Ascorbic acid is easily dialysed in both HD and PD. In an early study some patients, not receiving nutritional supplements, had vitamin levels fall below the normal range (Henderson 1984; Ramirez et al. 1986). A high-dose vitamin C supplement should be avoided to prevent hyperoxalosis: 60 mg may be sufficient with a normal dietary vitamin C intake, while a supplement of 500 mg vitamin C may increase serum oxalate levels. Oxalate deposits as crystals in soft tissues such as muscle tissue and vital organs, and may increase the risk of myocardial infarction, muscle weakness and bone disease.
The results of the Dialysis Outcomes and Practice Patterns Study (DOPPS) showed that water-soluble vitamin supplementation is associated with a 15% decrease in mortality (Fissell et al. 2004). At the time of the study only 3.4% of patients from the UK renal units were receiving water-soluble vitamins compared with 72% in the US. This has had an impact on the UK guidelines, which now recommend water-soluble vitamins for those undergoing haemodialysis (Wright and Jones 2010) and there seems to be a greater awareness and use of water-soluble vitamins on UK renal units (Hunt 2011). Table 13.4 lists the suggested daily recommendations in the United States (Makoff 1999) and Europe (EBPG 2007). The European guidelines are more conservative apart from the recommendations for vitamin C and vitamin E.
Table 13.4 Suggested daily dosage of vitamins for patients with ERF (EBPG and (US) guidelines).
| Vitamins | EBPG | RNI (UK) |
| Vitamin A | 0 | 600–700 μg |
| Vitamin E | 400–800 (0) iu | no DRV given |
| Vitamin B1 | 1.1–1.2 (1.5) mg | 0.8–1 mg |
| Vitamin B2 | 1.1–1.3 (1.7) mg | 1.1–1.3 mg |
| Vitamin B6 | 10 (10) mg | 1.2–1.4 mg |
| Vitamin B12 | 2.4 (6) μg | 1.5 μg |
| Folic acid | 1000 (800–1000) μg | 200 μg |
| Pantothenic acid | 5 (10) mg | no DRV given |
| Niacin | 14–16 (20) mg | 13–17 mg |
| Biotin | 30 (300) μg | > 10 μg |
| Vitamin C | 75–90 (60) mg | 40 mg |
| Notes: RNI, recommended daily intake. Dietary reference values (DRV) for food energy and nutrients for the United Kingdom. | ||
Early reviews identified that deficiencies of iron, zinc, copper, manganese and chromium are most likely to occur as a result of dietary restrictions, drug nutrient interactions and protein losses (Wolk 1993; Rocco and Makoff 1997). Iron may need to be supplemented to maintain ferritin levels above 100ng/ml. The EBPG guidelines (EBPG 2007) do not recommend routine zinc or selenium supplements but note that if symptoms of these deficiencies are detected (including thyroid dysfunction due to low selenium) then a 3-6 month trial is warranted. A more recent review of trace element deficiency in patients on HD identified 128 studies and concluded that levels of zinc, selenium and manganese were lower than control groups. They highlighted an association between zinc deficiency and increased risk of infection which requires further investigation in the renal population (Tonelli et al. 2009).
Malnutrition
Malnutrition is a complication of HD and PD and its consequences have been well documented since these techniques became available. Effects of malnutrition are:
- failure to thrive;
- increased morbidity:
- delayed wound healing;
- decreased resistance to infection;
- electrolyte imbalance;
- prolonged hospitalisation;
- muscle wasting (skeletal muscle as well as heart/lung etc.);
- loss of protective subcutaneous fat;
- lethargy/apathy;
- delayed wound healing;
- increased mortality.
Causes of malnutrition
There are several overarching reasons for malnutrition in patients on dialysis and these are multifactorial in origin:
- Reduced dietary intake:
- reduced appetite (see below);
- existing malnutrition at the start of dialysis due to uraemia or unsupervised predialysis dietary restriction;
- conflicting dietary recommendations – e.g. increasing protein whilst decreasing the intake of phosphorus;
- dietary recommendations which decrease palatability of food: decreased salt intake, decreased fat or sugar intake;
- co-existing gastro-intestinal disease (i.e. gastroparesis) or other co-morbidities such as cardiac failure, cancer, stroke;
- multipharmacy prescriptions;
- inadequate provision of nutrients in food provided by hospitals or nursing homes;
- financial constraints;
- decreased physical ability (shopping, cooking);
- reduced appetite (see below);
- reduced appetite;
- raised cytokines; TNFα;
- inadequate dialysis leading to uraemia;
- suppression of appetite due to peritoneal dialysis; this may be due to glucose absorption, abdominal pressure from the dialysate fluid, constipation;
- anaemia or other micronutrient deficiencies; zinc, B vitamins;
- old age; taste, sight changes;
- depression;
- raised cytokines; TNFα;
- Increased nutritional losses;
- losses during dialysis: vitamins, minerals, proteins and amino acids;
- persistent proteinuria;
- protein loss during peritonitis;
- losses during dialysis: vitamins, minerals, proteins and amino acids;
- altered metabolism;
- inflammatory response as a result of the dialysis process; the presence of inflammatory cytokines results in appetite loss, muscle breakdown and low albumin;
- untreated acidosis: muscle and bone metabolism is impaired;
- inadequate dialysis: buildup of waste products and cytokines;
- low physical activity: low anabolic stimulation of muscle and bone;
- intercurrent illness/infections: causing raised requirements, increased cytokines;
- hyperparathyroidism: muscle and bone metabolism is impaired;
- resistance to insulin, growth hormone and insulin like growth factor;
- low ‘active’ vitamin D: muscle and bone metabolism is impaired.
- inflammatory response as a result of the dialysis process; the presence of inflammatory cytokines results in appetite loss, muscle breakdown and low albumin;
Co-morbidities and drug nutrient interactions also have an impact on all of these four main points.
Detection of malnutrition
As discussed earlier, the detection of malnutrition should involve monitoring a number of components; anthropometry, biochemistry, clinical, diet and exercise/activity. Many screening tools only include two of these components. For example the Malnutrition Universal Screening Tool (MUST) incorporates anthropometry (weight, weight change) and diet. Subjective Global Assessment includes anthropometry, clinical, diet and exercise/activity although adapted versions have also included measurement of biochemistry (Kalantar-Zadeh et al. 2001). The Canada-USA (CANUSA) Peritoneal Dialysis Study Group showed the relative risk of death on PD increased with age, insulin independent diabetes mellitus, cardiovascular disease, low serum albumin and worsening nutritional status. Malnutrition (identified by SGA) correlated strongly with an increase in number of days hospitalised (Canada-USA Peritoneal Dialysis Study Group 1996).
Albumin has often been used as a marker for poor nutritional intake, and although it is certainly correlated with poor outcome (increase morbidity and mortality) it is probably the case that the conditions which cause a low albumin have an impact on nutrition as well as albumin – i.e. they co-correlate.
The use of different methods to determine the extent of malnutrition has led to some differences in the stated prevalence. BAPEN (a charitable association that raises awareness of malnutrition and works to advance the nutritional care of patients) has been coordinating the use of MUST in UK hospitals. The annual audit has indicated that the prevalence of malnutrition in renal in-patients is 30%. However, using other scoring systems the prevalence has been much higher at 64–90%. The issue lies with the sensitivity and specificity of MUST. When MUST was compared with SGA in 64 patients on HD, the sensitivity was 31% and the specificity was 95%; that is, it had poor ability to detect ‘true cases’ of malnutrition (Fisher et al. 2010). In addition, MUST is a poor detector of malnutrition in liver disease which is similar to kidney disease in that it can be a long term condition which features many metabolic changes (Arora et al. 2012).
Protein Energy Wasting (PEW)
An expert working party convened by the International Society of Nutrition and Metabolism in Renal Disease (ISNMRD) has attempted to simplify the nomenclature used to describe malnutrition in renal disease (Fouque et al. 2008). The term they feel encompasses the changes indicating decreased nutritional status is ‘protein energy wasting’. They define this as a ‘state of decreased body stores of protein and energy fuels’ which is ‘often associated with diminished functional capacity’. It includes syndromes such as MIA but they emphasise that PEW, as can be seen from the list above, is not just due to an inflammatory component (although it is estimated that up to 50% of patients with renal disease show evidence of an ongoing inflammatory response).
Management of malnutrition
Assessing nutritional status
Whichever methods of assessment are used to assess nutritional status, they should be done regularly and systematically for all patients as physical deterioration can occur rapidly and is difficult to reverse. It is important to identify malnutrition, so early rehabilitation and improved clinical outcomes are possible. The National Institute for Health and Clinical Excellence (NICE) guidelines (National Institute for Health and Clinical Excellence 2006), recommended that ‘All hospital in-patients on admission and out-patients at first appointment should be screened for presence or risk of malnutrition.’ Screening should take place weekly for inpatients, and within 1 month of starting dialysis for outpatients (Wright and Jones 2010).
The European Society for Clinical Nutrition and Metabolism (ESPEN) guidelines (ESPEN 2002) have described the prerequisites of a useful assessment tool. This tool should have the following features:
- good predictive validity – the individual identified ‘at risk’ will benefit from intervention;
- good content validity – includes ‘all’ relevant components of the problem it is meant to solve;
- high reliability – small inter-observer variation;
- practical;
- linked to ‘specific protocols for action’;
- rapid and simple, so that it can be performed by admitting staff or community healthcare teams.
The authors of the K/DOQI guidelines recommended that further work needed to be carried in order to ‘identify and validate’ the optimal panel of measures for screening and assessment of nutritional status in patients with renal diseases (K/DOQI 2000). In the meantime nutritional assessment should incorporate a number of complimentary measures that at least include dietary assessment and body composition measures (Engel et al. 1995, EBPG 2007). The MUST tool (Stratton et al. 2003) and Subjective Global Assessment contain both these elements although the shortcomings with MUST have already been discussed. So far only SGA has been validated for use with patients with renal diseases and is recommended by the Renal Association guidelines (Wright and Jones 2010).
Methods of dietary assessment
Methods of dietary assessment include:
- Twenty-four hour recall: this is quick and assesses recent intake.
- Three-day food diary: can include a weekend day and one HD day and gives a better illustration of the variety of foods eaten. It may also reveal the disruption to meal times caused by a dialysis day – for HD patients significant decreases in all nutrients can occur three days out of seven.
- Urea content of 24-hour urine samples in predialysis patients and urine plus dialysate collection in patients on PD can be used to calculate urea nitrogen appearance. This is equivalent to dietary protein intake in nutritionally stable patients (PD dialysate collection can also be used to estimate protein losses).
- In patients on HD, changes in plasma urea measurements (collected for dialysis adequacy tests) can be used to calculate the protein catabolic rate (PCR). This is only equivalent to protein intake in patients who are nutritionally stable. Urinary urea also needs to be included in the calculation.
Techniques to Assess Body Composition
The best known techniques are:
- Height and weight (BMI), percentage weight loss over time. The minimum data set and diagnostic criteria for malnutrition recommended by the RA include: BMI < 20 kg m–2, actual body weight < 85% ideal weight, unintentional oedema free weight loss of 5% in 3 months or 10% in 6 months.2
- Mid-upper arm anthropometry: mid-arm circumference (MAC), tricep skinfold, mid-arm muscle circumference. MAC is easy to perform, noninvasive and training can reduce observer error repeatable to an acceptable degree. Skinfolds are more prone to observer error; a measure of muscle function may be a better way of assessing muscle mass (e.g. grip strength, sit-to-stand test or walking test). MAMC can be calculated from a measurement of MAC and the triceps skinfold.
- Bioelectrical impedance: quick and noninvasive, but it is an indirect measure and it is influenced by hydration and electrode placement (Lindley et al. 2005). BIA measurement of phase angle may be helpful in determining hydration state. Renal Association guidelines recommend that BIA and handgrip strength may be useful in those diagnosed at risk of or with malnutrition.
- Dual-energy X-ray absorptiometry (DEXA): measures bone mineral content and density. It relies on assumptions about hydration status which may not be valid in patients with renal diseases, particularly for the measurement of lean body mass. However DEXA is expensive.
Hypoalbuminaemia
It had always been assumed that serum albumin was a reliable marker of nutritional status, however this relationship has been questioned as other causes of low albumin are also common in renal disease including fluid overload and inflammation (Frieidman and Fadam 2010). As stated above, a low albumin is certainly predictive of a poorer outcome and an important predictor of morbidity and mortality. Lowrie and Lew (1990) showed that the relative risk of death increases as the serum albumin of the HD patient falls. These authors also concluded that longer treatment time and better nutritional status improve the clinical outcome of HD treatment. Later studies revealed that albumin was also a marker for morbidity and mortality in PD. Plasma albumin was lower in nonsurvivors after thirty months on PD (Davies et al. 1998) and as albumin decreased by 10 g/l there was an increased risk of morbidity (hospitalisation) which was five times greater in nondiabetic patients on PD and ten times greater in people on PD who had diabetes (Spiegel et al. 1993).
The correct diagnosis is crucial for appropriate medical management as there are several potential causes of hypoalbuminaemia:
- Decreased synthesis due to poor nutritional intake – albumin has a half-life of 2–3 weeks, therefore complete starvation can take at least this length of time to make an impact on plasma levels. In ‘partial’ starvation, where patients are not quite meeting their requirements and are slowly losing weight, albumin levels can be maintained for months even when substantial amounts of weight are lost, due to adaptive mechanisms.
- Decreased synthesis due to the acute phase response – this is part of the body’s immune response to cell damage which can arise through trauma, infection or cancer. The cytokine IL6 is thought to be the mediator which instructs the liver to reduce production of certain proteins (albumin, transferrin) and increase production of others (CRP, ferritin). This interrelation between CRP and albumin may explain why a low albumin has been associated in so many studies with increased morbidity and mortality.
- The presence of inflammation can also cause the endothelium to become ‘leaky’, with the redistribution of albumin pools, for example from vascular spaces to the intervascular space, which may have an impact on the efficacy of dialysis.
- Albumin losses due to proteinuria, dialysis losses or peritonitis.
- Dilution – if the patient is fluid overloaded, for example before a HD session, or if dry weight needs to be adjusted. For example, 3 L overload can dilute plasma albumin from 42 g/l to 37 g/l.
- Albumin assay methods vary – it is important to use the same method of measurement each time or if comparing patients based at different renal units.
Subjective global assessment
Subjective global assessment (SGA) is an assessment of nutritional status and was first performed on surgical patients (Detsky et al. 1987). It is based on patient history and physical examination. A simple questionnaire is usually completed by a trained nurse or dietitian.
History
The history includes weight changes, dietary intake, gastrointestinal symptoms and functional status and can include comorbid disease
Physical examination
Physical examination takes into account loss of subcutaneous fat, muscle wasting, oedema, ascites. Each section is rated on a three- or seven-point scale by the interviewer. An overall score is then assigned depending on the severity of symptoms. For the 3 point scoring system subjects are given a score of A, B, or C: A for well nourished, B for mild- moderate malnutrition and C for severe malnutrition. The seven-point score subdivides these categories into: A, A–, B+, B, B–, C+, C or sometimes a numerical score is used: SGA scores of 6–7 (well nourished), 3–5 (mild-moderate under nutrition) and 1–2 (severe under nutrition) (Appendix 13.2).
The seven-point SGA was developed for the CANUSA study (Churchill et al. 1996) and was found to positively correlate with BMI, percentage body fat and MAMC (Visser et al. 1999). A 1 unit lower SGA score was associated with a 25% increase in the relative risk of death and a 1 unit increase in score was associated with reduction in days hospitalised. Reproducibility was good: 81–91% when two observers were compared. A prospective longitudinal study of 1600 patients concluded that SGA could distinguish different degrees of PEW and confirmed that a greater degree of PEW was associated with increased mortality (de Mutsert et al. 2009).
K/DOQI Guidelines (K/DOQI 2000) stated that ‘SGA is a valid and clinically useful measure of protein- energy nutrition status in maintenance dialysis patients’. The UK Renal Association also supports the use of the three- or seven-point SGA.
Protein energy wasting
The panel of measures which the ISNMRD panel recommend to diagnose PEW include:
- Serum chemistry: albumin, prealbumin, cholesterol.
- Body mass: unintentional weight loss, total body fat percentage.
- Muscle mass: muscle wasting, MAMC, creatinine appearance.
- Dietary intake: protein intake, energy intake.
They acknowledged that, whilst nutritional scoring systems such as SGA will to some extent identify PEW, they will not provide a definitive diagnosis (Fouque et al. 2008).
Treatment of malnutrition
A thorough assessment should identify the nutritional state of the patient and any modifiable causes of deterioration. This is the diagnosis stage in the Nutrition Care Process outlined by the American Dietetic Association and illustrated with respect to patients with renal disease (Memmer 2013). Although there are usually several possible causes and potential treatments a protocol should be in place so that an initial intervention can be started immediately (a good example of this in patients who do not have renal disease is illustrated by the MUST tool, which describes the actions to be taken for each level of malnutrition). This may require nursing staff to start monitoring the patient using food charts or to start appropriate supplements (suitable for patients with renal disease) in the first instance and alert the renal dietitian. The dietitian will carry out a full nutritional assessment, however, identifying and targeting the multiple barriers to achieving good nutritional status requires a team approach and the correct interventions and care plan can result in improvements in several nutritional parameters (Leon et al. 2006).
The primary aim of nutrition support is for patients to meet their nutritional requirements (macro and micronutrients) in the least invasive, most effective way. Protein and energy requirements are calculated using the formula previously shown. The patient’s protein and energy intake can be calculated from food intake charts or a 24-hour recall.
requirements – current intake = nutrient deficit
This deficit has to be met using the following methods of nutrition support:
- Oral – for patients who are able to eat and drink normally: fortified foods or foods with a high nutrient content or sip feeds; support and encouragement with eating if necessary.
- Nasogastric or gastrostomy feeding for patients who are unable or unwilling to eat or drink normally. Oral and tube feeding can be combined (for example, tube feeding overnight, while the patient sleeps and encouraging normal eating/drinking during the day).
- Intraperitoneal amino acids (IPAA) with PD.
- Intradialytic parenteral nutrition (IDPN) during HD.
- Total parenteral nutrition (TPN) for patients whose gastrointestinal tract is not functioning sufficiently.
Nutrition support is ineffective without close team work and each member of staff agreeing to carry out specific roles. All healthcare workers directly involved in in-patient care should receive training in the following (National Institute for Health and Clinical Excellence 2006):
- the importance of nutrition;
- indications for nutrition support and delivery;
- when and where to seek advice on nutrition support.
Oral nutritional support (ONS)
The key stages in providing ONS are:
- identifying any barriers preventing the patients from meeting their requirements and referral to other specialists, if necessary;
- involving the patient in deciding which type of supplementation is appropriate.
Barriers to meeting requirements
Gastro-intestinal problems should be identified by a nutrition screening tool. If chewing and/or swallowing are a problem, the consistency of food may need to be modified. The catering department will have to be notified and it may be appropriate to refer to the speech-and-language therapist. People who lose weight rapidly often find that their dentures no longer fit properly; unfortunately this problem cannot usually be remedied during the patient’s stay. Thrush infections are common in undernourished patients or patients who are prescribed immunosuppressants. This can cause a sore mouth, taste changes and swallowing problems and can be relatively easily treated with antifungal agents. Constipation and diarrhoea are equally deleterious to the patient’s appetite, and need to be identified and treated.
Motivating and encouraging the patient at meal times is often necessary and needs to be supervised by a member of the nursing team. Actively involving older people in their nutritional care and allocating a nurse to oversee their nutritional needs can improve intake by 30% (Pederson 2005). If active depression is an underlying cause, it may be useful to involve the help of a counsellor.
Prior to admission, the patient may have had a long period of deterioration due to the lack of ability or facilities to cook and shop. These problems may be resolved by a social worker and involvement of other family members or friends. If physical weakness is a problem, a physiotherapist or occupational therapist can suggest exercises to strengthen the patient or tools to assist the patient.
In hospital, physical weakness may prevent the patient cutting up their food or removing packaging. Poor vision may also be a problem. Assistance must be provided when these problems are identified. Loss of muscle mass is one of the main consequences of malnutrition and, in elderly people in particular, this leads to decreased capacity for the activities of daily living, loss of independence and decline in mental status.
Physical activity and physiotherapy can improve muscle mass and should be part of nutrition support in the elderly patient (Suetta et al. 2004). Studies in patients on dialysis have shown improvements in muscle fibre and general muscle structure as well as exercise capacity, after a training programme has been initiated (Kopple et al. 2005). However, other authors have found a disappointing response to resistance exercise training (Ikizler 2011) and it may be that acidosis, which is prevalent in patients with kidney disease, actually worsens during exercise, thus preventing a more positive outcome (Clapp and Bevington 2011). Nonetheless, both UK and European guidelines promote physical activity in patients undergoing dialysis and recommend that patients should be given the opportunity to participate in regular exercise programmes (Wright and Jones 2010).
Food supplementation
This may involve providing fortified foods, snacks or drinks with high nutritional content. Some of these can be given between meals so that the patient can eat little and often. Examples of these foods include sweet biscuits, cakes, cheese and biscuits, yogurt and mousses.
Supplement drinks, mousses and soups are available as well as protein and energy powders and liquids, although the latter are more likely to be added during food preparation. In order to metabolise protein and energy supplements efficiently, the full range of micronutrients are required and an appropriate multivitamin and mineral supplement may be also given. The supplement drinks and desserts should be prescribed as a medicine and their listing on the drug chart may help improve distribution and monitoring of intake. The drinks may be milk shakes, juice drinks, yogurt drinks. The flavours can include various fruits, vanilla, chocolate, neutral and savoury. Mousses and bars are available and may be useful for patients with reduced fluid allowances.
The renal dietitian will be aware of the nutritional content of any supplements as well as potassium and phosphate content. The ratio of protein to energy may vary, which may suit the needs of different patients. A malnourished patient’s potassium and phosphate intakes are usually poor and they may even have low plasma levels, however it is always necessary to be aware of the potassium content; powdered drinks which require the addition of milk may be unsuitably high in potassium. The patient will usually need to continue phosphate binders unless they are extremely malnourished.
Nursing and/or catering staff need to ensure that the supplements/fortified foods are given to the patient at the right time, at the correct temperature and that they are actually consumed by the patient.
Nasogastric and gastrostomy feeding
The insertion of a gastrostomy feeding tube enables long-term tube feeding to be carried out without the discomfort of a nasogastic (NG) feeding tube. NICE guidelines recommend gastrostomy placement if NG tube feeding is not appropriate or if feeding is likely to be required for more than four weeks. Renal formulae are available with reduced electrolyte content but high nutrient density to reduce the fluid intake. Surveys have shown that the majority of (nonrenal) patients (83%) accepted the gastrostomy feeding well3. In comparison with NG feeding there were fewer complications, greater comfort, better quality of life and better nutritional efficacy (Loser et al. 2005). In adult patients on HD, there have been fewer reports of gastrostomy use. However, one study of eight patients (Sayce et al. 2000) showed improved dry weight, MAMC and albumin after three months of feeding. A PD case study also showed improved weight and albumin over six months (Patel and Raftery 1997). A review of ten patients on PD in one centre in the United States found that peritonitis was a frequent complication (Fein et al. 2001) although gastrostomy feeding in children seems more successful and perhaps some lessons need to be learnt from the techniques used in paediatrics (von Schnakenburg et al. 2006).
Renal-specific formulae
Low-electrolyte, low-fluid supplements and feeds, and multivitamin supplements have been developed for patients who have kidney disease. Even these adapted nutrition support regimens may not result in the best possible outcomes because they do not supply enough of the relevant nutrients, and they may even add to the burden of nutrients which cannot be efficiently utilised at the time. The metabolic changes in renal disease have already been mentioned and these include the inflammatory response, which may involve rapid turnover of immune cells, increased antibody production and production of acute phase proteins (such as CRP and fibrinogen). This creates an increased demand for certain nutrients such as branch chain amino acids, omega-3 fatty acids and glutamine. Future research will continue to investigate targeted nutrition, which aims to supply essential nutrients such as glutamine, arginine and DNA precursors, or attempts to attenuate the inflammatory response using omega-3 essential fatty acids in order to reduce catabolism in patients with kidney disease.
A meta-analysis of the effects of oral supplements and enteral tube feeding in dialysis patients concluded that albumin levels and overall dietary intake improved. More research was required to investigate other clinical end points (anthropometry, quality of life, physical function) and also to determine whether renal specific formulae had any advantage over standard feeds (Stratton et al. 2005).
Nutritional peritoneal dialysis
Dialysate containing 1.1% amino acid solution will provide a net gain of 18 g amino acids from one 2 L exchange. It is important to ensure that energy requirements are being met otherwise the aim of achieving a positive nitrogen balance will not be met. Studies have indicated an improvement in nitrogen balance with increases in albumin, the dialysate seems to be well tolerated (Taylor et al. 2002; Tjiong et al. 2005). Use of amino acid containing dialysate will also reduce the overall amount of glucose absorbed during dialysis (Woodrow and Davies 2010).
Intradialytic parenteral nutrition
Parenteral formulas containing 50–70 g amino acids and 1000 kcal from fat and carbohydrate, can be safely delivered via the venous return during the HD treatment. Glucose monitoring during treatment is essential to prevent hyperglycaemia and fluid balance can be adjusted accordingly. An oral multivitamin and mineral supplement may be required to ensure efficient use of the protein and calories. The cost of IDPN is ten times that of oral supplementation, therefore the latter method should be encouraged first. Case reports have shown the good safety profile of this technique (Dukkipati et al. 2010), although patients must be monitored for refeeding syndrome, hyperglycaemia and hypertriglyceridaemia. However a systematic review only identified three randomised controlled trials comparing IDPN with alternative means of nutrition support and stated that there was insufficient evidence to demonstrate net benefit or harm (Sigrist et al. 2010). In the United Kingdom, IDPN is often used after alternative feeding methods have been tried (and failed) or discounted, because of the burden it would place on the patient and their carer.
Monitoring nutritional support
This may require daily recording of food intake charts and weighing the patient regularly. Food records are best completed as the meal is being finished in order to observe the patient and note any problems, as well as record the amount and type of food eaten. Patients can often forget what they have eaten within a couple of hours. Monitoring of biochemistry and fluid balance is also crucial for patients with renal disease (very low as well as high levels of potassium and phosphate are possible) and most renal units have computer systems that can identify values outside of the normal range and create an alert for action to be taken. Repeat assessments of nutritional status should occur 6–8 weeks after starting dialysis (the first measurement taken within one week of starting treatment), and then repeated every 4–6 months for stable dialysis patients. Those identified as malnourished will be assessed much more frequently e.g. dietary intake and oedema free weight may be assessed weekly but other body composition measures may take longer to change; arm anthropometry such as MAC can be repeated monthly.
Transplantation
Renal transplantation is thought to offer the patient with established renal failure the best chance of rehabilitation and a good quality of life.
Postoperative transplant care
Appetite may initially be poor postoperatively and steroids can increase protein catabolism; therefore, both kidney and gastrointestinal function should be monitored. The rate at which biochemistry and urine output return to normal can vary (sometimes within a couple of days after surgery, or it can take several weeks) and needs to be monitored closely. There may be an ‘oliguric stage’ where fluid and electrolyte reductions are still required. This can progress to a polyuric stage, where intravenous support may be necessary to prevent fluid and electrolyte levels dropping below normal; dehydration at this stage can damage the new kidney. Nutritional requirements and the need for nutrition support can be assessed as previously described. Uncomplicated surgery increases metabolic rate by 5 to 20% and this should be included in the protein and energy requirements.
Long-term post-transplant care
The advice given to patients should include healthy eating (with some advice on food hygiene), exercise, and avoidance of smoking, excess alcohol intake and exposure to too much sun. One the positive aspects of transplantation is that the dietary restrictions are relaxed; however it is necessary to reinforce advice on healthy eating to help reduce the risk of obesity, cardiovascular disease, diabetes and also cancer.
Nutrient requirements are based on recommendations for the general population. The ‘Eat Well Plate’ is an appropriate model on which to base nutritional advice and meal suggestions.
Cardiovascular disease
Cardiovascular disease is the cause of 60% of deaths in transplanted patients and the incidence of CVD is five times greater than expected for age and gender. The main risk factors are obesity, hypertension, hyperlipidaemia, diabetes, sedentary lifestyle and smoking. The European Best Practice Guidelines (EBPG 2002) for renal transplantation also list hyperhomocysteinaemia as a risk factor.
Obesity is common with a successful transplant and is multifactorial:
- The patient’s appetite increases due to increased feeling of wellbeing and release from dietary constraints. Relaxation of restrictions after transplant can lead to a more liberal intake of high calorie foods such as dairy products, fried potato products and chocolate.
- Steroids stimulate the patient’s appetite.
- Activity and exercise levels may be low. Patients are often reluctant to exercise for fear of damaging the new kidney, and also because of lack of confidence and low exercise tolerance owing to previous inactivity.
The combination of an increased calorie intake and low activity levels leads to a rapid gain in body fat. Obesity contributes to hypertension, hyperlipidaemia and insulin resistance and these in turn contribute to CVD. Transplant medication is also partly responsible for raising lipid levels. Graft survival is also lower in the obese and the patient should be made aware of the risk of obesity at an early stage, pretransplant if appropriate. Target lipid levels are the same as the general population (National Institute for Health and Clinical Excellence 2006b; Baker et al. 2011)
Other CVD risk factors are:
- elevated levels of serum triglyceride and cholesterol are found in 36% and 63% of transplant patients respectively;
- arterial hypertension is present in 60–85% of patients;
- post-transplant diabetes affects 4–18% of patients;
- homocysteine is elevated, although not to the same level as on dialysis.
Control of calorie intake and increasing energy expenditure through activity and exercise are usually necessary. Additionally, poor eating habits may have formed whilst adhering to the dietary allowances on dialysis: intake of fruit and vegetables and other ‘cardio-protective’ foods, such as oily fish are often low (very few patients have the recommended five portions of fruit and vegetable per day, or fish twice a week). Regular reinforcement of healthy eating advice can help reduce weight gain, improve lipid levels and also help control hypertension.
Bone disease
An improved lean body mass (muscle) and bone strength may also result from diet and exercise advice. Patients with or at high risk of developing osteoporosis may need to avoid steroids; DEXA scanning can be used to monitor the condition. The Royal College of Physicians guidelines for steroid induced osteoporosis are recommended (Royal College of Physicians 2002). These guidelines discuss the importance of vitamin D and calcium intake, and weight bearing exercise to improve bone health. They also discourage smoking, excess weight and excess alcohol intake.
Diabetes
The development of new-onset diabetes after transplantation (NODAT) is exacerbated by immunosuppressive agents: steroids, tacrolimus and ciclosporin. Elderly, African-Caribbean and Hispanic patients are most at risk. Graft loss is four times greater for patients who have diabetes. Fasting blood glucose should be checked every three months in all nondiabetic transplanted patients. Diet and exercise interventions help reduce the risk of metabolic syndrome and developing diabetes (Engel 2003; Diabetes UK 2011).
Summary of dietary advice for renal transplant recipients
- Monitor biochemistry and blood pressure control. In particular lipid levels (cholesterol and triglycerides), blood glucose, potassium, bone minerals, PTH and haemoglobin.
- Aim for acceptable body mass index: the ‘Eat Well Plate’ is an appropriate food model to use.
- Emphasise eating a variety of fruit and vegetables: aim for at least five portions per day.
- Encourage high-fibre foods (soluble and insoluble).
- Encourage fish, particularly oily fish, lean meats and pulses.
- Foods high in sugar, saturated fat and salt should be used sparingly.
- Dairy products should be low fat – with attention to meeting calcium requirements.
- Alcohol consumption should be within usual recommendations.
- Be aware of good food hygiene practices.
- Encourage physical activity and regular exercise.
- Avoid smoking and too much sun exposure.
Ideally a team of specialists should be available to help with the rehabilitation of transplanted patients, including the dietitian, nurse, physiotherapist, social worker and counsellor.
Dietary Management in Paediatrics (also refer to Chapter 12)
Chronic kidney disease may present after birth or later in life and can proceed to established renal failure during childhood. Growth and neurodevelopment depend strongly on nutrition during early childhood and can be profoundly affected by chronic renal failure (Fischbach et al. 2011). This is especially the case during infancy and in very young children where spontaneous nutritional intake is poor. Early nutritional intervention is essential and must be maintained on a long-term basis. Fluctuating clinical and biochemical disturbances that come with changes in treatment necessitate the constant review and readjustment of the nutritional prescription by an experienced dietitian (Coleman 2008). Infants may present with particular problems such as anorexia and vomiting, and an understanding of the psychosocial effects often proves to be as important as the dietary advice (Norman et al. 1995). However growth and final height in infants with severe chronic kidney disease has been found to be influenced by comorbidity. Intensive feeding and early transplantation has been shown to result in a mean adult height within the normal range in patients without comorbidities (Mekahli et al. 2010).
Nutritional assessment should include the regular monitoring of growth (weight, height and head circumference) and dietary analysis by means of food diaries or dietary recall. Biochemical assessment with frequent review of fluid balance and prescribed medication such as phosphate binders and antireflux agents is recommended. The maintenance of normal serum calcium and phosphate levels is crucial to optimal bone development, and nutritional measures have a significant part to play, particularly in controlling phosphate levels. The KDOQI guidelines recommend starting to monitor bone biochemistry at CKD Stage 2. In children with a normal serum phosphate, with serum PTH concentrations exceeding the target range, a moderate dietary phosphate restriction has been shown to be beneficial with respect to the prevention and treatment of hyperparathyroidism, and safe with respect to growth, nutrition and bone mineralisation. Ongoing assessment for linear growth is encouraged (K/DOQI 2008).
The dietary aims in managing children with chronic kidney disease are dependent upon age, stage of CKD (K/DOQI 2008) and nutritional assessment, with particular attention paid to growth parameters. Oral nutritional supplements have an important role, and are frequently used. However, experience has shown that attempting to achieve adequate nutrition in this way can be stressful for families due to issues relating to vomiting, palatability and compliance.
A proactive approach to maintaining good nutrition and growth without the use of growth hormone has resulted in a programme of early instigation of dialysis in combination with nutritional support (Coleman et al. 1998; Lederman et al. 2002). Although nasogastric tubes are used successfully, supplementary feeding using a gastrostomy button device may be more suitable in the long term (Rees and Shaw 2007). The gastrostomy button also provides a convenient route for the administration of medication and fluids, which has undoubted benefits for the child and family.
Dialysis is seen only as a holding measure before transplantation. Most children do very well and resume normal eating and drinking post-transplant (Coleman and Watson 1998). However, even if the transplant is successful, with normal renal function attained, concerns remain that there may be a prolonged transition to exclusive oral nutrition in infants and children who commenced nutritional support via an enteral route early in life. Support should be provided to encourage oral stimulation from the time of commencement of tube feeding (Pugh and Watson 2006). Such children may continue to require a period of nutritional support post-transplant. Conversely, the lifting of dietary restrictions and initiation of steroid treatment in other children may require energy intake to be reduced to prevent rapid weight gain. A healthy, no-added-salt diet and exercise should be encouraged with ongoing dietetic advice.
Maintaining good nutrition in this group of children requires the collaborative efforts of a multidisciplinary team (Foster et al. 2012). An agreed philosophy of nutritional care and dietetic time to attend ward rounds regularly, outpatient clinics and psychosocial meetings are essential. Home and school visits with frequent telephone contact are also invaluable support measures.
Summary
This chapter has provided the opportunity for the reader to improve current theoretical and practical knowledge of renal nutrition. However dietary advice is constantly changing as a result of new research findings and evidence based guidelines. It is important that a positive effort is made to continuously review practice and to always involve patients in the decision making process.
Acknowledgements
With grateful thanks to Marianne Vennegoor, who was the original author of this chapter, and to Pearl Pugh who updated the section on paediatric nutrition.
References
Armas, L.A.G. and Heaney, R.P. (2011) Vitamin D: the iceberg nutrient. Journal of Renal Nutrition 21, 134–139.
Arora, S., Mattina, C., McAnenny, C. et al. (2012) Assessment of Nutritional Status in Patients with Cirrhosis: MUST is Not a Must. MSc thesis, University of Surrey.
Baker, R., Jardine, A. and Andrews, P. (2011) Renal Association Guidelines: Post-Operative Care of the Kidney Transplant Recipient, www.renal.org/clinical/guidelinessection/Post-operative-Care-Kidney-Transplant-Recipient.aspx (accessed 13 June 2013).
BDA-RNG (2011) Evidence Based Dietetic Guidelines: Protein Requirements of Adults on Haemodialysis and Peritoneal Dialysis, www.bda.uk.com/publications/statements/RNG_ProteinRequirementsAdultsHaemodialysisPeritonealDialysis.pdf (accessed 20 May 2013).
Block, G.A., Hulbert-Shearon, T.E., Levin, N.W. et al. (1998) Association of serum phosphorus and calcium phosphate product with mortality risk in chronic hemodialysis patients: a national study. American Journal of Kidney Disease 31, 607–617.
Brenner, B. (1983) Hemodynamically mediated glomerular injury and the progressive nature of kidney disease. Kidney International 23, 647–655.
Canada–USA Peritoneal Dialysis Study Group (1996) Adequacy of dialysis and nutrition in continuous peritoneal dialysis: association with clinical outcomes. Journal of the American Society of Nephrology 7, 198–207.
Cherniack, E.P., Levis, S. and Troen, B.R. (2008) Hypovitaminosis D: a stealthy epidemic that requires treatment. Geriatrics 63 (4), 24–30.
Churchill, D.N., Taylor, D.W. and Kesehaviah, P.R. (1996) Adequacy of dialysis and nutrition in continuous peritoneal dialysis: association with clinical outcomes. Journal of the American Society of Nephrology 7, 198–207.
Clapp, E.L. and Bevington, A. (2011) Exercise induced biochemical modifications in muscle in chronic kidney disease: occult acidosis as a potential factor limiting the anabolic effect of exercise. Journal of Renal Nutrition 21 (1), 57–60.
Coleman, J.E. (2008) The kidney, in Clinical Paediatric Dietetics, 2nd edn (eds V. Shaw and M. Lawson), Blackwell Scientific Publication, Oxford, pp. 158–182.
Coleman, J.E. and Watson, A.R.(1998) Growth post-transplantation in children previously treated with chronic dialysis and gastrostomy feeding, in Advances in Peritoneal Dialysis (ed. R. Khanna), University of Toronto Press, Toronto, pp. 271–273.
Collier, J. and Watson, A.R. (1994) Renal failure in children: specific consideration in management, in Quality of Life Following Renal Failure (eds H, McGee and C. Bradley), Harwood Academic Publishers, Chur, pp. 225–245.
Davies, S.J., Phillips, L., Griffiths, A.M. et al. (1998) What really happens to people on long-term peritoneal dialysis? Kidney International 54, 2207–2217
de Brito-Ashurst, I., Perry, L., Sanders, T.A. et al. (2011) Barriers and facilitators of dietary sodium restriction amongst Bangladeshi chronic kidney disease patients. Journal of Human Nutrition Dietetics 24 (1), 86–95.
de Mutsert, R., Grootendurst, D.C., Boeschoten, E.W. et al. (2009) SGA of nutritional status is strongly associated with mortality in chronic dialysis patients. American Journal of Clinical Nutrition 89, 787–793
De Seigneux, S. and Martin, P.-Y. (2009) Management of patients with nephrotic syndrome. Swiss Medical Weekly 139 (28–30), 416–422.
Detsky, A.S., McLaughlin, J.R., Baker, J.P. et al. (1987) What is subjective global assessment of nutritional status? Journal of Parenteral and Enteral Nutrition 11, 8–13.
Diabetes UK (2011) Evidence-Based Nutrition Guidelines for the Prevention and Management of Diabetes, www.diabetes.org.uk/nutrition-guidelines (accessed 13 June 2013).
Dukkipati, R., Kalantar-Zadeh, K. and Kopple, J.D. (2010) Is there a role for intradialytic parenteral nutrition? A review of the evidence. American Journal of Kidney Disease 55 (2), 352–364.
EBPG (2002) European best practice guidelines for renal transplantation. Nephrology Dialysis Transplantation 17 (suppl.) 4, 50–55.
EBPG (2007) EBPG guideline on nutrition. Nephrology Dialysis Transplantation 22 (suppl. 2), ii45–ii87
Elsayed, E.F., Tighiouart, H., Weiner, D.E. et al. (2008) Waist to hip ratio and body mass index as risk factors for cardiovascular events in CKD. American Journal of Kidney Disease 52, A45–A46.
Engel, B. (2003) Nutritional management of diabetic renal transplant recipients, in Nutritional Management of Diabetes Mellitus (eds G. Frost, A. Dornhorst and R. Moses), John Wiley & Sons, Inc., New York.
Engel, B., Kon, S.P. and Raftery, M.J. (1995) Identification of malnutrition in haemodialysis patients. Journal of Renal Nutrition 5 (2), 62–66.
ESPEN (2002) ESPEN guidelines for nutrition screening. Clinical Nutrition 22 (4), 415–421.
Evans, A. and Gardiner, C. (2008) Dietetic management of hyperphosphataemia. Complete Nutrition 8, 40–42.
Fein, P.A., Madane, S.J., Jorden, A. et al. (2001) Outcome of percutaneous endoscopic gastrostomy feeding in patients on peritoneal dialysis. Advances in Peritoneal Dialysis 17, 148–152.
Fischbach, M., Fothergill, H., Seuge, L. and Zaloszyc, A. (2011) Dialysis strategies to improve growth in children with chronic kidney disease. Journal of Renal Nutrition 21 (1), 43–46.
Fisher, K., Paxton, R., Jackson, H. and Engel, B. (2010) Comparison of screening tools in patients undergoing haemodialysis. Paper presented at the BDA Research Conference, London, 2010.
Fissell, R.B., Bragg-Gresham, J.L., Gillespie, B.W. et al. (2004) International variation in vitamin prescription and association with mortality in the Dialysis Outcomes and Practice Patterns Study (DOPPS). American Journal of Kidney Disease 44 (2), 293–299.
Foster, B.J., McCauley, L. and Mak, R.H. (2012) Nutrition in infants and very young children with chronic kidney disease. Pediatric Nephrology 27, 1427–1439.
Fouque, D., Kalantah-Zadeh, K., Kopple, J. et al. (2008) A proposed nomenclature and diagnostic criteria for protein energy wasting in acute and chronic kidney disease. Kidney International 73, 391–398.
Fouque, D., Laville, M. and Boissel, J.P. (2006) Low protein diets for chronic kidney disease in non diabetic adults. Cochrane Database of Systematic Reviews 3.
Fouque, D., Wang, P. and Laville, M. et al. (2000) Low protein diets delay end-stage renal disease in non-diabetic adults with chronic renal failure. Nephrology Dialysis Transplantation 15, 1986–1992.
Friedman, A.N. (2006) Adiposity in dialysis: good or bad? Seminars in Dialysis 19 (2), 136–140.
Friedman, A.N. and Fadem, S.Z. (2010) Reassessment of albumin as a nutritional marker in kidney disease. Journal of the American Society of Nephrology 21(2), 223–230.
Ginn, H., Rigalleau, V. and Aparicio, M. (1999) Which diet for diabetic patients with chronic renal failure? Nephrology Dialysis Transplantation 14, 2577–2579.
Goodman, W.G., Goldin, J., Kulzon, B.D. et al. (2000) Coronary artery calcification in young adults with end-stage renal disease who are undergoing dialysis. New England Journal of Medicine 342, 1478–1482.
Gonzalez-Parra, E., Gracia-Iguacel, C., Egido, J. and Ortiz, A. (2012) Phosphorus and nutrition in kidney disease. International Journal of Nephrology DOI: 10.1155/2012/597605.
Hadfield, C. (1992) The nutritional adequacy of a low protein diet. Journal of Renal Nutrition 2 (3), (suppl. 1), 37–41.
Hakim, R.M. and Lazarus, J.M. (1995) Initiation of dialysis. Journal of the American Society of Nephrology 6, 1319–1328.
Halverson, N.A., Wilkens, K.G., Worthington-Roberts, B. (1993) Interdialytic fluid gains in diabetic patients receiving hemodialysis treatment. Journal of Renal Nutrition 3, 23–29.
Henderson, I.S., Leung, A.C., Shenkin, A. (1984) Vitamin status in CAPD. Peritoneal Dialysis Bulletin 4, 143–145.
Holt, S. and Goldsmith, D. (2010) Cardiovascular Disease in CKD, www.renal.org/Clinical/GuidelinesSection/CardiovascularDiseaseInCKD.aspx (accessed 20 May 2013).
Hong, S.Y., Yang, D.H. and Chang, S.K. (1998) Plasma homocysteine, vitamin B6, vitamin B12 and folic acid in end-stage renal disease during low-dose supplementation with folic acid. American Journal of Nephrology 18, 367–372.
Hull, R.P. and Goldsmith, D.J.A. (2008) Nephrotic syndrome in adults. British Medical Journal 336, 1185–1189.
Hunt, L. (2011) Provision of water-soluble vitamin supplementation for haemodialysis patients. Journal of Human Nutrition and Dietetics 24 (3), 289–290.
Ifudu, O., Dawood, M., Homel, P. et al. (1997) Excess interdialytic weight gain provokes antihypertensive drug therapy in patients on maintenance hemodialysis. Dialysis Transplant 26, 541–559.
Ikizler, T.A. (2011) Exercise as an anabolic intervention in patients with end stage renal disease. Journal of Renal Nutrition 21 (1), 52–56.
Ikizler, T.A., Greene, J.H., Wingard, R.L. et al. (1995) Spontaneous dietary protein intake during progression of chronic renal failure. Journal of the American Society of Nephrology 6, 1386–1391.
Ikizler, T.A. and Hakim, R.M. (1996) Nutrition in end-stage renal disease. Kidney International 50, 343–357.
Joint British Societies (2005) JBS2 Joint British Societies Guidelines on prevention of cardiovascular disease in clinical practice. Heart 1 (suppl. V), v1–v52.
Johnson, D.W. (2006) Dietary protein restriction as a treatment for slowing chronic kidney disease progression: the case against. Nephrology 11, 58–62.
Jones, C.H., Wells, L., Stoves, J. et al. (2002) Can a reduction in extracellular fluid volume result in increased serum albumin in peritoneal dialysis patients? American Journal of Kidney Diseases 39, 872–875.
Kalantar-Zadeh, K., Kopple, J.D., Block, G. and Humphreys, M.H. (2001) A malnutrition-inflammation score is correlated with morbidity and mortality in maintenance hemodialysis patients. American Journal of Kidney Disorders 38 (6), 1251–1263.
Kari, J.A., Gonzalez, C., Ledermann, S.E. and Rees, L. (2000) Outcome and growth of infants with severe chronic renal failure. Kidney International 57, 1681–1687.
K/DOQI (2000) Clinical practice guidelines for nutrition in chronic renal failure. National Kidney Foundation. American Journal of Kidney Diseases 35 (suppl. 2), S1–140.
K/DOQI (2003) National Kidney Foundation. K/DOQI Clinical Practice Guidelines for Managing Dyslipidemias in Chronic Kidney Disease. American Journal of Kidney Diseases 41 (suppl. 3), S1–S92, www.kidney.org/professionals/kdoqi/guidelines_lipids/index.htm (accessed 20 May 2013).
K/DOQI (2008) Clinical Practice Guidelines for Nutrition in Children with CKD: 2008 update. Executive summary. American Journal of Kidney Diseases 53, S11–S104.
Klahr, S., Levey, A.S., Beck, G.J. et al. (1994) The effects of dietary protein restriction and blood-pressure control on the progression of chronic renal disease. New England Journal of Medicine 330, 878–884.
Konings, C.J., Kooman, J.P. and Schonck, M. (2002) Fluid status, blood pressure, and cardiovascular abnormalities in patients on peritoneal dialysis. Peritoneal Dialysis International 22, 477–487.
Kopple, J.D., Storer, T. and Casburi, R. (2005) Impaired exercise capacity and exercise training in maintenance haemodialysis patients. Journal of Renal Nutrition 15 (1), 44–48.
Kopple, J.D., Wolfson, M., Chertow, G.M. et al. (2000) Clinical practice guidelines for nutrition in chronic renal failure. American Journal of Kidney Diseases 35, S17–S140.
Ledermann, S.E., Lewias, S., Moloney, J. et al. (2002) Gastrostomy feeding in infants and children on peritoneal dialysis. Pediatric Nephrology 17, 246–250.
Leon, J.B., Albert, J.M., Gilchrist, G. et al. (2006) Improving albumin levels among haemodialysis patients: a community-based randomized controlled trial. American Journal of Kidney Diseases 48 (1), 28–36.
Lim, V.S. and Flanigan, M.J. (2001) Protein intake in patients with renal failure: comments on the current NFK-DOQI guidelines for nutrition in chronic renal failure. Seminars in Dialysis 14 (3), 150–152.
Lindley, E., Devine, Y., Hall, L. et al. (2005) A ward based procedure for assessment of fluid status in peritoneal dialysis patients using bioimpedance spectroscopy. Peritoneal Dialysis International 25 (suppl. 3), S46–S48.
Loser, C., Aschl, G., Hebuterne, X., et al. (2005) ESPEN guidelines on enteral nutrition – percutaneous endoscopic gastrostomy (PEG). Clinical Nutrition 24, 848–861.
Lowrie, E.G. and Lew, N.L. (1990) Death risk in hemodialysis patients: the predictive value of commonly measured variables and an evaluation of death rate differences between dialysis facilities. American Journal of Kidney Diseases 15, 458–482.
MacGregor, M.S. and Taal, M.W. (2011) Detection, Monitoring and Care of Patients with CKD, www.renal.org/Clinical/GuidelinesSection/Detection-Monitoring-and-Care-of-Patients-with-CKD.aspx (accessed 20 May 2013).
Makoff, R. (1999) Vitamin replacement therapy in renal failure patients. Mineral Electrolyte Metabolism 25, 349–351.
Mandayam, S. and Mitch, W.E. (2006) Dietary protein restriction benefits patients with chronic kidney disease. Nephrology 11, 53–57.
McCann, L. (1996) Subjective global assessment as it pertains to the nutritional status of dialysis patients. Dialysis Transplant 25,190–202, 225.
McIntyre, C., Harper, I., Macdougall, I.C. et al. (1997) Serum C-reactive protein as a marker of infection and inflammation in regular dialysis patients. Clinical Nephrology 48, 371–374.
McKenzie, S.I. and Henderson, I.S. (1986) The effect of increased dietary fibre intake on regular haemodialysis patients, in Aspects of Renal Care (eds E. Stevens and P. Monkhouse), Baillière Tindall, London, pp. 172–178.
Mekahli, D., Shaw, V., Ledermann, S.E. and Rees, L. (2010) Long-term outcome of infants with severe chronic kidney disease. Clinical Journal of the American Society of Nephrology 5 (1), 10–17.
Memmer, D. (2013) Implementation and practical application of the nutrition care process in the dialysis unit. Journal of Renal Nutrition 23 (1), 65–73.
Mikhail, A., Shrivastava, R. and Richardson, D. (2010) Renal Association Guidelines: Anaemia in CKD, www.renal.org/Clinical/GuidelinesSection/AnaemiaInCKD.aspx (accessed 20 May 2013).
Millward, D.J. and Jackson, A.A. (2003) Protein/energy ratios of current diets in developed and developing countries compared with a safe protein/energy ratio: implications for recommended protein and amino acid intakes. Public Health Nutrition 7 (3), 387–405.
Muth, I. (1991) Implications of hypervitaminosis A in chronic renal failure. Journal of Renal Nutrition 1, 2–8.
National Institute for Health and Clinical Excellence (2006a) Nutritional Support in Adults – Oral Supplements, Enteral Tube Feeding and Parenteral Nutrition, NICE, London.
National Institute for Health and Clinical Excellence (2006b) CG43; 2006 Obesity: NICE Guideline, www.nice.org.uk/guidance/CG43/NICEGuidancex (accessed 20 May 2013).
National Institute for Health and Clinical Excellence (2008) CG73 2008 CKD: Early Identification and Management of Chronic Kidney Disease in Adults in Primary and Secondary Care, www.nice.org.uk/CG73 (accessed 20 May 2013).
National Institutes of Health (1993) Morbidity and Mortality of Dialysis. NIH Consensus Statement, National Library of Medicine, Office of Medical Applications of Research, National Institutes of Health, Bethesda, MD, pp. 1–33.
Norman, L.J., Coleman, J.E. and Watson, A.R. (1995) Nutritional management in a child on chronic peritoneal dialysis; a team approach. Journal of Human Nutrition 8, 209–213.
Pagenkemper, J.J., Burke, K.I., Roderick, S.L. et al. (1994) Potassium availability in selected bran products: implications for the renal patient. Journal of Renal Nutrition 4, 27–31.
Patel, M.G. (1998) The effect of dietary intervention on weight gains after renal transplantation. Journal of Renal Nutrition 8 (3), 137–141.
Patel, M.G. and Raftery, M.J. (1997) Successful percutaneous endoscopic gastrostomy feeding in CAPD. Journal of Renal Nutrition 7 (4), 208–211.
Pederson, P.U. (2005) Nutritional care: the effectiveness of actively involving older patients. Journal of Clinical Nursing 14, 247–255.
Pedrini, M.T., Levey, A.S., Lau, J. et al. (1996) The effect of protein restriction on the progression of diabetic and nondiabetic renal disease: a meta-analysis. Annals of Internal Medicine 124, 629–632.
Pender, F.T. (1989) The effect of increasing the dietary fibre content of diets of patients with chronic renal failure treated by haemodialysis at home. Journal of Human Nutrition and Dietetics 2, 423–427.
Pugh, P., Watson, A.R. (2006) Transition from gastrostomy to oral feeding following renal transplantation. Advances in Peritoneal Dialysis 22, 153–157.
Ramirez, G., Chen, M., Boyce, W. et al. (1986) Longitudinal follow up of chronic haemodialysis patients without vitamin supplementation. Kidney International 30, 99–106.
Rees, L. and Shaw, V. (2007) Nutrition in children with CRF on dialysis. Pediatric Nephrology 22, 1689–1702.
Robertson, L.M., Waugh, N. and Robertson, A. (2007) Protein restriction for diabetic renal disease. Cochrane Database of Systematic Reviews 4: CD002181.
Rocco, M.V. and Makoff, R. (1997) Appropriate vitamin therapy for dialysis patients. Seminars in Dialysis 10, 272–277.
Roubenoff, R., Heymsfield, S.B., Kehayias, J.J. et al. (1997) Standardization of nomenclature of body composition in weight loss. American Journal of Clinical Nutrition 66, 192–196.
Royal College of Physicians (2002) Glucocorticoid Induced Osteoporosis; A Concise Guide to Prevention and Treatment, http://bookshop.rcplondon.ac.uk/contents/pub89-64206b70-b147-4976-9ee1-bf4948458468.pdf (accessed 20 May 2013).
Sayce, H.A., Rowe, P.A. and McGonigle, R.J.S. (2000) PEG feeding in HD out-patients. Journal of Human Nutrition and Dietetics 13, 333–341.
Sexton, J. and Vincent, M. (2004) Remedying calcium and phosphate problems in chronic kidney disease. The Pharmaceutical Journal 274, 561–564.
Sherman, R.A., Cody, R.P., Rogers, M.E. et al. (1995) Interdialytic weight gain and nutritional parameters in chronic dialysis patients. American Journal of Kidney Diseases 25, 579–583.
Sigrist, M.K., Levin, A. and Tejan, A.M. (2010) Systematic review of evidence for the use of intradialytic parenteral nutrition in malnourished haemodialysis patients. Journal of Renal Nutrition 20 (1), 1–17.
Spiegel, D.M., Anderson, M., Campbell, U. et al. (1993) Serum albumin: a marker for morbidity in peritoneal dialysis patients. American Journal of Kidney Diseases 21, 26–30.
Steddon, S. and Sharples, E. (2010) Renal Association Guidelines CKD Mineral and Bone Disorders, www.renal.org/Clinical/GuidelinesSection/CKD-MBD.aspx (accessed 20 May 2013).
Steiber, A.L. and Kopple, J.D. (2011) Vitamin status and needs for people with stages 3–5 chronic kidney disease. Journal of Renal Nutrition 21 (5), 355–368.
Stenvinkel, P. (2003) Interactions between inflammation, oxidative stress, and endothelial dysfunction in end-stage renal disease. Journal of Renal Nutrition 13, 144–148.
Stenvinkel, P., Heimburger, O., Paultre, F. et al. (1999) Strong association between malnutrition, inflammation, and atherosclerosis in chronic renal failure. Kidney International 55, 1899–1911.
Stratton, R.J., Bircher, G., Fouque, D. et al. (2005) Multinutrient oral supplements and tube feeding in maintenance dialysis: a systematic review and meta-analysis. American Journal of Kidney Diseases 46 (3), 387–405.
Stratton, R.J., Green, C.J. and Elia, M. (2003) Disease Related Malnutrition: An Evidence Based Approach, CABI International, Wallingford.
Suetta, C., Magnusson, S.P., Rosted, A. et al. (2004) Resistance training in the early postoperative phase reduces hospitalization and leads to muscle hypertrophy in elderly hip surgery patients – a controlled, randomized study. Journal of the American Geriatrics Society 52, 2016–2022.
Tan, C.C., Harden, P.N., Rodger, R.S.C. et al. (1996) Ranatidine reduces phosphate binding in dialysis patients receiving calcium carbonate. Nephrology, Dialysis, Transplantation 11, 851–853.
Taylor, G.S., Patel, V., Spencer, S. et al. (2002) Long-term use of 1.1% amino acid dialysis solution in hypoalbuminemic continuous ambulatory peritoneal dialysis patients. Clinical Nephrology 58, 445–450.
Tjiong, H.L., van den Berg, J.W., Wattimena, J.L. et al. (2005) Dialysate as food: combined amino acid and glucose dialysate improves protein anabolism in renal failure patients on automated peritoneal dialysis. Journal of the American Society of Nephrology 16, 1486–1493.
Todorovic, V.E. and Micklewright, A. (2007) A Pocket Guide to Clinical Nutrition, British Dietetic Association, Nottingham.
Tonelli, M., Webbe, N., Hemmelgarn, B. et al. (2009) Trace Elements in Haemodialysis Patients: A Systematic Review and Meta-Analysis, http://biomedcentral.com/1741-7015/7/25 (accessed 20 May 2013).
UK Prospective Diabetes Study (UKPDS) (1998) Intensive blood-glucose control with sulphonylureas or insulin compared with conventional treatment and risk of complications in patients with type 2 diabetes (UKPDS 33). Lancet 352, 837–853.
Vennegoor, M. (ed.) (1992) Enjoying Food on a Renal Diet, King Edward’s Fund for London, London.
Visser, M., Deeg, D.J. and Lips, P. (2003) Low vitamin D and high parathyroid hormone levels as determinants of loss of muscle strength and muscle mass (sarcopenia): the Longitudinal Aging Study, Amsterdam. Journal of Clinical Endocrinology and Metabolism 88 (12), 5766–5772.
Visser, R., Dekker, F.W., Boeschoten, E.W. et al. (1999) Reliability of the 7-point subjective global assessment scale in assessing nutritional status of dialysis patients. Advances in Peritoneal Dialysis 15, 222–225.
Von Schnakenburg, C., Feneburg, R., Plank, C. et al. (2006) Percutaneous endosopic gastrostomy in children on PD. Peritoneal Dialysis International 26 (1), 69–77.
Walters, B.A., Hays, R.D., Spritzer, K.L. et al. (2002) Health related quality of life, depressive symptoms and malnutrition at start of hemodialysis initiation. American Journal of Kidney Diseases 40 (6), 1185–1194.
Watson, A.R. (1995) Strategies to support families of children with end-stage renal failure. Paediatric Nephrology 9, 628–631.
Wolk, R. (1993) Micronutrition in dialysis. Nutrition in Clinical Practice 8, 267–276.
Woodrow, G. and Davies, S. (2010) Renal Association Guidelines: Peritoneal Dialysis, www.renal.org/Clinical/GuidelinesSection/PeritonealDialysis.aspx (accessed 20 May 2013).
Wright, M. and Jones, C. (2010) Renal Association Guidelines: Nutrition in CKD, www.renal.org/Clinical/GuidelinesSection/Guidelines.aspx (accessed 20 May 2013).
Yale, J.F. (2005) Oral antihyperglycaemic agents and renal disease: new agents new concepts. Journal of the American Society of Nephrology 16 (suppl. 1), S7–10.
Yokum, D., Glass, G., Cheung, C.F. et al. (2008) Evaluation of a phosphate management protocol to achieve optimum serum phosphate levels in hemodialysis patients. Journal of Renal Nutrition 18 (6), 521–529.
Useful web sites
Stay updated, free articles. Join our Telegram channel

Full access? Get Clinical Tree


