CHAPTER 7 Questions about diagnosis
examples of appraisals from different health professions
This chapter is an accompaniment to the previous chapter (Chapter 6) where the steps involved in answering a clinical question about diagnosis were explained. In order to further help you learn how to appraise the evidence for this type of question, this chapter contains a number of worked examples of questions about diagnosis from a range of health professions. The worked examples in this chapter follow the same format as the examples that are in Chapter 5. In addition, as with the worked examples that were written for Chapter 5, the authors of the worked examples in this chapter were asked not to choose a systematic review, but to instead find the next best available level of evidence to answer the clinical question that is in the worked example. This was done for the same reason that was given in Chapter 5—it is easier to learn how to appraise a systematic review of test accuracy studies if you have first learnt how to appraise a study about test accuracy. Chapter 12 will help you to learn how to appraise a systematic review.
Occupational therapy example
Clinical scenario
Search terms and databases used to find the evidence
Database: PubMed—Clinical Queries (with ‘diagnosis category’ and ‘narrow search’ selected)
Search terms: (The Motor Performance Checklist)
Article chosen
Gwynne K, Blick B. Motor performance checklist for 5-year-olds: a tool for identifying children at risk of developmental co-ordination disorder. J Paediatr Child Health 2004; 40:369–373.
Is the evidence likely to be biased?
What are the main results?
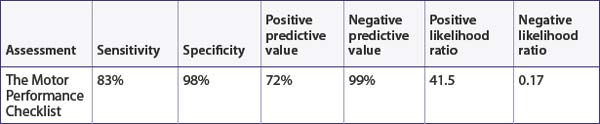
In this study, 6 (4.2%) children were identified by the Bruininks-Oseretsky Test of Motor Proficiency as having developmental coordination disorder. This study presents the sensitivity, specificity, predictive values and likelihood ratios for identifying developmental coordination disorder using the Motor Performance Checklist (see Table 7.1) compared with the Bruininks-Oseretsky Test of Motor Proficiency Long Form using a cut-off score of 40 points.
How might we use this evidence to inform practice?
Although this study may be prone to some types of bias that are common in cross-sectional studies it was otherwise well-designed and you are reasonably confident about the results. There are three factors about this study to think about, though. First, the ability of The Motor Performance Checklist to identify children with developmental coordination disorder was restricted in this study to children who were 5 years old. Testing this measure with children from 4 to 10 years is needed as this is the age range that this assessment was designed to be used with. Second, the study reports a low prevalence of developmental coordination disorder and the authors state this is lower than reported in the literature. This means that, in populations with a higher prevalence of developmental coordination disorder, the positive predictive value (or the chance of the test being correct) will be greater than reported in this study. Finally, the brevity of this measure is appealing and the article also reports on the concurrent validity and reliability of this measure, which are other psychometric test properties that must be considered when considering using an assessment with clients. You think back to your original dilemma. Can you use The Motor Performance Checklist for identifying children with developmental coordination disorder? The results of this study are limited to children 5 years of age so, until further research is done that involves children of other ages, it may have limited, yet useful, value to your clinical practice.
Physiotherapy example
Clinical scenario
Search terms and databases used to find the evidence
Database: PubMed—Clinical Queries (with ‘diagnosis category’ and ‘narrow search’ selected)
Search terms: posteroinferior (labral OR labrum)
Article chosen
Kim S, Park J, Jeong W et al. The Kim test: a novel test for posteroinferior labral lesion of the shoulder—a comparison to the jerk test. Am J Sports Med 2005; 33:1188–1192.
Structured abstract
Setting: Department of Orthopaedic Surgery at a hospital in Korea.
Diagnostic standard: Arthroscopic examination of the glenohumeral joint and subacromial space.
Is the evidence likely to be biased?
Yes. All participants received the diagnostic tests of interest and the reference standard.
What are the main results?
Thirty (17%) of the 172 participants had a posteroinferior labral lesion. The article presents the sensitivity, specificity, positive predictive value and negative predictive value of the two tests, which are shown in Table 7.2. You also use these results to calculate the positive and negative likelihood ratios (see Table 7.2).
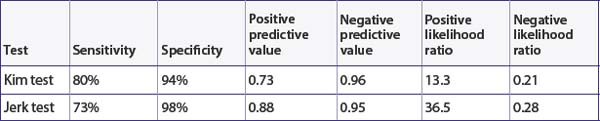
The positive predictive value of the Kim test indicates that, on average, 73% of people with a positive test result actually have a posteroinferior labral lesion. The positive predictive value of the jerk test indicates that, on average, 88% of people with a positive result actually have a posteroinferior labral lesion. Using the approximate guide values that were presented in Chapter 6, as both of the positive likelihood ratios are over 10, this indicates that these tests are very helpful for ruling in a posteroinferior labral lesion if it is present. Also, as the negative likelihood ratios are <0.5, this suggests that these tests are moderately helpful in ruling out a posteroinferior labral lesion.
Podiatry example
Stay updated, free articles. Join our Telegram channel

Full access? Get Clinical Tree


