Chapter 3 Measuring health
Overview
We have seen in Chapter 1 how people define health in different ways and in Chapter 2 how there are different determinants of health. This would suggest that measuring health is not a simple task. This appears to be borne out by the existence of a number of ways of measuring health and a lack of clear agreement about which are the best ways to measure health and which sources of information are most useful. This chapter looks first at why we might want to measure health. It goes on to investigate the different means of measuring health currently in use and unpacks some of the assumptions underlying their use. Finally, the uses of the different kinds of measures are explored. The practical uses of measuring health are discussed further in Chapters 18 and 19 on needs assessment and programme planning, and in Chapter 20 on evaluation.
Why measure health?
Ways of measuring health
 BOX 3.1
It is likely that you included:
Community health workers who profile their communities have many different ways of building a picture of their area. Some of these are described in Chapter 18 on needs assessment. In this chapter we look at sources of information available to describe a community’s health. A great deal of information is available online. For example, in the UK you can find out about your local area by visiting http://neighbourhood.statistics.gov.uk and, for those living in Scotland, www.gro-scotland.gov.uk/statistics.
Measuring health as a negative variable (e.g. health is not being diseased or ill)
Epidemiology is the study of the occurrence and spread of diseases in the population. It is concerned with the health status (or, more usually, the ill-health status) of populations. Health promoters use epidemiological evidence to identify health problems, at-risk groups and the effectiveness of preventive measures. The most common means of assessing a population’s health are through mortality and morbidity rates. This reflects the reductionist model of health which sees health as a simple matter of illness or its absence. Thus data on deaths and illnesses are often used as surrogate measures of health. There are clearly shortcomings to this approach. Measuring conditions which limit health, such as illness, is not the same as measuring health itself. Measuring mortality rates does not reflect the extent of illness in the population, nor does it say anything about the quality of health experienced by people when they were alive. Conditions such as arthritis or schizophrenia cause considerable suffering and pain but do not lead to premature death and so are not reflected in mortality rates.
 BOX 3.2
 BOX 3.3
 BOX 3.4
Mortality statistics
There are several different ways of expressing death rates. The crude death rate is the number of deaths per 1000 people per year. However, this figure is affected by the age structure of the population, which may vary over time and region. An area with a high proportion of older people, such as a south-coast retirement town, would have consistently higher death rates than a more deprived area with a higher percentage of premature deaths, such as an inner-city area. The standardized mortality ratio (SMR) measures the death rate, taking into account differences in age structure. It is the number of deaths experienced within a population group (which may be defined by geographic or socioeconomic factors) compared to what would be expected for this group if national averages applied, taking age differences into account. The overall average for England and Wales is 100, so SMRs of below 100 indicate a lower than average mortality rate, whereas SMRs of more than 100 indicate higher than average mortality rates.
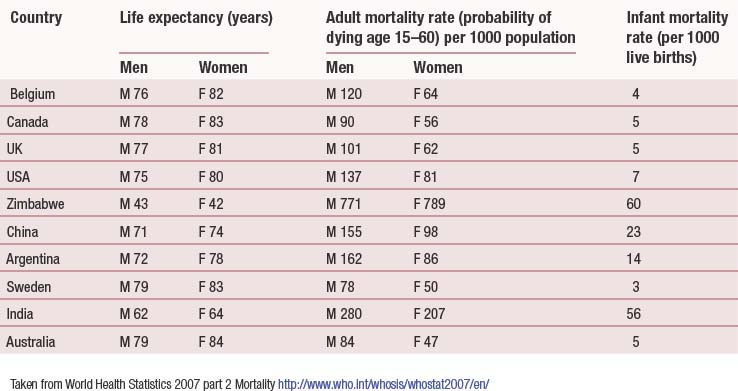
The infant mortality rate (IMR) is another commonly used statistic. The IMR is the number of deaths in the first year of life per 1000 live births. The IMR is strongly associated with adult mortality rates. It reflects maternal health, particularly nutrition, and the provision of social care and child welfare. The IMR is therefore capable of being used as an indicator of the general health of the population, particularly when comparisons between countries are being drawn. The perinatal mortality rate (PMR) is the number of stillbirths and deaths in the first 7 days after birth per 1000 births. The neonatal death rate is the number of deaths occurring in the first 28 days after birth per 1000 live births. Both the SMR and the IMR are readily available statistics, and therefore easy to use as surrogate measures of health. Table 3.1 (p. 39) compares key health indicators for different countries worldwide.
 BOX 3.5
Death rates are also available broken down by gender, social class and cause. In the UK, it is well established that death rates are related to social class and gender (Department of Health 2005; Lantz et al 2001; Townsend et al 1998). People in the lower social classes have higher than average death rates at all ages and for virtually all causes. These social class differences show no sign of diminishing. Indeed, social class inequalities in IMRs and life expectancy continue to grow, although there are some signs of progress, e.g. in child poverty and housing indicators (Department of Health 2005). It may well take some time for any strategies currently being implemented to have an impact on mortality indicators. Women in developed countries live longer on average than men, so their premature death rate is lower than that of men. This is discussed in greater detail in Chapter 2.
 BOX 3.6
Morbidity statistics
Statistics measuring illness and disease are more difficult to obtain. This is due in part to the difficulty in establishing a hard and fast line between health and disease. There is no one source of data for the whole population concerning disease and illness. Instead, there are a number of different sources of relevant information. These are summarized below.
 BOX 3.7
Sources of health information in the UK
These sources of data may be accessed from public health departments, hospital-based data sets, the Health Protection Agency, primary care consultation rates, local delivery plans, local surveys and the Office for National Statistics. Useful websites include: www.statistics.gov.uk (Office for National Statistics); www.hpa.org.uk (Health Protection Agency); www.apho.org.uk (Association of Public Health Observatories); www.rcgp.org.uk (Royal College of General Practitioners); and www.hse.gov.uk (Health and Safety Executive).
Morbidity
Demographic data
The health services collect routine data on the use of their services and activity rate. These data can be used to express the disease experience of different populations but there are several problems with adopting this approach. The main problem with using many of the health authority measurements is that they were developed primarily for administrative, planning or management tasks, and reflect available services and use of these services rather than health itself. Health authority data are primarily collected as a management tool. To some extent, this determines what data are collected. Routinely available morbidity data represent only the tip of the illness iceberg. Many people who are ill do not seek help from primary care services or hospitals. However, the advantage of using data of this kind is that they are routinely collected, are consistent across regions and are easily accessed.
 BOX 3.8


