16
Measures of central tendency and variability
Measures of central tendency
When the data are nominal (i.e. categories), the appropriate measure of central tendency is the mode. The mode is the most frequently occurring score or category in a distribution. Therefore, for the data shown in Table 16.1 the mode is the ‘females’ category. The mode can be obtained by inspection of grouped data (with the largest group being the mode). As we shall see later, the mode can also be calculated for continuous data as well as discrete data.
The median
With ordinal, interval or ratio scaled data, central tendency can also be represented by the median. The median (Mdn) is the score that divides the distribution into half: half of the scores fall under the median, and half above the median. That is, if scores are arranged in an ordered array from say highest to lowest or vice versa, the median would be the middle score. With a large number of cases and scores, it may not be feasible to locate the middle score simply by inspection. To calculate which is the middle score, we can use the formula (n + 1)/2, where n is the total number of cases in a sample. This formula gives us the number of the middle score. We can then count that number from either end of an ordered array.
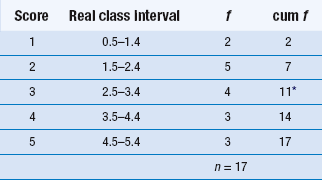
For a grouped frequency distribution, the calculation of the median is a little more complicated. If we assume that the variable is continuous (e.g. time, height, weight or level of pain), we can use a formula for calculating the median. This formula (explained in detail below) can be applied to ordinal data, provided that the variable being measured has an underlying continuity. For example, in a study of the measurement of pain reports we obtain the following data, where n = 17:
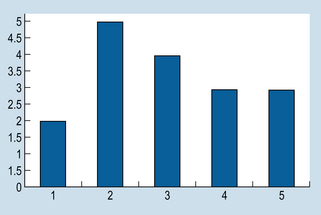
These data can be represented by a bar graph (Fig. 16.1).
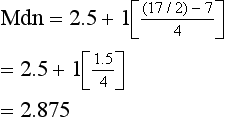
Here we can obtain the mode simply by inspection. The mode = 2 (the most frequent score). For the median, we need the ninth score, as this will divide the distribution into two equal halves (see Table 16.1). By inspection, we can see that the median will fall into category 3. Assuming underlying continuity of the variable and applying the previously discussed formula, we have:
where XL = real lower limit of the class interval containing the median, i = width of the class interval, n = number of cases, cum fL = cumulative frequency at the real lower limit of the interval and fi = frequency of cases in the interval containing the median.
Substituting into the above equation:
The mean
where Σx = the sum of the scores,  = the mean of a sample, µ = the mean of a population, x = the values of the variable, that is the different elements in a sample or population, and n or N = the number of scores in a sample or population.
The formula simply summarizes the following ‘advice’:
Stay updated, free articles. Join our Telegram channel

Full access? Get Clinical Tree


 or µ, is defined as the sum of all the scores divided by the number of scores. The mean is, in fact, the arithmetic average for a distribution. The mean is calculated by the following equations:

 ), add together all the scores (Σx) and divide by the number of cases (n).