Expanding horizons: developing a public health perspective in midwifery


Expanding horizons: developing a public health perspective in midwifery


Cindy Carlson


INTRODUCTION


This chapter explores what public health actually means and its relevance to midwifery practice. Initially it considers definitions of public health that are common currency and attempts to unpick these, while also providing a historical perspective. From there, attention is given to part of the ‘science’ of public health, essential epidemiological terms that are of relevance to the understanding of the place of midwifery in improving population health. The definition of public health is then further refined by looking at what competencies or standard areas are used in different countries for describing what public health professionals need to be able to do. These are compared with midwifery competencies to examine how much public health practice is already integrated into the work of midwives, and key elements are explored in greater depth to consider the specific public health functions midwives might perform and the skills they need to do so.


UNDERSTANDING PUBLIC HEALTH


‘Public health’ is one of those terms that sometimes defies definition, and as such then takes on an aura of mystique, where practitioners are those initiated into the secret rites of the cult. The definitions put forward in recent years do not seem to do much to demystify what public health actually is. One of the more widely spread definitions of public health is: ‘the science and art of presenting disease, prolonging life and promoting health through the organised efforts of society’ (Acheson 1988). The US government defines public health as ‘what we, as a society, do collectively to assure the conditions in which people can be healthy’ (Centers for Disease Control 1999). These definitions, when unpicked, show ‘public health’ to be all those activities aimed at securing and promoting the health of a population that are the collective responsibility of some social organisation, for example the state or government. Our understanding of public health becomes clearer when we explore what types of functions or activities are covered under the rubric of public health, as we will see below.


Public health came into its own in the nineteenth century, when European and North American countries were undergoing rapid industrialisation, which brought with it both great wealth and great misery. Social reformers concerned themselves with the conditions of both workers and the destitute, and began to look at how to make changes in people’s social, economic and environmental conditions as part of improving living conditions and well-being overall. Primary amongst these reformers was Edwin Chadwick, Secretary to the Poor Law Commission, whose Report on an Enquiry into the Sanitary Condition of the Labouring Population of Great Britain (Chadwick 1843) galvanised the social conscience of the middle classes of the day, and led to eventual changes in law to the advantage of those living in poverty. John Snow’s powers of observation during a cholera epidemic in London in 1848 led to the first technical health protection intervention – the removal of the Broad Street pump from the source of cholera-contaminated water. Public health activists throughout the nineteenth century focused primarily on social and environmental conditions that impacted on health, and paved the way to major improvement in population health more generally through a reduction in infectious diseases. During most of the 1800s health care workers had little idea of what actually caused the diseases they were treating, as Box 3.1 illustrates. (Most continued to operate under the ‘miasma’ theory, that ‘bad’ air and ‘bad’ water were to blame – not completely without reason.)


Box 3.1   Example – health protection in childbirth


Ignaz Semmelweis was a Viennese obstetrician in the 1800s, who developed a keen interest in trying to explain, and then reduce, puerperal fever among patients in his maternity hospital. The hospital had been divided into two wards to help improve the quality of training for health care professionals. One ward was attended to only by (all male) medical students while the other ward was attended by midwives. The medical student ward records showed consistently higher rates of puerperal fever than the midwives’ ward, which excited Semmelweis’s interest even more. On investigating practices in both wards, he observed that puerperal fever appeared to spread from bed to bed only on the medical student ward. After the unfortunate death of one of the pathology professors from a fever whose symptoms were very similar to puerperal fever (having been stuck by a student’s autopsy knife), Semmelweis began to suspect that puerperal fever might be transmitted by the medical students themselves. On closer investigation he observed that medical students would go directly from the autopsy room in the mornings to ward rounds and examine all women in labour, with no hygienic precautions taken. Handwashing was unheard of in hospitals but Semmelweis instituted a regime whereby medical students had to wash their hands in chlorinated lime solution. This intervention led to a dramatic decline in morbidity and mortality by puerperal fever on the medical students’ ward. Sadly the other doctors in the hospital ridiculed Semmelweis’s ideas and he eventually went mad.


It was only towards the end of the nineteenth century with the invention of the microscope and the identification of the first bacteria that ‘germ theory’ was born and action began to shift away from improving living conditions to developing medicines to prevent and treat diseases. ‘Miasmists’ aligned themselves with social radicals who continued to push for social reform as the best way to improve health and living conditions. ‘Contagionists’ were more politically conservative and pushed for medical solutions to health problems (Young 1999).


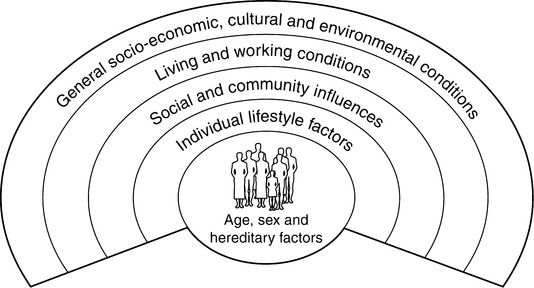
Public health may also be understood through an analysis of the determinants of health. Several models of health determinants have been put forward. One of the most commonly used is shown here in Figure 3.1, developed by Dahlgren and Whitehead in 1991.


The factors influencing health are multiple and multi-level, as indicated by Figure 3.1. While individual factors, such as age, gender and genetic make-up create a predisposition to good or poor health, wider determinants of health have been shown to be as, or more, important in dictating an individual’s or community’s health status. The UK House of Commons Select Committee Report (2000) provides greater detail of the wider determinants, taken from the Public Health Green Paper Reducing Health Inequalities: An Action Report:


Fixed: Genes, sex, ageing
Social and Economic: Poverty, employment, social exclusion
Environment: Air quality, housing, water quality, social environment
Lifestyle: Diet, physical activity, smoking, alcohol, sexual behaviour, drugs
Access to services: Education, National Health Service, social services, transport, leisure


Today, depending on the country, social policy dictates what determinants of health governments will and will not intervene in for protecting and improving the health of their populations. Health care is a major feature of public health policy and can absorb a large part of a country’s health-related resources. Environmental health protection remains an important public health function, though in countries such as England, where the public health function sits within the National Health Service and environmental health sits with local governments, there have been structural barriers to a unified approach to protecting the public’s health. Other traditional local government public health functions include such areas as support to families, community development and urban regeneration.


Midwives have an honourable tradition themselves in the public health arena. The health promotion work training women in ‘mothering skills’ carried out by midwives and health visitors in the first half of the twentieth century helped lead to a radical drop in infant mortality rates, from 150 per 1000 in 1900 to 55 per 1000 in 1940 (Williams et al 1994).


MEASURING MATERNAL HEALTH


One important area of public health is being able to assess the degree of a particular problem by measuring its extent in a population. The main aspect of a midwife’s role is ensuring a positive outcome to pregnancy, measured through the health of mothers and their infants. Throughout the world numerous initiatives have been developed to tackle the problem of poor pregnancy outcomes and high infant death rates. In the 1960s the World Health Organization (WHO) reported its concerns about the much higher rates of mother and child mortality in developing countries. Its 1969 Expert Committee Report found that high mortality in both mothers and their children were caused mainly by poor nutrition and widespread infection, as well as dangerous and excessive childbearing related to poor access to health services (WHO 1992).


Sadly, little has changed since the Expert Committee first published its report thirty-plus years ago. Maternal and infant mortality rates remain unacceptably high in many developing countries, as well as within more socially excluded groups in developed countries. Before looking at the figures, it is worth spending some time reviewing definitions of mortality (death) and morbidity (illness) related to maternal health. The focus is primarily on mortality, perhaps a strange indicator of ‘health’. Mortality is most often used for understanding the health of populations because there is no ambiguity about death, though there may be a great deal of controversy over the cause of death. In general death rates are seen as a useful way of measuring health status within populations and comparing these across populations. In public health, various measures of mortality and morbidity are used to describe what is happening in that population. A few of these are given here.


Age-specific death rate


the number of deaths in a specific age groupthe total population of that age group at the midpoint of the year×1000


image


Rates of disease can be measured in similar ways, by creating disease-specific rates for the whole population or within specific age groups. When measuring disease there are two key rates to understand: incidence and prevalence.


Incidence is the number of new cases of an ‘event’ or disease in a population, within a defined population. To determine the incidence rate the number of new cases is divided by the total population at risk of having this disease. For example, when calculating the incidence rate of eclampsia in a population, the numerator would be the number of new cases of eclampsia reported, divided by the total number of women of reproductive age (15 to 49) within the population. This is because only pregnant women can develop eclampsia. A more accurate denominator would be the total number of women who become pregnant within that particular year, but this may be harder to determine.


Prevalence is the number of existing cases of an ‘event’ or disease within a defined population. As with incidence rate, the prevalence rate is determined by counting the number of people with a particular condition, divided by the total population at risk for developing that condition within a population. Point prevalence is a measure of the number of people with the condition at a specific ‘point’ in time (e.g. 1 July), while period prevalence is a measure of the number of people with the condition in a given time period.


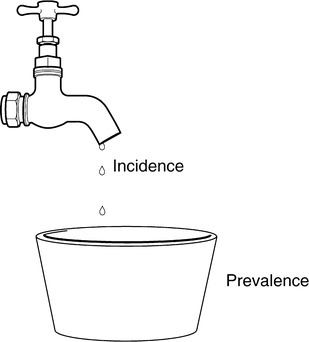
The difference between incidence and prevalence can be understood as follows: incidence is about ‘becoming’ while prevalence is about ‘being’ (see Fig. 3.2). An example of this, when discussing pregnancy, is that the incidence of pregnancy = the number of women who become pregnant during a specific time period vs the number of women who are pregnant during a specific time period. Women who already are pregnant would not be included in the denominator for the incidence rate; they are not at risk of becoming pregnant since they already are pregnant!


A maternal death can be defined as: ‘the death of a woman while pregnant or within 42 days of termination of pregnancy, regardless of the site or duration of pregnancy, from any cause related to or aggravated by the pregnancy or its management’ (WHO 1999:9). This same WHO document goes on to identify two main types of maternal death: direct or indirect obstetric death. Direct obstetric death is any death arising from complications of pregnancy, labour or the postpartum period, usually due to haemorrhage, sepsis, eclampsia, obstructed labour or the complications of unsafe abortion. Other causes of direct obstetric death include dangerous obstetric interventions, omissions or incorrect treatment (WHO 1999). Indirect obstetric deaths result from pre-existing conditions, or conditions that arise as a result of the pregnancy (e.g. diabetes, malaria, HIV/AIDS, cardio-vascular disease).


There are three measures of maternal mortality that are most commonly used when trying to understand maternal death within a given population. These are maternal mortality ratio, maternal mortality rate, and lifetime risk of maternal death.


Lifetime risk of maternal death


Lifetime risk of maternal death is estimated by multiplying the maternal mortality rate by the length of the reproductive period (average around 35 years). This allows planners to review both the probability of becoming pregnant and the probability of dying as a result of pregnancy, cumulated across a woman’s reproductive years. Another way of calculating the lifetime risk of maternal death is by multiplying the total fertility rate by the maternal mortality rate. The total fertility rate can be calculated by taking the sum of the age-specific fertility rates for women of child-bearing age (15-49), as explained in Box 3.2.


Box 3.2   Fertility rates and mortality rates/ratios: calculation


Age-specific fertility rate is the number of live births in women in a specific age group divided by all women in that same age group, multiplied by 1000. In the US in 1993, the age-specific fertility rates for women of all races were:


15–19: 60.7/1000
20–24: 114.6/1000
25–29: 117.4/1000
30–34: 80.2/1000
35–39: 32.5/1000
40–44: 5.9/1000
45–49: 0.3/1000


This information in itself provides useful facts about what is happening with births in a population. In order to calculate the total fertility rate (TFR), you take the sum of these rates, which comes to 411.6/1000. This then is multiplied by 5 (because each age band represents 5 years) to 2,058 births/1000 women, or 2.06 births per woman. The TFR therefore provides us with a snapshot of the average number of births per woman we can expect to see in a specific population. The TFR in many European countries is less than 2, while in some developing countries it is as high as 7 or more.


The maternal mortality ratio for this would be calculated as 2,200 maternal deaths divided by 17,480,250 live births multiplied by 100,000, which comes to 12.6 deaths per 100,000 live births. In most developed countries the maternal mortality ratio is around 27 maternal deaths per 100,000 live births. In developing countries the ratio is far higher, at 480 maternal deaths per 100,000 live births.


To take this example further, if the maternal mortality rate is calculated (hypothetically) as 2,200 maternal deaths in 1993 divided by 43,750,000 women of reproductive age in 1993 × 100,000, the result is a maternal mortality rate of 5 maternal deaths per 100,000 women of reproductive age. This is an average maternal mortality rate for a developed country. In many developing countries the maternal mortality rate can be 100 deaths (or more) per 100,000 women.


Finally, then, to calculate the lifetime risk of maternal death, you need to multiply the maternal mortality rate (5/100,000) by the number of reproductive years (35) to get a 0.17% lifetime risk of maternal death. In developing countries, with their far higher maternal mortality rate, the lifetime risk of dying, using the above figures, would be a 3.5% lifetime risk of maternal death.


Adapted from: Young (1999) and WHO (1999)


There are numerous direct causes of maternal death, and these too differ between developed and developing countries. The pie charts (Figs 3.3 and 3.4) illustrate the main direct causes of maternal death, comparing the global picture and the UK.

Only gold members can continue reading. Log In or Register to continue

Stay updated, free articles. Join our Telegram channel

Jun 18, 2016 | Posted by in MIDWIFERY | Comments Off on Expanding horizons: developing a public health perspective in midwifery

Full access? Get Clinical Tree

Get Clinical Tree app for offline access