Chapter Four. Epidemiology and its application to practice
John Watkins
Introduction
From primitive times man has sought to elucidate the causation of human disease. There is evidence that even in prehistoric communities, elders were selected as ‘medicine men’ and practised a primitive form of medicine based on tribal belief and folk law, much of which developed into a symbiotic relationship between man and his environment. Even today the aboriginal tribes that persist across the world demonstrate this deep understanding of the living world and their place within it. For example, the indigenous peoples of Australasia survived for thousands of years, before the invasion of modern man, with no written language yet passed down from one generation to the next the beneficial and medicinal properties of the foliage and fauna in their environment. One can only speculate that the origin of what was later to become modern therapeutics was arrived at by much trial and error, with some successes but a considerable amount of failure and death. In parallel to the discovery of effective agents, much disease and treatment benefit over time has been ascribed to either divine intervention or false claims of effectiveness, due to the lack of understanding of the natural course of diseases.
For much of history, man has had to be content with observing and monitoring disease with little understanding of either the aetiology or biological processes afoot and no understanding of the best course of treatment, other than the empirical knowledge handed down from one generation to the next.
Outlined in this chapter are the basic principles and broad areas of endeavour that represent the science of epidemiology, by which light can be shone on the darkness of folklore and misunderstanding. During the last 100 years the methodological tools of epidemiology have been developed and have become a powerful way of elucidating the aetiology and causation of disease, its early detection and a means by which treatment effectiveness can be evaluated.
In this chapter we will briefly look at the origins of the modern science that is epidemiology, how it is used to monitor disease, investigate causation and evaluate treatment effectiveness. Along the way we will illustrate this process by highlighting success and indicate how epidemiology should be embraced as a basic and necessary science for the practice of healthcare.
Causation of disease
The greatest minds of history have contemplated the aetiology, causation and treatment of disease. Hippocrates writing in 400 BC accepted that ‘the science of medicine makes use of principles which can be of real assistance … but it would not be fair to expect medicine to attempt cures that are all but impossible nor be unfailing in its remedies’ (Chadwick and Mann 1950). Implicit in this statement is that even 2500 years ago there was the realization that there was a limit to one’s knowledge of disease, not all treatments were effective in all people at all times, and those that were to be used needed to undergo some scientific process of evaluation.
It is true today, as it was in the time of Hippocrates, that the overwhelming cause of death is infectious disease, and it is only in the developed world that diseases of degeneration and ageing have become dominant. This led Robert Koch and Friedrich Loeffler to develop in 1884 a set of criteria, later known as Koch’s postulates (Box 4.1) for infectious disease aetiology (Grimes 2006).
Box 4.1
Koch’s postulates
1. The suspected causal organism must be constantly associated with the disease.
2. The suspected causal organism must be isolated from an infected organism and grown in pure culture.
3. When a healthy susceptible host is inoculated with the pathogen from pure culture, symptoms of the original disease should develop.
4. The same pathogen must be re-isolated from organisms infected under experimental conditions.
Epidemiology is a science that is interested in the cause, occurrence, distribution, natural history and treatment of disease. Some 30 years before Koch produced his seminal work, John Snow in 1854 demonstrated these principles. During August and September 1854 London experienced a severe epidemic of cholera resulting in nearly 100 deaths. Snow found that by mapping the place of residence of the deaths that had occurred during this period, he was able to identify that the hand water pump in Broad Street was at the epicentre of the deaths and likely to be related in a causal way. His action in getting the local authorities to remove the handle on the water pump resulted in a curtailment of the epidemic and saved many lives. This event is often hailed as one of the first triumphs of modern epidemiology with its impact on public health policy (Johnson 2007).
Then, as now, Koch’s postulates were never seen as absolutes in that many infectious agents can be present in humans without causing disease, e.g. polio and HIV viruses, in violation of Koch’s first postulate. Similarly his third postulate recognizes the fact that many organisms experimentally inoculated with an infectious agent do not necessarily develop disease; the lack of disease in many of the residents of Broad Street in 1854 would support this, as not all residents exposed to infected water succumbed to cholera.
One of the founding fathers of modern medical statistics, Sir Austin Bradford Hill, in his Presidential address to the Royal Society of Medicine in 1965 addressed the issue of causation of disease from the perspective of occupational exposure; however, the tenet of his talk is just as relevant for wider discussions of causality (Hill 1965). Starting from the point of view that cause must precede effect if there is in fact a causal relationship between an agent and a disease, Bradford Hill suggested a number of factors that need to be taken into account in order to judge whether any such association was likely to be causal (Box 4.2).
Box 4.2
Aspects of an association between an agent and a disease that help in deciding if the association is in fact causal
1. Strength of the association
2. Consistency
3. Specificity
4. Temporality
5. Biological gradient
6. Plausibility
7. Coherence
8. Experiment
9. Analogy
Using the example of cigarette smoking and its association with lung cancer, which will be discussed in more detail later in this chapter, it is well known today that this association is causal. If we apply the criteria in Box 4.2 to this agent/disease combination we are able to see how we might gain confidence in the conclusion that there does in fact exist a causal chain at work.
The strength of an association between factors and a disease manifests itself if the disease occurs much more frequently, or exclusively, in those exposed. For example, in this case, heavy smokers have a significantly higher rate of lung cancer deaths than non-smokers.
Specificity relates to the relationship between the agent and the disease in question. Cigarette smoking is known to be associated with a number of serious common diseases, for example coronary heart disease which is also common, though less so, in non-smokers; however, carcinoma of the lung is by comparison almost exclusively related to exposure to tobacco smoke and this is more so for particular pathological types of the disease.
Temporality means that cause must proceed effect; in this case one must be exposed to cigarette smoke over many years before one develops the disease and similarly one’s risk diminishes over time after stopping smoking.
Biological gradient can be interpreted as an agent and disease displaying a dose–response relationship, i.e. those exposed the greatest develop the disease more commonly. This is true for smoking and lung cancer, where there is a steady gradation in the risks of developing the disease from non-smokers, through mild to moderate consumption, with heavy smokers, on average, having the greatest risk.
Coherence with known facts about the disease, its putative agent and evidence from other sources: Bradford Hill used the example of the temporal relationship between smoking rates in the population over time and the rise in deaths from lung cancer during the 20th century, reinforced by the differential rates of adoption of smoking by women in Britain, which was very much a post-war phenomenon, to illustrate this point. As women took up smoking in the second half of the 20th century, we saw a concomitant rise in deaths from lung cancer that mirrored the effects observed in males.
Experiment poses the question as to whether the effects can be replicated experimentally or in some quasi-experimental way. For cancer of the lung and cigarette smoking there is now enough accumulated evidence from the developed and developing world to show that as cigarette smoking increases in populations so does its health consequences, particularly lung cancer.
Analogy: one can ask is an association causal, from a plausibility point of view, i.e. does it make sense and are there analogies to be drawn with other agents and this disease? For example, cigarette smoke is inhaled and the organs that are most exposed to the agent are the air passages of the nasopharynx, bronchi and lungs; cancer of these tissues is strongly associated with cigarette smoking. We also know that inhalation of the radioactive gas radon during coal mining results in an increased rate of carcinoma of the lung; by analogy therefore it makes it easier to accept the biological plausibility that an inhaled carcinogen can cause lung disease.
Resting on the shoulders of giants, the modern edifice we call evidence-based practice can be broken down into a series of careful steps: disease surveillance, as epitomized initially by John Snow, hypothesis generation, again turning to Snow whose hypothesis was that an agent, cholera, was water-borne and related to the Broad Street pump, experimental intervention, removal of the pump handle, or as in Koch’s case, isolation of an organism and experimental infection of another to prove causality. In addition, Bradford Hill has given us the intellectual instruments by which to decipher the evidence gathered. In the next section we will look at the surveillance role of epidemiology before moving on to the methods by which epidemiological investigation is carried out.
Surveillance
Webster’s New World Medical Dictionary (2001) describes surveillance as ‘the ongoing systematic collection and analysis of data and the provision of information which leads to action being taken to prevent and control a disease, usually one of an infectious nature’. Worldwide, a considerable amount of time and effort goes into the collection, collation and interpretation of data on disease occurrence, by which healthcare organizations and nations can plan healthcare services and their response to emerging threats.
In most westernized democracies, surveillance systems exist to monitor infectious disease, particularly those that can be prevented by vaccination. For example, both the United Kingdom and the United States monitor the common diseases of childhood, measles, mumps and rubella, which are notifiable to public health bodies, the data from which are used to monitor disease control and vaccine effectiveness. In addition the World Health Organization (WHO) has a network of sentinel centres around the world for specific diseases. Influenza, a disease which has the potential to kill millions of people worldwide, as it did in 1918, is one example of international collaboration between states and institutions to monitor, collect, collate, identify and characterize disease in order to detect any emergent threat immediately.
Severe acute respiratory syndrome (SARS) is a respiratory disease in humans which is caused by the SARS coronavirus; between November 2002 and July 2003, 8096 individuals in 29 countries were infected with this virus and 774 deaths occurred (Vijayanand et al 2004). The initial disease, from a smouldering start in mainland China, where it had probably spread to humans from bats who are asymptomatic to the disease, either directly, or through civet cats, then spread first to Hong Kong and then across the developed world. After China, Canada and Singapore were the countries worst affected, and because of the nature of the disease, healthcare workers, in particular, in the early stages of the epidemic were very badly affected. This single event was a wake-up call to the developed world that new and emergent diseases still pose a significant threat to humankind and that eternal vigilance is required to quickly identify and contain disease. In the years following the SARS epidemic, there has been a realization that a greater threat to humankind may emerge from the highly pathogenic strain of avian influenza, H5N1, that has, since it first appeared in 1997, devastated the world’s bird populations and has infected over 300 people up to 2008, with a mortality rate of over 50%. Worldwide surveillance systems are now in place across the world linked into major laboratories in countries such as the UK, USA and Australia so that influenza and severe respiratory illness can be quickly identified and preventative measures, such as antiviral drugs in the case of influenza, can be rapidly deployed.
In the developing world the old killers of malaria, TB and the newer and more deadly, threat, HIV, are devastating the populations of sub-Saharan Africa. In these countries disease surveillance is less well developed, or even non-existent as in countries such as Zimbabwe, Iraq and Afghanistan.
Quantifying threats to public health
In the previous section we looked at the role of surveillance in the ongoing monitoring and detection of infectious disease; in addition to this, national governments also collect vital statistics on births, deaths and disease occurrence within their borders. Surveillance information is often combined with population data, obtained from national census, in the case of the UK once every 10 years, to create a powerful epidemiological database. Census data provide information on the health, wealth and well-being of a nation’s citizens and also demonstrates ongoing trends in births and deaths, areas of increased mortality to be identified and the general slow change in disease importance to be monitored. It is beyond the scope of this chapter to cover, in detail, the use of routine data for epidemiological purposes; however, in order for the reader to gain some knowledge for further self-directed learning, a number of terms will be defined.
The health of the people is really the foundation upon which all their happiness and all their powers as a state depend. (Benjamin Disraeli)
The health of a nation can be measured in a number of ways, which broadly fall into two distinct categories. One relates to deaths in the population, i.e. mortality, and the other to the amount of illness present, morbidity, and these in turn give rise to more complex measures such as, life expectancy at birth and quality-adjusted life years (QALYs), respectively, which will not be covered here.
Mortality
While knowing the number of deaths that occur is in itself useful, additional details such as cause of death, age, sex, date and place of death, place of residence and occupation (or last employed position) all add much more to our ability to turn routine data into information with which to plan and target services.
Box 4.3 presents an example of how data on the number of deaths occurring in a population can be combined with data on age and population demographics to produce much more meaningful measures that may be used to compare the health of a population of interest with another, for example the health of one region of the UK with the health of the UK as a whole, as measured by deaths occurring.
Box 4.3
Measures of mortality
• Number of deaths – simple count of deaths occurring
• Crude mortality rate occurring in a defined population – all deaths during a calendar year/population at mid year
• Mortality by age – simple count of deaths by age
• Age-specific mortality rates
• Disease-specific mortality rates
• Standardized mortality ratio
Crude mortality rate
By taking the number of deaths that occur in a particular calendar year, in a defined population of interest, and dividing this by the mid-year estimate of the number of individuals within that population, we arrive at the crude mortality rate; this may be specified as a rate per unit of population, e.g. per 1000. This term is useful and gives some crude indication as to the relative rates of death between a population of interest and another, e.g. between states in the USA or between nations in Europe. The problem with this type of measure is that it makes no use of demographic data on the age distribution within populations. It would therefore only be useful in comparing populations where the population age structure was identical.
Age-specific and disease-specific mortality rate
To overcome problems with interpretation of mortality data related to age, it is often convenient to calculate age-specific mortality rates, i.e. the number of deaths occurring in, say, a 5-year age band per unit of the population in that age band. This will give rise to age-specific mortality rates for a population. By this method the mortality experiences of age-band-specific tiers of the population can be compared with others.
If we wish to look at the impact of a specific disease on a population it is sometimes useful to use the count of the number of deaths from that disease in a population, divided by an estimate of the population size. Again, just like age-specific mortality, this may be useful in comparing the impact of a disease within, or between, nations. For example, if we carry out this analysis on regions within the UK, we will find that, for ischaemic heart disease, more deaths occur per unit of the population in Scotland, Wales and the northern regions of England than occur in the Home Counties around London, or the West Country. These regional differences, highlighted by disease-specific mortality rates, are the start of an epidemiological enquiry into disease aetiology and prevention.
Standardized mortality ratio
The standardized mortality ratio or SMR is a means by which the mortality experience of two disparate populations can be compared. For example, let’s consider two populations represented by the population pyramids shown in Figure 4.1.
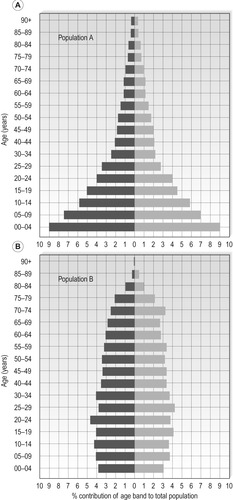 |
| Figure 4.1 •(A) Population A – population pyramid typical of a developing economy. (B) Population B – population pyramid typical of a developed world economy. |
The structures of the two populations represented by Figure 4.1A and 4.1B are very different, in that population A represents a population dominated by the young, as often seen in developing countries, while population B, has a much more evenly distributed population often seen in the developed world where infectious disease has been defeated, population birth control has been introduced and one has a right to expect to live into old age. If we wish to compare the health of these two populations, crude mortality, or even mortality rates, would give an erroneous picture due to the imbalance created by the differences in demographic structure. In order to calculate the SMR for population A compared to population B, we carry out the following steps.
Step 1
For each of populations A and B, we calculate the age-band-specific mortality rate for males and females in each population.
Step 2
For population A, we then calculate, for each age band, the number of deaths we would have expected to occur if the population of community A had the same age structure as population B.
That is, if in the age band 45–49 years in males from population A, which represents 1.7% (from Figure 4.1A) of the total population, we saw 110 deaths in a specific year, we now can pose the question, how many deaths would we see if population A had an age structure such that the 4549 age group represented the same proportion of the population as it does in population B, i.e. 3.3% (Figure 4.1B)?
Stay updated, free articles. Join our Telegram channel

Full access? Get Clinical Tree


Get Clinical Tree app for offline access
