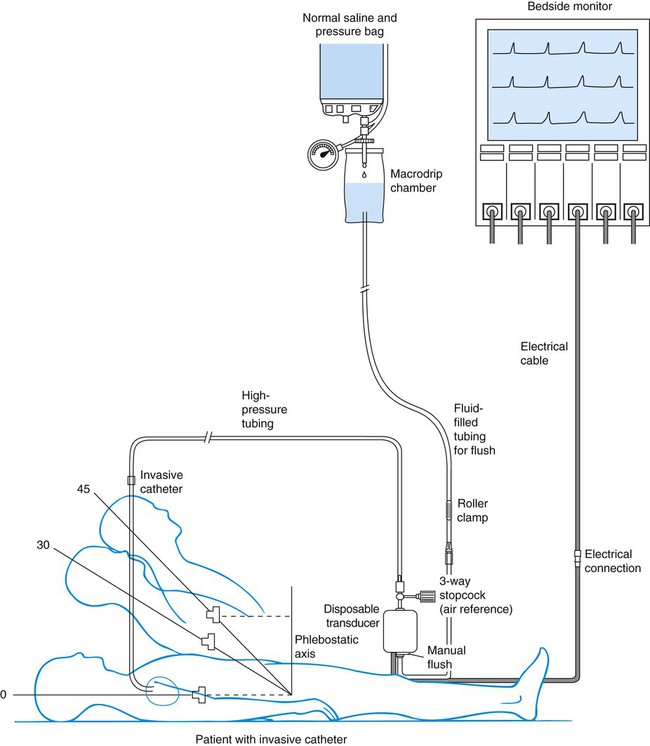
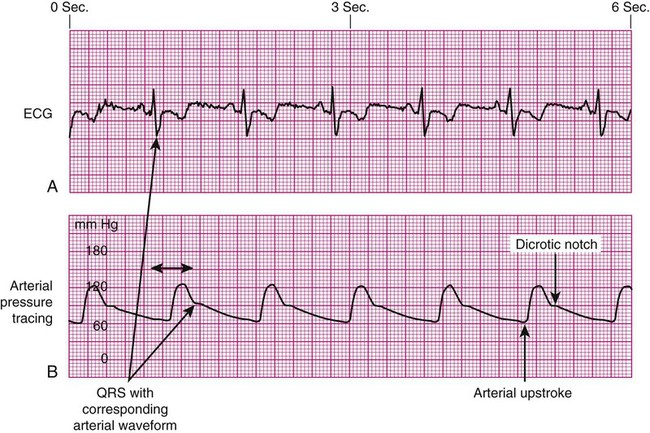
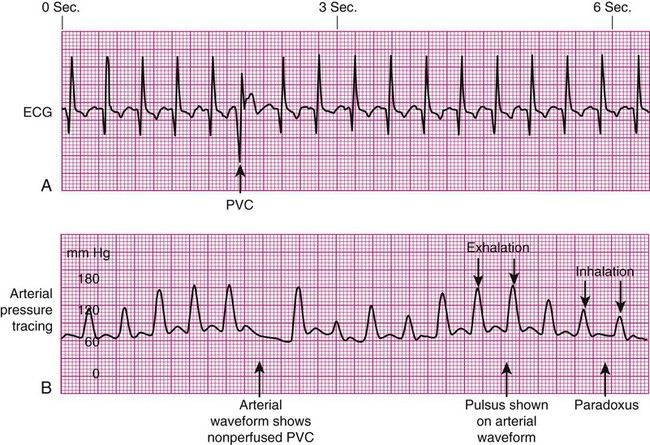
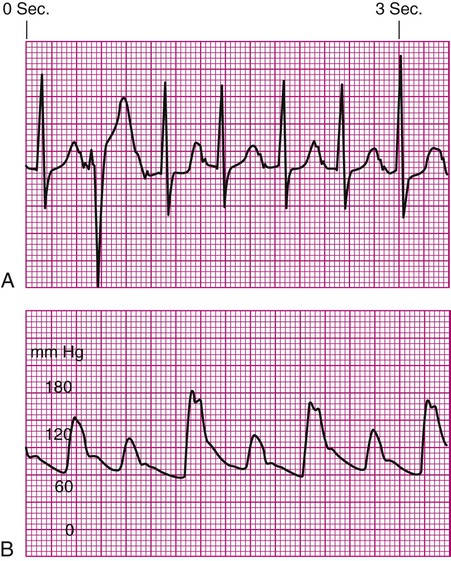
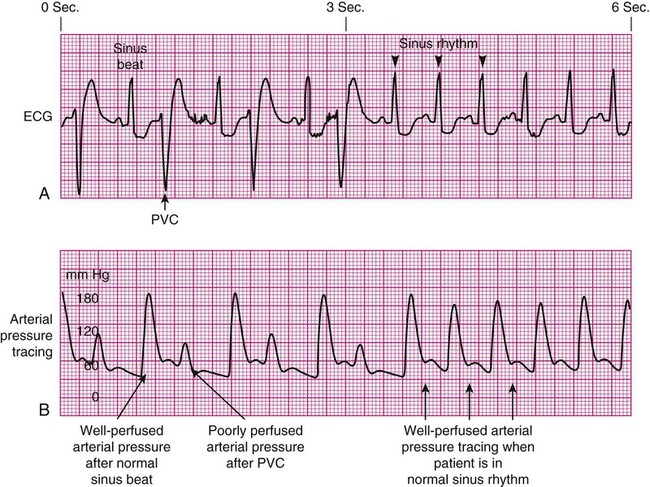
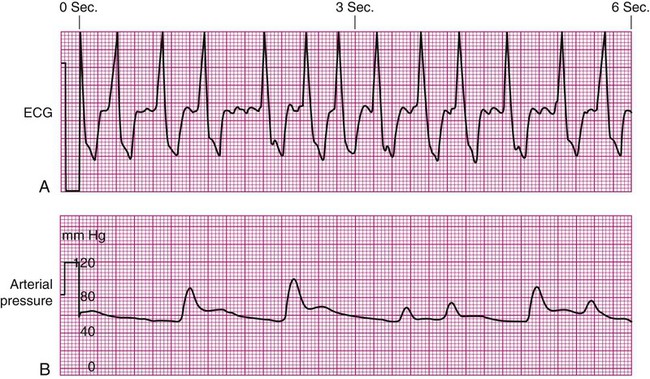
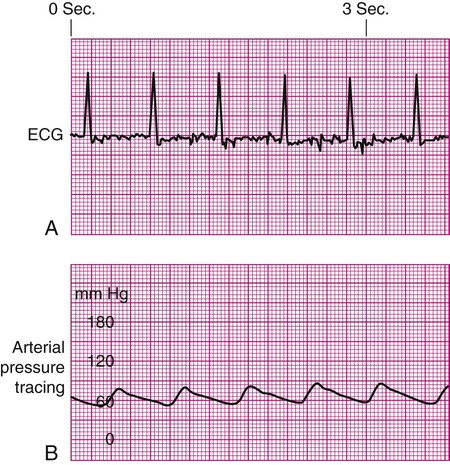
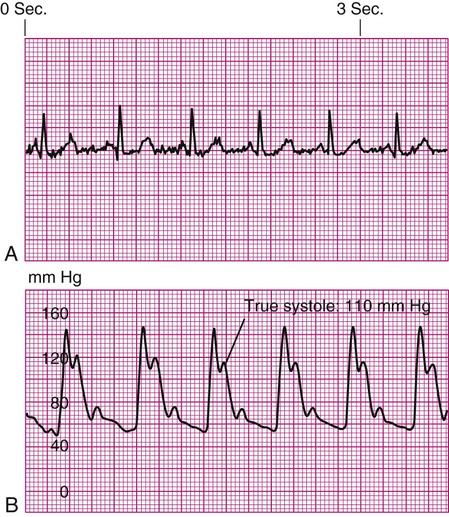
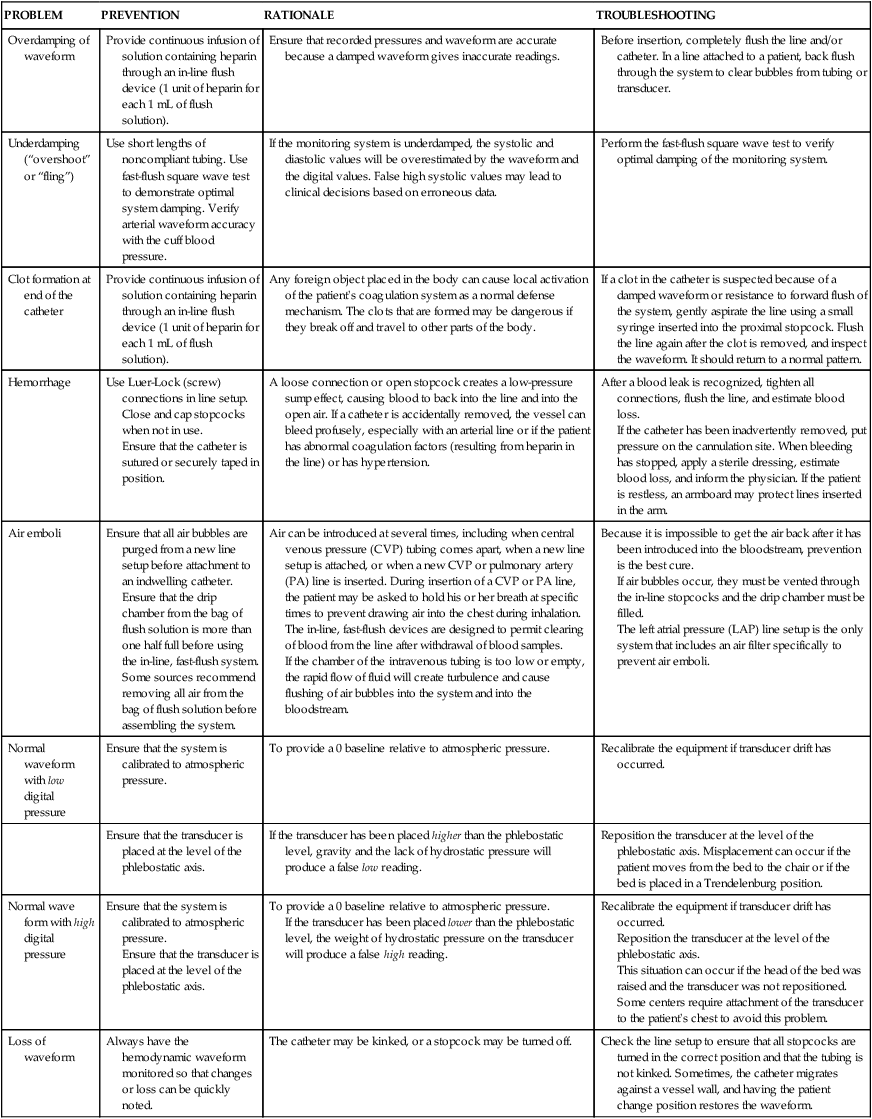
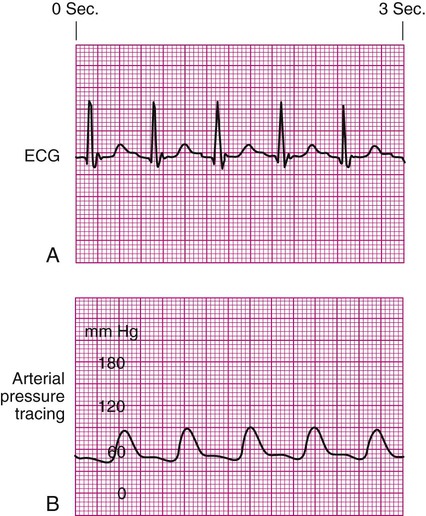
Chapter 14 Mary E. Lough and Christine Thompson A traditional hemodynamic monitoring system has four component parts as shown in Figure 14-1 and described in the following list: 1. An invasive catheter and high-pressure tubing connect the patient to the transducer. 2. The transducer receives the physiologic signal from the catheter and tubing and converts it into electrical energy. 3. The flush system maintains patency of the fluid-filled system and catheter. 4. The bedside monitor contains the amplifier with recorder, which increases the volume of the electrical signal and displays it on an oscilloscope and on a digital scale in millimeters of mercury (mm Hg). Although many different types of invasive catheters can be inserted to monitor hemodynamic pressures, all such catheters are connected to similar equipment (see Fig. 14-1). Even so, there remains variation in the way different hospitals configure their hemodynamic systems. The basic setup consists of the following: • A bag of 0.9% sodium chloride (normal saline) is used as a flush solution. In some hospitals heparin is added as an anticoagulant. A pressure infusion cuff covers the bag of flush solution and is inflated to 300 mm Hg. • The system contains intravenous tubing, three-way stopcocks, and an in-line flow device attached for continuous fluid infusion and manual flush. High-pressure tubing must be used to connect the invasive catheter to the transducer to prevent damping (flattening) of the waveform. • A pressure transducer is used. Modern transducers are disposable, use a silicon chip, and are highly accurate. The use of the anticoagulant heparin added to the normal saline (NS) flush setup to maintain catheter patency remains controversial.1,2 While many units do add heparin to flush solutions, other critical care units avoid heparin because of concern about development of heparin-induced antibodies that can trigger the autoimmune condition known as heparin-induced thrombocytopenia (HIT).2 This is sometimes described as a “heparin allergy” and, when present, is associated with a dramatic drop in platelet count and thrombus formation. If heparin is used in the flush infusion, ongoing monitoring of the platelet count is recommended.3 Flush solutions, lines, stopcocks, and disposable transducers are changed every 96 hours per current Centers for Disease Control and Prevention (CDC) guidelines.4 However, there is variation in practice between hospitals; some change the flush solutions every 24 hours. For this reason, it is essential to be familiar with the specific written procedures that concern hemodynamic monitoring equipment in each critical care unit. Dextrose solutions are not recommended as flush solutions in monitoring catheters.4 The phlebostatic axis is a physical reference point on the chest that is used as a baseline for consistent transducer height placement. To locate the level of the phlebostatic axis, an imaginary vertical line is drawn from the fourth intercostal space where it joints the sternum to a horizontal line that is midway between the anterior and posterior chest walls. The midaxillary line is one half of the anteroposterior depth of the lateral chest wall.5 This point approximates the level of the atria, as shown in Figure 14-1. It is used as the reference mark for central venous pressure (CVP) and pulmonary artery catheter transducers. The level of the transducer “air reference stopcock” approximates the position of the tip of an invasive hemodynamic monitoring catheter within the chest. Leveling the transducer is different from zeroing. This process aligns the transducer with the level of the left atrium. The purpose is to line up the air–fluid interface with the left atrium to correct for changes in hydrostatic pressure in blood vessels above and below the level of the heart.5 A carpenter’s level or laser-light level can be used to ensure that the transducer is parallel with the phlebostatic axis reference point. When there is a change in the patient’s position, the transducer must be leveled again to ensure accurate hemodynamic pressure measurements are obtained.5 Errors in measurement can occur if the transducer is placed below the phlebostatic axis because the fluid in the system weighs on the transducer, creating additional hydrostatic pressure, and produces a falsely high reading. For every inch the transducer is below the tip of the catheter, the fluid pressure in the system increases the measurement by 1.87 mm Hg. For example, if the transducer is positioned 6 inches below the tip of the catheter, this falsely elevates the displayed pressure by 11 mm Hg. If the transducer is placed above this atrial level, gravity and lack of fluid pressure will give an erroneously low reading. For every inch the transducer is positioned above the catheter tip, the measurement is 1.87 mm Hg less than the true value. If several clinicians are taking measurements, the reference point can be marked on the side of the patient’s chest to ensure accurate measurements. Box 14-1 summarizes other nursing activities associated with hemodynamic monitoring. Nurse researchers have determined that the CVP, pulmonary artery pressure (PAP), and pulmonary artery occlusion pressure (PAOP)—also called pulmonary artery wedge pressure (PAWP)—can be reliably measured at head of bed backrest positions from 0 (flat) to 60 degrees if the patient is lying on his or her back (supine).5,6 If the patient is normovolemic and hemodynamically stable, raising the head of the bed usually does not affect hemodynamic pressure measurements. If the patient is so hemodynamically unstable or hypovolemic that raising the head of the bed negatively affects intravascular volume distribution, the first priority is to correct the hemodynamic instability and leave the patient in a lower backrest position. In summary, most patients do not need the head of the bed to be lowered to 0 degrees to obtain accurate CVP, PAP, or PAOP readings. The landmarks for leveling the transducer are different if the patient is turned to the side. Researchers have evaluated hemodynamic pressure measurement readings with the patients in the 30- and 90-degree lateral positions with the head of the bed flat, and they found the measurements to be reliable.5 In the 30-degree angle position, the landmark to use for leveling the transducer is one half of the distance from the surface of the bed to the left sternal border.5 In the 90-degree right-lateral position, the transducer fluid–air interface was positioned at the fourth ICS at the midsternum. In the 90-degree left-lateral position, the transducer was positioned at the left parasternal border (beside the sternum).5 It is important to know that measurements can be recorded in nonsupine positions, because critically ill patients must be turned to prevent development of pressure ulcers and other complications of immobility. 1. Entry into the artery using a needle 2. Passage of a supple guidewire through the needle into the artery 4. Passage of the catheter over the guidewire 5. Removal of the guidewire, leaving the catheter in the artery Several major peripheral arteries are suitable for receiving a catheter and for long-term hemodynamic monitoring. The most frequently used site is the radial artery.2 The femoral artery is a larger vessel that is also frequently cannulated. Other smaller arterials such as the dorsalis-pedis, axillary, or brachial arteries are avoided if possible, and only used when other arterial access is unavailable. The major advantage of the radial artery is the supply of collateral circulation to the hand provided by the ulnar artery through the palmar arch in most people. Before radial artery cannulation, collateral circulation must be assessed by using Doppler flow or by the modified Allen test according to institutional protocol.2,7 In the Allen test the radial and ulnar arteries are compressed simultaneously. The patient is asked to clench and unclench the hand until it blanches. One of the arteries is then released, and the hand should immediately flush from that side. The same procedure is repeated for the remaining artery. Intra-arterial blood pressure monitoring is designed for continuous assessment of arterial perfusion to the major organ systems of the body. MAP is the clinical parameter most often used to assess perfusion, because MAP represents perfusion pressure throughout the cardiac cycle. Because one third of the cardiac cycle is spent in systole and two thirds in diastole, the MAP calculation must reflect the greater amount of time spent in diastole.8 This MAP formula can be calculated by hand or with a calculator, where diastole times 2 plus systole is divided by 3 as shown in the formula below: A blood pressure of 120/60 mm Hg produces a MAP of 80 mm Hg. However, the bedside hemodynamic monitor may show a slightly different digital number because bedside monitoring computers calculate the area under the curve of the arterial line tracing8 (Table 14-1). TABLE 14-1 HEMODYNAMIC PRESSURES AND CALCULATED HEMODYNAMIC VALUES *Pulmonary artery occlusion pressure (PAOP) was formerly called pulmonary capillary wedge pressure (PCW or PCWP) or pulmonary arterial wedge pressure (PAWP). Infection was once believed to be rare in arterial catheters because of the rapid arterial blood flow. New evidence suggests that arterial catheters are associated with the same risk of bloodstream infections as central venous catheters (CVCs).9 This means that infection prevention measures must be just as meticulous for arterial catheters as for CVCs.9 If the arterial line becomes unreliable or dislodged, a cuff pressure can be used as a reserve system.10 In the normotensive, normovolemic patient, little difference exists between the arm cuff blood pressure and the intravascular catheter pressure, and differences of 5 to 10 mm Hg do not generally alter clinical management. The situation is different if the patient has a low CO or is in shock. The concern is that the cuff pressure may be unreliable because of peripheral vasoconstriction, and an arterial line is generally required. It is usual practice to compare a cuff pressure after the arterial line is inserted. A recent study in hypotensive patients found that a MAP calculated from the arm cuff blood pressure was comparable to the intravascular arterial MAP.11 However, blood pressure cuffs placed on the thigh or ankle were less accurate in hypotensive patients.11 As the aortic valve opens, blood is ejected from the left ventricle and is recorded as an increase of pressure in the arterial system. The highest point recorded is called systole. After peak ejection (systole), the force decreases, and the pressure drops. A notch (dicrotic notch) may be visible on the downstroke of this arterial waveform, representing closure of the aortic valve. The dicrotic notch signifies the beginning of diastole. The remainder of the downstroke represents diastolic runoff of blood flow into the arterial tree. The lowest point recorded is called diastole. A normal arterial pressure tracing is shown in Figure 14-2. Notice that electrical stimulation (QRS) is always first and that the arterial pressure tracing follows the initiating QRS. Specific problems with heart rhythm can translate into poor arterial perfusion if CO decreases. Poor perfusion may be seen as a single, nonperfused beat after a premature ventricular contraction (PVC) (Fig. 14-3) or as multiple, nonperfused beats (Fig. 14-4). In ventricular bigeminy, every second beat is poorly perfused (Fig. 14-5). A disorganized atrial baseline resulting from atrial fibrillation creates a variable arterial pulse because of the differences in stroke volume (SV) between each beat (Fig. 14-6). All of these examples illustrate that when two beats are close together, the left ventricle does not have time to fill adequately, and the second beat is inadequately perfused or is not perfused at all. A pulse deficit occurs when the apical HR and the peripheral pulse are not equal. In the critical care unit, this can be seen on the bedside monitor. Normally, there is one arterial upstroke for each QRS, and if there are more QRS complexes than arterial upstrokes, a pulse deficit is present, as shown in Figures 14-3 and 14-6. To identify a pulse deficit in an unmonitored patient, a stethoscope is placed over the apex of the heart. The heartbeat can be heard, but it cannot be felt as a radial pulse. To determine whether a pulse deficit is significant, it is necessary to evaluate the clinical impact on the patient and whether any change in MAP or pulse pressure has occurred. Generally, the more nonperfused beats, the more serious the problem. Pulsus paradoxus is a decrease of more than 10 mm Hg in the arterial waveform that occurs during inhalation (inspiration). It is caused by a fall in CO as a result of increased negative intrathoracic pressure during inhalation. As pressure within the thorax falls, blood pools in the large veins of the lungs and thorax, and SV is decreased. The procedure for identification of pulsus paradoxus is discussed in Chapter 13 (see Box 13-9). In certain clinical conditions, the pulsus paradoxus is obvious and can be clearly seen on an arterial waveform. It can be used as a clinical diagnostic test in a patient with cardiac tamponade, pericardial effusion, or constrictive pericarditis.12 Pulsus paradoxus commonly occurs in hypovolemic surgical patients who are mechanically ventilated with large tidal volumes (see Fig. 14-3). If the arterial monitor shows a low blood pressure, it is the responsibility of the nurse to determine whether it is a patient problem or a problem with the equipment, as described in Table 14-2. A low arterial blood pressure waveform is shown in Figure 14-7. In this case, the digital readout correlated well with the patient’s cuff pressure, confirming that the patient was hypotensive. This arterial waveform is more rounded, without a dicrotic notch, compared with the normal waveform in Figure 14-2. A damped (flattened) arterial waveform is shown in Figure 14-8. In this case, the patient’s cuff pressure was significantly higher than the digital readout, representing a problem with equipment. A damped waveform occurs when communication from the artery to the transducer is interrupted and produces false values on the monitor and oscilloscope. Damping is caused by a fibrin “sleeve” that partially occludes the tip of the catheter, by kinks in the catheter or tubing, or by air bubbles in the system. Troubleshooting techniques (see Table 14-2) are used to find the origin of the problem and to remove the cause of damping. TABLE 14-2 Another cause of arterial waveform distortion is underdamping, also called overshoot or fling. Underdamping is recognized by a narrow, upward systolic peak that produces a falsely high systolic reading compared with the patient’s cuff blood pressure, as shown in Figure 14-9. The overshoot is caused by an increase in dynamic response or increased oscillations within the system. The monitoring system’s dynamic response can be verified for accuracy at the bedside by the fast-flush square waveform test, also called the dynamic frequency response test.5 The nurse performs this test to ensure that the patient pressures and waveform shown on the bedside monitor are accurate.5 The test makes use of the manual flush system on the transducer. Normally, the flush device allows only 3 mL of fluid/hr. With the normal waveform displayed, the manual fast-flush procedure is used to generate a rapid increase in pressure, which is displayed on the monitor oscilloscope. As shown in Figure 14-10, the normal dynamic response waveform shows a square pattern with one or two oscillations before the return of the arterial waveform. If the system is overdamped, a sloped (rather than square) pattern is seen. If the system is underdamped, additional oscillations—or vibrations—are seen on the fast-flush square wave test. This test can be performed with any hemodynamic monitoring system. If air bubbles, clots, or kinks are in the system, the waveform becomes damped, or flattened, and this is reflected in the square waveform result. This is an easy test to perform, and it should be incorporated into nursing care procedures at the bedside when the hemodynamic system is first set up, at least once per shift, after opening the system for any reason, and when there is concern about the accuracy of the waveform.5 If the pressure waveform is distorted or the digital display is inaccurate, the troubleshooting methods described in Table 14-2 can be implemented. The nurse caring for the patient with an arterial line must be able to assess whether a low MAP or narrowed perfusion pressure represents decreased arterial perfusion or equipment malfunction. Assessment of the arterial waveform on the oscilloscope, in combination with clinical assessment, and use of the square waveform test will yield the answer. All critically ill patients must have the hemodynamic monitoring alarms on and adjusted to sound an audible alarm if the patient should experience a change in blood pressure, HR, respiratory rate, or other significant monitored variable. The key issues concerning monitor alarms are presented in Box 14-2. CVP monitoring is indicated whenever a patient has significant alteration in fluid volume (see Table 14-1). The CVP can be used as a guide in fluid volume replacement in hypovolemia and to assess the impact of diuresis after diuretic administration in the case of fluid overload. When a major intravenous line is required for volume replacement, a CVC is a good choice because large volumes of fluid can easily be delivered. A range of CVC options are available as single-, double-, triple-, and quad-lumen infusion catheters, depending on the specific needs of the patient. CVCs are made from a variety of materials ranging from polyurethane to silicone; most are soft and flexible. Catheters that are antimicrobial-impregnated or heparin-coated have a lower rate of bloodstream infections.4 The large veins of the upper thorax—subclavian (SC) and internal jugular (IJ)—are most commonly used for percutaneous CVC line insertion.4 The femoral vein in the groin is used when the thoracic veins are not accessible. All three major sites have advantages and disadvantages. The IJ vein is the most frequently used access site for CVC insertion. Compared with the other thoracic veins, it is the easiest to canalize. If the IJ vein is not available, the external jugular (EJ) vein may be accessed, although blood flow is significantly higher in the IJ vein, making it the preferred site. Another advantage of the IJ vein is that the risk of creating an iatrogenic pneumothorax is small. Disadvantages to the IJ vein are patient discomfort from the indwelling catheter when moving the head or neck and contamination of the IJ vein site from oral or tracheal secretions, especially if the patient is intubated or has a tracheostomy. This may be the reason why catheter-related infections are higher in the IJ than the SC position for indwelling catheters left in place for more than 4 days.13,14 The femoral vein is considered the easiest cannulation site because there are no curves in the insertion route. The large diameter of the femoral vein carries a high blood flow that is advantageous for specialized procedures such as continuous renal replacement therapy (CRRT) or plasmapheresis. Because there is a higher rate of nosocomial infection with femoral catheters, this site is not recommended.4 If a femoral venous access has been used, the CVC should be changed to either the SC or IJ location as soon as the patient is hemodynamically stable.4 All central catheters are designed for placement by percutaneous injection after skin preparation and administration of a local anesthetic. Visualization of the vessel with a bedside ultrasound before insertion is recommended to reduce the number of CVC placement attempts.4 A prepackaged CVC kit typically is used for the procedure. The standard CVC kit contains sterile towels, chlorhexidine and alcohol for skin preparation, a needle introducer, a syringe, guidewire, and a catheter. The Seldinger technique, in which the vein is located by using a “seeking” needle and syringe, is the preferred method of placement. A guidewire is passed through the needle, the needle is removed, and the catheter is passed over the guidewire. After the tip of the catheter is correctly placed in the vena cava, the guidewire is removed. A sterile intravenous tubing and solution is attached, and the catheter is sutured in place. Following upper thoracic CVC placement, a chest radiograph is obtained to verify placement and the absence of an iatrogenic hemothorax or pneumothorax, especially if the SC vein was accessed. The risk of air embolus, although uncommon, is always present for the patient with a central venous line in place. Air can enter during insertion15 through a disconnected or broken catheter by means of an open stopcock, or air can enter along the path of a removed CVC.16,17 This is more likely if the patient is in an upright position, because air can be pulled into the venous system with the increase in negative intrathoracic pressure during inhalation. If a large volume of air is infused rapidly, it may become trapped in the right ventricular outflow tract, stopping blood flow from the right side of the heart to the lungs. Based on animal studies, this volume is approximately 4 mL/kg.18 If the air embolus is large, the patient will experience respiratory distress and cardiovascular collapse. An auscultatory clinical sign specifically associated with a large venous air embolism is the mill wheel murmur.15,16,19 A mill wheel murmur is a loud, churning sound heard over the middle chest, caused by the obstruction to right ventricular outflow. Treatment involves immediately occluding the external site where air is entering, administering 100% oxygen, and placing the patient on the left side with the head downward (left lateral Trendelenburg position).19 This position displaces the air from the right ventricular outflow tract to the apex of the heart, where the air may be aspirated by catheter intervention or gradually absorbed by the bloodstream as the patient remains in the left lateral Trendelenburg position. Precautions to prevent an air embolism in a CVP line include using only screw (Luer-Lock) connections, avoiding long loops of intravenous tubing, and using closed-top screw caps on the three-way stopcock. Clot formation (thrombus) at the CVC site is unfortunately common. Thrombus formation is not uniform; it may involve development of a fibrin sleeve around the catheter,20 or the thrombus may be attached directly to the vessel wall. Other factors that promote clot formation include rupture of vascular endothelium, interruption of laminar blood flow, and physical presence of the catheter, all of which activate the coagulation cascade. The risk of thrombus formation is higher if insertion was difficult or there were multiple needlesticks. Gradual thrombus formation may lead to “sudden” CVC occlusion. Usually, the CVC becomes more difficult to withdraw blood from, or the CVP waveform becomes intermittently damped over a period of hours or even 1 to 2 days and is reported as “needing frequent flushes” to remain patent. This situation is caused by the continued lengthening of a fibrin sleeve that extends along the catheter length from the insertion site past the catheter tip.20 Some catheters are heparin coated to reduce the risk of thrombus formation, although the risk of HIT does not make this a benign option. Sometimes, CVC complications are additive; for example, the risk of catheter-related infection is increased in the presence of thrombi, where the thrombus likely serves as a culture medium for bacterial growth. Because of concerns over the development of HIT many hospitals use a saline-only flush to maintain CVC patency.21,22 Infection related to the use of CVCs is a major problem. The incidence of infection strongly correlates with the length of time the CVC has been inserted, longer insertion times leading to a higher infection rate.4,23 CVC-related infection is identified at the catheter insertion site or as a bloodstream infection (septicemia). Systemic manifestations of infection can be present without inflammation at the catheter site. No decrease in bloodstream infections was found when catheters were routinely changed and this practice is no longer recommended.4 When a CVC is infected it must be removed and a new catheter inserted in a different site. If a catheter infection is suspected, the CVC should not be changed over a guidewire because of the risk of transferring the infection.4 Most infections are transmitted from the skin, and infection prevention begins prior to insertion of the CVC. Insertion guidelines state that the physician must use effective hand-washing procedures, clean the insertion site with 2% chlorhexidine gluconate in 70% isopropyl, use sterile technique during catheter insertion, and maintain maximal sterile barrier precautions.4 In many hospitals the nurse is authorized to stop the procedure if these insertion infection control guidelines are not followed. A daily review to determine whether the catheter is still required is recommended to ensure CVCs are removed promptly when no longer needed (Box 14-3).4 All clinicians must use good hand-washing technique and follow aseptic procedures during site care and any time the CVC system is entered to withdraw blood, give medications, or change tubing.4 Site dressings impregnated with chlorhexidine are recommended to lower CVC infection rates.4 The time-honored practice of using the CVP value to assess central volume status has now been challenged.24 A landmark systematic review of the literature revealed a weak relationship between the CVP measurement and blood volume.24 Nor was a low CVP value always reliable in predicting who would respond to a fluid challenge.24 In patients with a CVP between 0 and 5 mm Hg, up to 25% do not respond to a fluid challenge as expected.25 Overall only about half of critically ill patients respond as expected to a fluid challenge.24 In this situation the clinician must look at other indices of poor tissue perfusion such as an elevated lactate level, low base deficit, or decreased urine output.25 Another method to assess fluid responsiveness is to passively raise and support the patient’s legs, to allow the venous blood from the lower extremities to rapidly flow into the vena cava and return to the right heart. If this maneuver increases the CVP by at least 2 mm Hg, this suggests that the patient will have a positive response to an IV fluid bolus.26
Cardiovascular Diagnostic Procedures
Cardiovascular Assessment and Monitoring
Bedside Hemodynamic Monitoring
Equipment
Heparin.
Phlebostatic Axis.
Leveling the Transducer.
Patient Position
Head of Bed Backrest Position.
Lateral Position.
Intra-arterial Blood Pressure Monitoring
Indications
Catheters
Insertion and Allen Test.
Nursing Management

HEMODYNAMIC PRESSURE
DEFINITION AND EXPLANATION
NORMAL RANGE
Mean arterial pressure (MAP)
Average perfusion pressure created by arterial blood pressure during the cardiac cycle. The normal cardiac cycle is one third systole and two thirds diastole. These three components are divided by 3 to obtain the average perfusion pressure for the whole cardiac cycle.
70-100 mm Hg
Central venous pressure (CVP)
Pressure created by volume in the right side of the heart. When the tricuspid valve is open, the CVP reflects filling pressures in the right ventricle. Clinically, the CVP is often used as a guide to overall fluid balance.
2-5 mm Hg
3-8 cm water (H2O)
Left atrial pressure (LAP)
Pressure created by the volume in the left side of the heart. When the mitral valve is open, the LAP reflects filling pressures in the left ventricle. Clinically, the LAP is used after cardiac surgery to determine how well the left ventricle is ejecting its volume. In general, the higher the LAP, the lower the ejection fraction from the left ventricle.
5-12 mm Hg
Pulmonary artery pressure (PAP)
PA systolic (PAS)
PA diastolic (PAD)
PAP mean (PAPm)
Pulsatile pressure in the pulmonary artery measured by an indwelling catheter.
PAS 20-30 mm Hg
PAD 5-10 mm Hg
PAPm 10-15 mm Hg
Pulmonary artery occlusion pressure (PAOP)*
Pressure created by the volume in the left side of the heart. When the mitral valve is open, the PAOP reflects filling pressures in the pulmonary vasculature, and pressures in the left side of the heart are transmitted back to the catheter “wedged” into a small pulmonary arteriole.
5-12 mm Hg
Cardiac output (CO)
Amount of blood pumped out by a ventricle over 1 minute. Clinically, it can be measured using the thermodilution CO method, which calculates CO in liters per minute (L/min).
4-6 L/min (at rest)
Cardiac index (CI)
CO divided by the body surface area (BSA), with tailoring of CO to individual body size. A BSA conversion chart is necessary to calculate CI, which is considered more accurate than CO because it is individualized to height and weight. CI is measured in liters per minute per square meter of BSA (L/min/m2).
2.2-4.0 L/min/m2
Stroke volume (SV)
Amount of blood ejected by the ventricle with each heartbeat, expressed in milliliters (mL). Hemodynamic monitoring systems calculate SV by dividing cardiac output (CO in L/min) by the heart rate (HR) and then multiplying the answer by 1000 to change liters to milliliters (mL).
60-70 mL
Stroke volume index (SI)
SV indexed to the BSA.
40-50 mL/m2
Systemic vascular resistance (SVR)
Mean pressure difference across the systemic vascular bed divided by blood flow. Clinically, SVR represents the resistance against which the left ventricle must pump to eject its volume. This resistance is created by the systemic arteries and arterioles. As SVR increases, CO falls. SVR is measured in Wood units or dyn·sec·cm−5. If the number of Wood units is multiplied by 80, the value is converted to dyn·sec·cm−5.
10-18 Wood units or
800-1400 dyn·sec·cm−5
Systemic vascular resistance index (SVRI)
SVR indexed to BSA.
2000-2400 dyn·sec·cm−5
Pulmonary vascular resistance (PVR)
Mean pressure difference across pulmonary vascular bed divided by blood flow. Clinically, PVR represents the resistance against which the right ventricle must pump to eject its volume. This resistance is created by the pulmonary arteries and arterioles. As PVR increases, the output from the right ventricle decreases. PVR is measured in Wood units or dyn·sec·cm−5. PVR is normally one sixth of SVR.
1.2-3.0 Wood units or
100-250 dyn·sec·cm−5
Pulmonary vascular resistance index (PVRI)
PVR indexed to BSA.
225-315 dyn·sec·cm−5/m2
Left cardiac work index (LCWI)
Amount of work the left ventricle does each minute when ejecting blood. The hemodynamic formula represents pressure generated (MAP) multiplied by volume pumped (CO). A conversion factor is used to change mm Hg to kilogram-meter (kg-m). LCWI is always represented as an indexed volume (BSA chart). LCWI increases or decreases because of changes in pressure (MAP) or volume pumped (CO).
3.4–4.2 kg-m/m2
Left ventricular stroke work index (LVSWI)
Amount of work the left ventricle performs with each heartbeat. The hemodynamic formula represents pressure generated (MAP) multiplied by volume pumped (SV). A conversion factor is used to change mL/mm Hg to gram-meter (g-m). LVSWI is always represented as an indexed volume. LVSWI increases or decreases because of changes in the pressure (MAP) or volume pumped (SV).
50-62 g-m/m2
Right cardiac work index (RCWI)
Amount of work the right ventricle performs each minute when ejecting blood. The hemodynamic formula represents pressure generated (PAP mean) multiplied by volume pumped (CO). A conversion factor is used to change mm Hg to kilogram-meter (kg-m). RCWI is always represented as an indexed value (BSA chart). Similar to LCWI, the RCWI increases or decreases because of changes in the pressure (PAP mean) or volume pumped (CO).
0.54-0.66 kg-m/m2
Right ventricular stroke work index (RVSWI)
Amount of work the right ventricle does each heartbeat. The hemodynamic formula represents pressure generated (PAP mean) multiplied by volume pumped (SV). A conversion factor is used to change mm Hg to gram-meter (g-m). RVSWI is always represented as an indexed value (BSA chart). Similar to LVSWI, the RVSWI increases or decreases because of changes in the pressure (PAP mean) or volume pumped (SV).
7.9-9.7 g-m/m2
Infection.
Cuff Blood Pressure.
Arterial Pressure Waveform Interpretation
Decreased Arterial Perfusion.
Pulse Deficit.
Pulsus Paradoxus.
Damped Waveform.
PROBLEM
PREVENTION
RATIONALE
TROUBLESHOOTING
Overdamping of waveform
Provide continuous infusion of solution containing heparin through an in-line flush device (1 unit of heparin for each 1 mL of flush solution).
Ensure that recorded pressures and waveform are accurate because a damped waveform gives inaccurate readings.
Before insertion, completely flush the line and/or catheter. In a line attached to a patient, back flush through the system to clear bubbles from tubing or transducer.
Underdamping (“overshoot” or “fling”)
Use short lengths of noncompliant tubing. Use fast-flush square wave test to demonstrate optimal system damping. Verify arterial waveform accuracy with the cuff blood pressure.
If the monitoring system is underdamped, the systolic and diastolic values will be overestimated by the waveform and the digital values. False high systolic values may lead to clinical decisions based on erroneous data.
Perform the fast-flush square wave test to verify optimal damping of the monitoring system.
Clot formation at end of the catheter
Provide continuous infusion of solution containing heparin through an in-line flush device (1 unit of heparin for each 1 mL of flush solution).
Any foreign object placed in the body can cause local activation of the patient’s coagulation system as a normal defense mechanism. The clots that are formed may be dangerous if they break off and travel to other parts of the body.
If a clot in the catheter is suspected because of a damped waveform or resistance to forward flush of the system, gently aspirate the line using a small syringe inserted into the proximal stopcock. Flush the line again after the clot is removed, and inspect the waveform. It should return to a normal pattern.
Hemorrhage
Use Luer-Lock (screw) connections in line setup. Close and cap stopcocks when not in use.
Ensure that the catheter is sutured or securely taped in position.
A loose connection or open stopcock creates a low-pressure sump effect, causing blood to back into the line and into the open air. If a catheter is accidentally removed, the vessel can bleed profusely, especially with an arterial line or if the patient has abnormal coagulation factors (resulting from heparin in the line) or has hypertension.
After a blood leak is recognized, tighten all connections, flush the line, and estimate blood loss.
If the catheter has been inadvertently removed, put pressure on the cannulation site. When bleeding has stopped, apply a sterile dressing, estimate blood loss, and inform the physician. If the patient is restless, an armboard may protect lines inserted in the arm.
Air emboli
Ensure that all air bubbles are purged from a new line setup before attachment to an indwelling catheter.
Ensure that the drip chamber from the bag of flush solution is more than one half full before using the in-line, fast-flush system.
Some sources recommend removing all air from the bag of flush solution before assembling the system.
Air can be introduced at several times, including when central venous pressure (CVP) tubing comes apart, when a new line setup is attached, or when a new CVP or pulmonary artery (PA) line is inserted. During insertion of a CVP or PA line, the patient may be asked to hold his or her breath at specific times to prevent drawing air into the chest during inhalation.
The in-line, fast-flush devices are designed to permit clearing of blood from the line after withdrawal of blood samples.
If the chamber of the intravenous tubing is too low or empty, the rapid flow of fluid will create turbulence and cause flushing of air bubbles into the system and into the bloodstream.
Because it is impossible to get the air back after it has been introduced into the bloodstream, prevention is the best cure.
If air bubbles occur, they must be vented through the in-line stopcocks and the drip chamber must be filled.
The left atrial pressure (LAP) line setup is the only system that includes an air filter specifically to prevent air emboli.
Normal waveform with low digital pressure
Ensure that the system is calibrated to atmospheric pressure.
To provide a 0 baseline relative to atmospheric pressure.
Recalibrate the equipment if transducer drift has occurred.
Ensure that the transducer is placed at the level of the phlebostatic axis.
If the transducer has been placed higher than the phlebostatic level, gravity and the lack of hydrostatic pressure will produce a false low reading.
Reposition the transducer at the level of the phlebostatic axis. Misplacement can occur if the patient moves from the bed to the chair or if the bed is placed in a Trendelenburg position.
Normal wave form with high digital pressure
Ensure that the system is calibrated to atmospheric pressure.
Ensure that the transducer is placed at the level of the phlebostatic axis.
To provide a 0 baseline relative to atmospheric pressure.
If the transducer has been placed lower than the phlebostatic level, the weight of hydrostatic pressure on the transducer will produce a false high reading.
Recalibrate the equipment if transducer drift has occurred.
Reposition the transducer at the level of the phlebostatic axis.
This situation can occur if the head of the bed was raised and the transducer was not repositioned. Some centers require attachment of the transducer to the patient’s chest to avoid this problem.
Loss of waveform
Always have the hemodynamic waveform monitored so that changes or loss can be quickly noted.
The catheter may be kinked, or a stopcock may be turned off.
Check the line setup to ensure that all stopcocks are turned in the correct position and that the tubing is not kinked. Sometimes, the catheter migrates against a vessel wall, and having the patient change position restores the waveform.
Underdamped Waveform.
Fast-Flush Square Waveform Test.
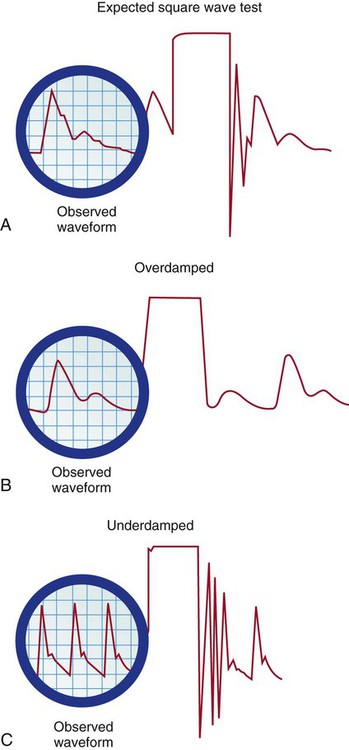
A, Expected square wave test result. B, Overdamped. C, Underdamped. (From Darovic GO. Hemodynamic Monitoring: Invasive and Noninvasive Clinical Application. 3rd ed. Philadelphia: WB Saunders; 2002.)
Alarms.
Central Venous Pressure Monitoring
Indications
Central Venous Catheters
Insertion.
Internal Jugular Vein.
Femoral Vein.
Central Venous Catheter Complications
Air Embolus.
Thrombus Formation.
Infection.
Nursing Management
Central Venous Pressure—Volume Assessment.
Passive Leg Raise.
![]()
Stay updated, free articles. Join our Telegram channel

Full access? Get Clinical Tree


Cardiovascular Diagnostic Procedures
Get Clinical Tree app for offline access

