9 Cardiovascular Assessment and Monitoring
After reading this chapter, you should be able to:
• describe the normal blood flow through the cardiovascular system
• define each stage of the cardiac action potential
• describe the determinants of cardiac output
• describe the reasons for the assessment and monitoring of critically ill patients
• summarise the key principles underpinning cardiac assessment and monitoring
• identify the recommended anatomical landmarks for cardiac auscultation and identify normal and common abnormal heart sounds
• describe the physiological bases and reasons for different types of haemodynamic monitoring
Related Anatomy and Physiology
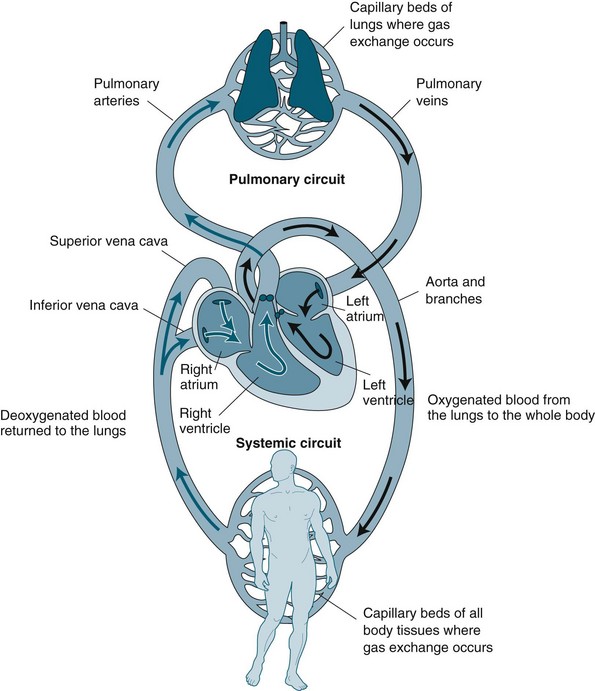
The cardiovascular system is essentially a transport system for distributing metabolic requirements to, and collecting byproducts from, cells throughout the body. The heart pumps blood continuously through two separate circulatory systems: both to the lungs, and all other parts of the body (see Figure 9.1). Structures on the right side of the heart pump blood through the lungs (the pulmonary circulation) to be oxygenated. The left side of the heart pumps oxygenated blood throughout the remainder of the body (the systemic circulation).1,2 The two systems are connected, so the output of one becomes the input of the other.
Cardiac Macrostructure
The heart is cone-shaped and lies diagonally in the mediastinum towards the left side of the chest. The point of the cone is called the apex and rests just above the diaphragm; the base of the cone lies just behind the mediastinum. The adult heart is about the size of that individual’s fist, weighs around 300 g, and is composed of chambers and valves that form the two separate pumps. The upper chambers, the atria, collect blood and act as a primer to the main pumping chambers, the ventricles. As the atria are low-pressure chambers, they have relatively thin walls and are relatively compliant. As the ventricle propels blood against either pulmonary or systemic pressure, they are much thicker and more muscular walls than the atria. As pressure is higher in the systemic circulation, the left ventricle is much thicker than the right ventricle. Dense fibrous connective tissue rings provide a firm anchorage for attachments of atrial and ventricular muscle and valvular tissue.1,4
One-way blood flow in the system is facilitated by valves. Valves between the atria and ventricles are composed of cusps or leaflets sitting in a ring of fibrous tissue and collagen. The cusps are anchored to the papillary muscles by chordae tendinae so that the cusps are pulled together and downwards at the onset of ventricular contraction. The atrioventricular valves are termed the tricuspid valve in the right side of the heart and the mitral or bicuspid valve in the left side of the heart. Semilunar valves prevent backflow from the pulmonary artery (pulmonic valve) and aorta (aortic valve) into the right and left ventricles correspondingly. The muscles in the ventricles follow a distinct spiral path so that during contraction, blood is propelled into the respective outflow tracts of the pulmonary artery and aorta. The aortic valve sits in a tubular area of mostly non-contractile collagenous tissue, which contains the opening of the coronary arteries. The coronary arteries run through deep grooves that separate the atria and ventricles. The two sides of the heart are divided by a septum, which ensures that two separate but integrated circulations are maintained.1,4
The myocardium forms the bulk of the heart and is composed primarily of myocytes. Myocytes are the contractile cells, and autorhythmic cells, which create a conduction pathway for electrical impulses. Myocytes (see Figure 9.2) are cylindrical in shape and able to branch to interconnect with each other. The junctions between myocytes are termed intercalated discs and contain desmosomes and gap junctions.6 Desmosomes act as anchors to prevent the myocytes from separating during contraction. Gap junctions contain connexons, which allow ions to move from one myocyte to the next. The movement of ions from cell to cell ensures that the whole myocardium acts as one unit, termed a functional syncytium. When ischaemia occurs, the gap junctions may uncouple, so ions do not move as freely. Uncoupling may also contribute to the poor conduction evidenced on ECG during ischaemia.5
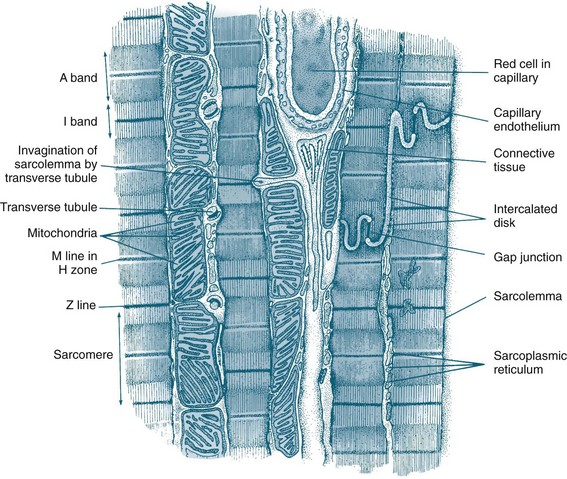
FIGURE 9.2 Diagram of an electron micrograph of cardiac muscle showing mitochondria, intercalculated discs, tubules and sarcoplasmic reticulum.5
The endocardium is composed primarily of squamous epithelium, which forms a continuous sheet with the endothelium that lines all arteries, veins and capillaries. The vascular endothelium is the source of many chemical mediators, including nitric oxide and the endothelin involved in vessel regulation. It has been theorised that the endocardium may also have this function.1,4
Coronary Perfusion
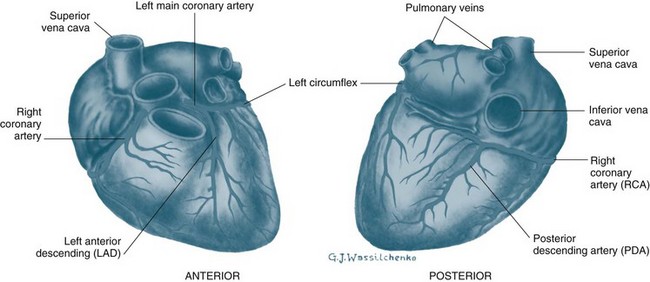
The heart is perfused by the right and left coronary arteries that arise from openings in the aorta called the coronary ostia (see Figure 9.3). The right coronary artery (RCA) branches supply the atrioventricular node, right atrium and right ventricle, and the posterior descending branch supplies the lower aspect of the left ventricle. The left coronary artery divides into the left anterior descending artery (LAD) and the circumflex artery (CX) shortly after its origin. The LAD supplies the interventricular septum and anterior surface of the left ventricle. The CX supplies the lateral and posterior aspects of the left ventricle. This is the most common distribution of the coronary arteries, but it is not uncommon for the right coronary artery to be small and the CX to supply the inferior wall of the left ventricle. The coronary arteries ultimately branch into a dense network of capillaries to support cardiac myocytes. Anastomoses between branches of the coronary arteries often occur in mature individuals when myocardial hypoxia has been present. These anastomoses are termed collateral arteries, but the contribution to normal cardiac perfusion during occlusion of coronary arteries is unclear.1
Physiological Principles
Mechanical Events of Contraction
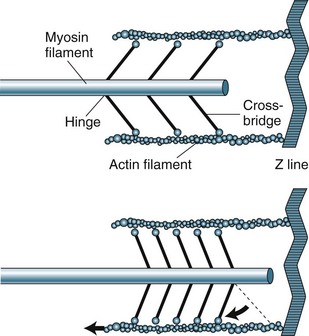
The sarcomere contains two types of protein myofilaments, one thick (myosin) and one thin (actin, tropomyosin and troponin) (see Figure 9.4). The myosin molecules of the thick filaments contain active sites that form bridges with sites of the actin molecules on the thin filaments. These filaments are arranged so that during contraction, bridges form and the thin filaments are pulled into the lattice of the thick filaments. As the filaments are pulled towards the centre of the sarcomere, the degree of contraction is limited by the length of the sarcomere. Starling’s law states that, within physiological limits, the greater the degree of stretch, the greater the force of contraction. The length of the sarcomere is the physiological limit because too great a stretch will disconnect the myosin–actin bridges.
Electrical events of Depolarisation, Resting Potential and Action Potential
Automaticity and rhythmicity are intrinsic properties of all myocardial cells. However, specialised autorhythmic cells in the myocardium generate and conduct impulses in a specific order to create a conduction pathway. This pathway ensures that contraction is coordinated and rhythmical, so that the heart pumps efficiently and continuously. Electrical impulses termed action potentials are transmitted along this pathway and trigger contraction in myocytes. Action potentials represent the inward and outward flow of negative and positive charged ions across the cell membrane (see Figure 9.5).
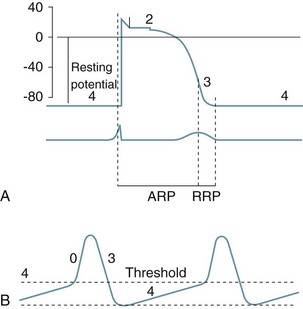
FIGURE 9.5 (A) Action potential in a ‘fast response’, non-pacemaker myocyte: phases 0–4, resting membrane potential −80 mV, absolute refractory period (ARP) and relative refractory period (RRP). (B) Action potential in a ‘slow response’, pacemaker myocyte. The upward slope of phase 4, on reaching threshold potential, results in an action potential.7
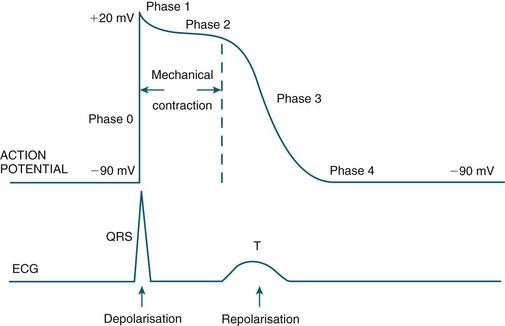
The contractile response begins just after the start of depolarisation and lasts about 1.5 times as long as the depolarisation and repolarisation (see Figure 9.6).
• at rest cell membranes are more permeable to potassium and consequently;
• potassium moves slowly and passively from intracellular to extracellular fluid;
• rapid ion movement caused by sodium flowing into the cell alters the charge from −90 mV to +30 mV;
• there follows a brief influx of calcium via the fast channel and then more via the slower channel to create a plateau, the time of which determines stroke volume due to its influence on the contractile strength of muscle fibres;
• the third phase occurs when the potassium channel opens, allowing potassium to leave the cell, to restore the negative charge, causing rapid repolarisation.
• the final resting phase occurs when slow potassium leakage allows the cell to increase its negative charge to ensure that it is more negative than surrounding fluid, before the next depolarisation occurs and the cycle repeats.6
Cardiac muscle is generally slow to respond to stimuli and has relatively low ATPase activity. Its fibres are dependent on oxidative metabolism and require a continuous supply of oxygen. The length of fibres and the strength of contraction are determined by the degree of diastolic filling in the heart. The force of contraction is enhanced by catecholamines.2
Depolarisation is initiated in the sino-atrial (SA) node and spreads rapidly through the atria, then converges on the atrio-ventricular (AV) node; atrial depolarisation normally takes 0.1 second. There is a short delay at the AV node (0.1 sec) before excitation spreads to the ventricles. This delay is shortened by sympathetic activity and lengthened by vagal stimulation. Ventricular depolarisation takes 0.08–0.1 sec, and the last parts of the heart to be depolarised are the posteriobasal portion of the left ventricle, the pulmonary conus and the upper septum.8
Cardiac Macrostructure and Conduction
The electrical and mechanical processes of the heart differ but are connected. The autorhythmic cells of the cardiac conduction pathway ensure that large portions of the heart receive an action potential rapidly and simultaneously. This ensures that the pumping action of the heart is maximised. The conduction pathway is composed of the sinoatrial (SA) node, the atrioventricular (AV) node, the bundle of His, right and left bundle branches and Purkinje fibres (see Figure 9.7). The cells contained in the pathway conduct action potentials extremely rapidly, 3–7 times faster than general myocardial tissue. Pacemaker cells of the sinus and atrioventricular nodes differ, in that they are more permeable to potassium, so that potassium easily ‘leaks’ back out of the cells triggering influx of sodium and calcium back into cells. This permits the spontaneous automaticity of pacemaker cells.
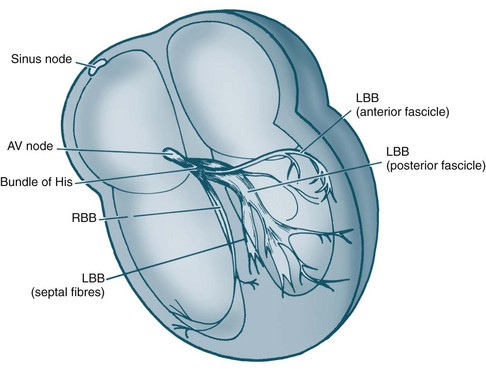
FIGURE 9.7 Cardiac conduction system: AV, atrioventricular; RBB, right bundle branch; LBB, left bundle branch.5
Cardiac Output
Determinants of Cardiac Output
Cardiac performance is altered by numerous homeostatic mechanisms. Cardiac output is regulated in response to stress or disease, and changes in any of the factors that determine cardiac output will result in changes to cardiac output (see Figure 9.8). Cardiac output is the product of heart rate and stroke volume; alteration in either of these will increase or decrease cardiac output, as will alteration in preload, afterload or contractility. In the healthy individual, the most immediate change in cardiac output is seen when heart rate rises. However, in the critically ill, the ability to raise the heart rate in response to changing circumstances is limited, and a rising heart rate may have negative effects on homeostasis, due to decreased diastolic filling and increased myocardial oxygen demand.
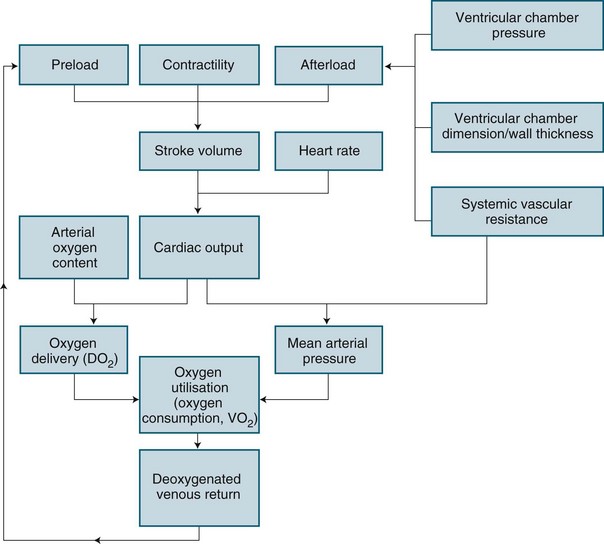
Preload is the load imposed by the initial fibre length of the cardiac muscle before contraction (i.e. at the end of diastole). The primary determinant of preload is the amount of blood filling the ventricle during diastole, and as indicated in Figure 9.8, it is important in determining stroke volume. Preload influences the contractility of the ventricles (the strength of contraction) because of the relationship between myocardial fibre length and stretch. However, a threshold is reached when fibres become overstretched, and force of contraction and resultant stroke volume will fall.
Preload of the left side of the heart, assessed at the end of filling of the left ventricle from the left atrium using the pulmonary capillary wedge pressure (PCWP), is assumed for clinical purposes to reflect left ventricular end-diastolic volume (LVEDV). Due to the non-linear relationship between volume and pressure,10 caution must, however, be taken when interpreting these values, as rises in LVEDP may indicate pathology other than increased preload. Preload of the right side of the heart is indirectly assessed at the end of filling of the right ventricle from the right atrium through central venous pressure (CVP) monitoring.
Cardiac output is dependent on a series of mechanical events in the cardiac cycle (see Figure 9.9). As normal average heart rate is maintained at approximately 70 beats/min the average phases of the cardiac cycle are completed in less than a second (0.8 sec). Electrical stimulation of myocardial contraction ensures that the four chambers of the heart contract in sequence. This allows the atria to act as primer pumps for the ventricles, while the ventricles are the major pumps that provide the impetus for blood through the pulmonary and systemic vascular systems. The phases of the cardiac cycle are characterised by pressure changes within each of the heart chambers, resulting in blood flow from areas of high pressure to areas of lower pressure.
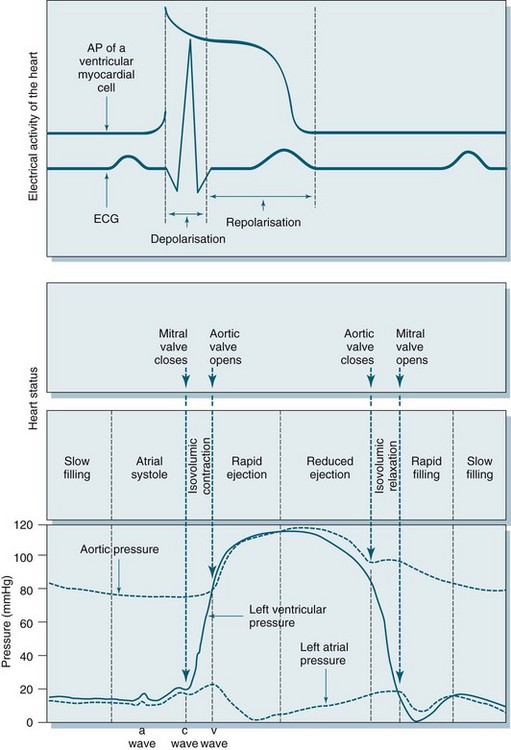
During early ventricular diastole, the ventricles repolarise and ventricular relaxation occurs. The pressure in the ventricles falls until the pressures in the aorta and pulmonary artery are higher and blood pushes back against the semilunar valves. Shutting of these valves prevents backflow into the ventricles, and pressure in the ventricles declines further. During ventricular contraction, the atria have been filling passively, so the pressure in the atria rises to higher than that in the ventricles and the AV valves open, allowing blood flow to the ventricles. Any rise in heart rate will shorten the resting period, which may impair filling time and coronary artery flow as these arteries fill during diastole.1
Regulation of Cardiac Output
Intrinsic regulation of contraction responds to the rate of blood flow into the chambers. Blood flow into the heart depends on venous return from systemic and pulmonic veins and varies according to tissue metabolism, total blood volume and vasodilation. Venous return contributes to end-diastolic volume (preload) and pressure, which are both directly related to the force of contraction in the next ventricular systole. The intrinsic capacity of the heart to respond to changes in end-diastolic pressure can be represented by a number of length–tension curves and the Frank-Starling mechanism (see Figure 9.10). According to this mechanism, within limits, the more stretch on the cardiac muscle fibre before contraction, the greater the strength of contraction. The ability to increase strength of contraction in response to increased stretch is because there is an optimal range of cross-bridges that can be created between actin and myosin in the myocyte. Under this range, when venous return is poor, fewer cross-bridges can be created. Above this range, when heart failure is present, the cross-bridges can become partially disengaged, contraction is poor, and higher filling pressures are needed to achieve adequate contractile force.
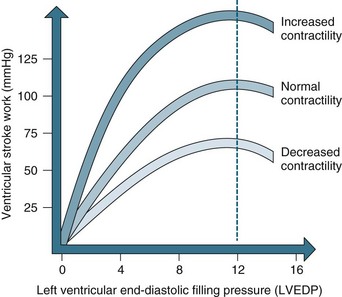
FIGURE 9.10 The Frank-Starling curve. As left ventricular end-diastolic pressure increases, so does ventricular stroke work.5
Ventricular contraction is also intrinsically influenced by the size of the ventricle and the thickness of the ventricle wall. This mechanism is described by Laplace’s law, which states that the amount of tension generated in the wall of the ventricle required to produce intraventricular pressure depends on the size (radius and wall thickness) of the ventricle.1 As a result, in heart failure, when ventricular thinning and dilation is present, more tension or contractile force is required to create intraventricular pressure and therefore cardiac output.
Autonomic nervous system control and regulation of heart rate
Although the pacemaker cells of the heart are capable of intrinsic rhythm generation (automaticity), inputs from the autonomic nervous system regulate heart rate changes in accordance with body needs by stimulating or depressing these pacemaker cells. Cardiac innervation includes sympathetic fibres from branches of T1–T5, and parasympathetic input via the vagus nerve.10 The heart rate at any moment is a product of the respective inputs of sympathetic stimuli (which accelerate) and parasympathetic stimuli (which depress) on heart rate. Rises in heart rate can thus be achieved by an increase in sympathetic tone or by a reduction in parasympathetic tone (vagal inhibition). Conversely, slowing of the heart rate can be achieved by decreasing sympathetic or increasing parasympathetic activity.4
Hormonal, biochemical and pharmacological inputs also exert heart rate influences by their effect on autonomic neural receptors or directly on pacemaker cells. In mimicking the effects of direct nervous inputs, these influences may be described as sympathomimetic or parasympathomimetic. Sympathomimetic stimulation (e.g. through the use of isoprenaline) achieves the same cardiac endpoints as direct sympathetic activity, increasing the heart rate, while sympathetic antagonism (e.g. beta-blockade therapy) slows the heart through receptor inhibition. By contrast, parasympathomimetic agonist activity slows the heart rate, while parasympathetic antagonism (e.g. via administration of atropine sulphate) raises the heart rate by causing parasympathetic receptor blockade.4
The Vascular System
Capillaries function to allow exchange of fluid, nutrients, electrolytes, hormones and other substances through highly permeable walls between the blood plasma and interstitial fluid (see Figure 9.11). Just before the capillary beds are precapillary sphincters, bands of smooth muscle that adjust flow in the capillaries. Venules collect blood from the capillaries to veins. Excess tissue fluid is collected by the lymphatic system. Lymphatic veins have a similar structure to the cardiovascular system veins described below, with lymph returning to this system at the right side of the heart.
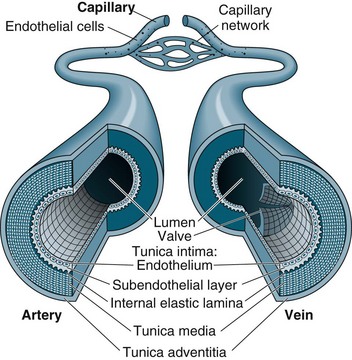
Veins collect and transport blood back to the heart at low pressure and serve as a reservoir for blood. Therefore, veins are numerous and have thinner, less muscular walls, which can dilate to store extra blood (up to 64% of total blood volume at any time). Some veins, particularly in the lower limbs, contain valves to prevent backflow and ensure one-way flow to the heart. Venous return is promoted during standing and moving by the muscles of the legs compressing the deep veins, promoting blood flow towards the heart.1,4
Blood Pressure
Blood flow is maintained by pulsatile ejection of blood from the heart and pressure differences between the blood vessels. Traditionally, blood pressure is measured from the arteries in the general circulation at the maximum value during systole and the minimum value occurring during diastole. The cardiovascular system must supply blood according to varying demands and in a range of circumstances, with at least a minimal blood flow to be maintained to all organs. At a local level this is achieved by autoregulation of individual arteries, such as the coronary arteries, in response to the metabolic needs of the specific tissue or organ. The exact mechanism is unknown, but it has been proposed that increased vascular muscle stretch and/or metabolites and decreased oxygen levels are detected and cells release substances such as adenosine.4 These substances result in rapid vasodilation and increased perfusion. The vascular endothelium actively secretes prostacyclin and endothelial-derived relaxing factor (nitric oxide), both vasoactive agents.
Renal control
In addition to longer term fluid regulation, during acute illness or time of acute hypotension, the renin-angiotensin-aldesterone system (RAAS) plays an important role in maintaining blood pressure. This negative feedback system results in both reabsorption of intravascular fluid and increases peripheral resistance, in an effort to increase blood pressure. Further details on the RAAS system can be found in Chapter 18.
Assessment
Specific physical assessment in relation to cardiovascular function should be inclusive of:
• respiratory assessment for signs of pulmonary oedema (shortness of breath or basal crepitations)
• assessment of neck vein distension for signs of right sided venous congestion
• assessment for signs of peripheral oedema
• capillary refill time with >3 sec return indicative of sluggish capillary return
• 12-lead ECG for signs of ischaemia or cardiac pathology
• appearance and temperature of the skin for signs of peripheral constriction or dehydration
• core body temperature measurement
• urine output with <0.5 mL/kg/hour a potential indicator of decreased renal perfusion.12
Auscultation of Heart Sounds
A guide to placement of stethoscope when listening to heart sounds is presented in Table 9.1.
TABLE 9.1 Guide to placement of stethoscope when listening to heart sounds
| Stethescope placement | Auditable region of heart | |
|---|---|---|
| 2nd intercostal space | right of sternum | aortic valve |
| 2nd intercostal space | left of sternum | pulmonary valve |
| 4th intercostal space | left side of sternum | tricuspid valve |
| 5th intercostal space | midclavicular line | mitral valve |
In addition to pericardial rub, murmurs may also be audible. Murmurs are generally classified and characterised by location with the most common murmurs associated with the mitral or aortic valves due to either stenosis or regurgitation at these locations. Murmurs are best thought of as turbulent flow or vibrations associated with the corresponding valve and can be of variable pitch. Specialist cardiac referral is indicated upon detection of cardiac murmurs to differentiate pathological murmurs as seen during valvular dysfunction or myocardial infarction from innocent systolic ‘high flow’ murmurs detected in children or adolescents as a result of vigorous ventricular contraction. Murmurs may be classified using the Levine scale,12 seen in Table 9.2.
TABLE 9.2 Classification of heart murmurs using the Levine scale12
| Grade 1 | low intensity and difficult to hear |
| Grade 2 | low intensity, but audible with a stethoscope but no palpable thrill |
| Grade 3 | medium intensity and easily heard with a stethoscope |
| Grade 4 | loud and audible and with palpable thrill |
| Grade 5 | very loud but cannot be heard outside the praecordium and with palpable thrill |
| Grade 6 | audible with the stethoscope away from the chest |
Continuous Cardiac Monitoring
Internationally, a minimum standard for an ICU requires availability of facilities for cardiovascular monitoring.13 Continuous cardiac monitoring allows for rapid assessment and constant evaluation with, when required, the instantaneous production of paper recordings for more detailed assessment or documentation into patient records. In addition, practice standards for electrocardiographic monitoring in hospital settings have been established.14
It is now common practice for five leads to be used for continuous cardiac monitoring,5 as this allows a choice of seven views. The five electrodes are placed as follows:15
• right and left arm electrodes: placed on each shoulder;
• right and left leg electrodes: placed on the hips or level with the lowest ribs on the chest;
• V-lead views can be monitored: for V1 place the electrode at the 4th ICS, right of the sternum; for V6 place the electrode at the 5th ICS, left mid-axillary line.
The monitoring lead of choice is determined by the patient’s clinical situation.15 Generally, two views are better than one. V1 lead is best to view ventricular activity and differentiate right and left bundle branch blocks; therefore, one of the channels on the bedside monitor should display a V lead, preferably V1, and the other display lead II or III for optimal detection of arrhythmias. When the primary purpose of monitoring is to detect ischaemic changes leads III and V3 usually present the optimal combination.14
12-lead ECG
The Dutch physiologist Einthoven was one of the first to represent heart electrical conduction as two charged electrodes, one positive and one negative.16 The body can be likened to a triangle, with the heart at its centre, and this has been called Einthoven’s triangle. Cardiac electrical activity can be captured by placing electrodes on both arms and on the left leg. When these electrodes are connected to a common terminal with an indifferent electrode that stays near zero, an electrical potential is obtained. Depolarisation moving towards an active electrode produces positive deflection.
The 12-lead ECG consists of six limb leads and six chest leads. The limb leads examine electrical activity along a vertical plane. The standard bipolar limb leads (I, II, III) record differences in potential between two limbs by using two limb electrodes as positive and negative poles (see Figure 9.12):17 Leads I, II, and III all produce positive deflections on the ECG because the electrical current flows from left to the right and from upwards to downwards. Placement should be:
• I = negative electrode in right arm and positive electrode in left arm
• II = negative electrode in right arm and positive electrode in left leg
• III = negative electrode in left arm and positive electrodes in left leg
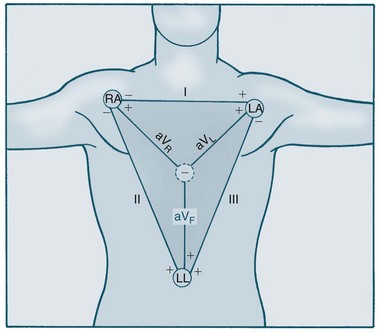
The three unipolar limb leads (aVR, aVL, aVF) record activity of the heart’s frontal plane. Each of these unipolar leads have only one positive electrode (the limb electrode such as left arm, right arm and left leg), with the centre of the Einthoven’s triangle acting as the negative electrode. The waveforms of these leads are usually very small therefore they are augmented by the ECG machine to increase the size of the potentials on the ECG strip.17 These three leads views the heart at different angles:
• Lead aVR produces a negative reflection because the electrical activity moves away from the lead. Lead aVR does not provide a specific view of the heart.
• Lead aVL produces a positive deflection because the electrical activity moves towards the lead. Lead aVL views the electrical activity from the lateral wall.
• Lead aVF also produces a positive deflection on the ECG because the electrical activity flows toward this lead. It views the electrical activity from the inferior wall.
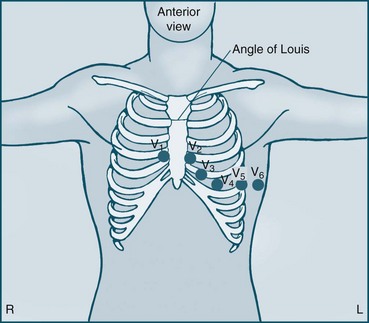
The six unipolar chest leads (precordial leads) are designated V1–6 and examine electrical activity along a horizontal plane from the right ventricle, septum, left ventricle and the left atrium. They are positioned in the following way (see Figure 9.13):
• V1 = 4th ICS, to the right of the patient’s sternum
• V2 = 4th ICS, to the left of the patient’s sternum
• V3 = equidistant between V2 and V4
• V4 = 5th ICS on the midclavicular line
• V5 = 5th ICS, anterior axillary line
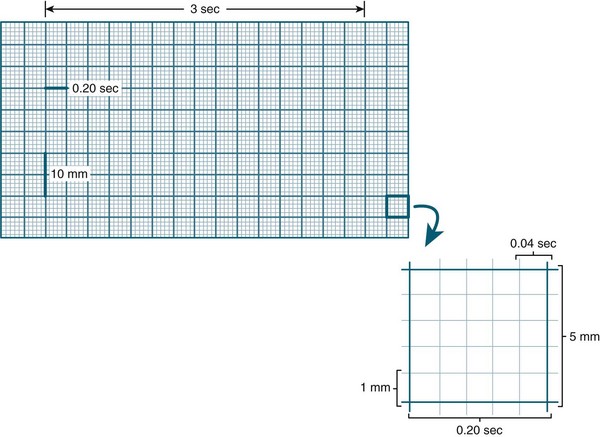
Amplitude (voltage) in the ECG is measured by a series of horizontal lines on the ECG (see Figure 9.14). Each line is 1 mm apart and represents 0.1 mV. Amplitude reflects the wave’s electrical force and has no relation to the muscle strength of ventricular contraction.8 Duration of activity within the ECG is measured by a series of vertical lines also 1 mm apart (see Figure 9.14). The time interval between each line is 0.04 sec. Every 5th line is printed in bold, producing large squares. Each represents 0.5 mV (vertically) and 0.2 sec (horizontally).
< div class='tao-gold-member'>
Stay updated, free articles. Join our Telegram channel

Full access? Get Clinical Tree


