- Function of glucose as an energy source
- Hormone regulation of blood glucose concentration
- Defining normal and abnormal blood glucose
- Diabetes and diabetic ketoacidosis
- Using blood glucose to diagnose diabetes
- Using blood glucose and HbA1c to monitor diabetes
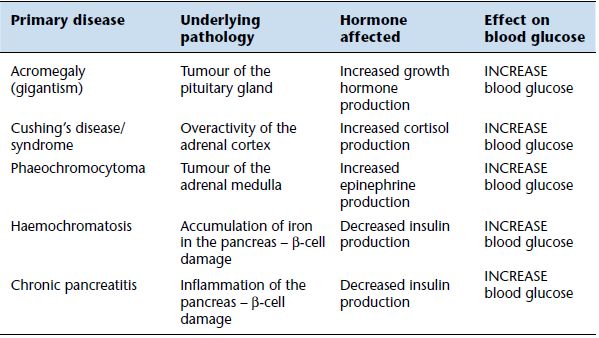
- Non-diabetic causes of raised blood glucose
- Causes and effects of reduced blood glucose
The most significant reason for measurement of the concentration of glucose in blood is diagnosis and monitoring of diabetes mellitus (known commonly as simply diabetes). This is a common chronic metabolic disease, most often associated with obesity, that represents a major and ever growing health problem in the UK, and around the world. Close to 2.9 million people in the UK (4.7% of the total population) are diagnosed with diabetes; an estimated further 850 000 have diabetes but remain undiagnosed1. Recent study2 suggests that by 2035 there will be over 6.25 million diabetic patients in the UK (8.6% of projected total population). Current annual cost to the NHS of diabetes is estimated at £10 billion (10% of total NHS spending); this is forecast to rise to £16.9 billion by 20352.
As we shall see, abnormality in blood glucose concentration is not confined to those suffering diabetes. This chapter also includes consideration of another test, HbA1c, which is used for monitoring the effectiveness of diabetes treatment.
Normal physiology
The carbohydrate present in the food we eat accounts for around 60% of our dietary requirement. In the gastrointestinal tract, complex food carbohydrates (starches) are digested by enzymes to simple molecules, for absorption to the blood stream. These simple molecules are the monosaccharides: glucose, fructose and galactose. Of these, glucose is by far the most abundant, representing on average around 80% of absorbed monosaccharides. Once inside the body most of the fructose and galactose is converted to glucose. Nearly all of our dietary carbohydrate then is converted to glucose. Most cells in the body also have mechanisms for converting non-carbohydrates (fats and proteins) to glucose when demand for glucose is high and supply is low (starvation).
Why is glucose important?
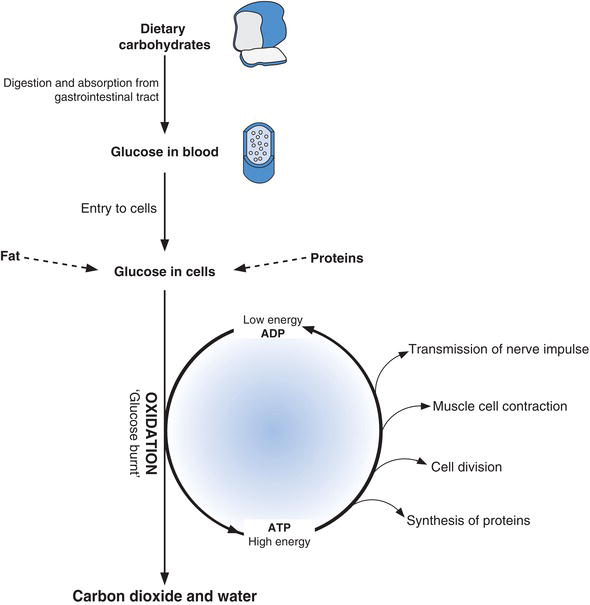
Glucose can only function within cells, where it is the major source of energy. In every cell of the body this energy is realised by the metabolic oxidation of glucose to carbon dioxide and water. In the process the energy contained within glucose is used to form the energy rich compound adenosine triphosphate (ATP) from adenosine diphosphate (ADP). The energy contained within ATP in turn is used to drive the many chemical reactions within the cell that are needed for it to remain viable and fulfil its function (Figure 3.1).
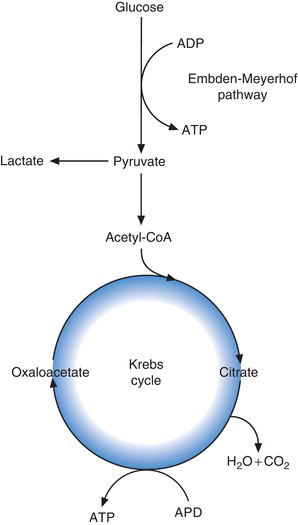
The oxidation of glucose, with resulting generation of energy rich ATP occurs in two major cellular metabolic pathways (Figure 3.2). They are the glycolytic pathway (sometimes called simply glycolysis or the Embden-Meyerhof pathway after the two scientists who first described it) and the Krebs cycle (alternative name tri-carboxylic acid cycle). The process begins with the glycolytic pathway, in which glucose is converted (oxidised) via 13 separate enzymic reactions to the tri-carboxylic acid, pyruvate. The fate of pyruvate depends on the relative amount of tissue oxygen. In normally oxygenated tissue, pyruvate is converted to a substance called acetyl CoA which enters the Krebs cycle and joins (condenses) with another tri-carboxylic acid, oxaloacetic acid to form citric acid. In a further nine enzymic reactions, citric acid is converted back to oxaloacetic acid for condensation with more acetyl CoA generated by glycolysis.
Oxidation of one molecule of glucose in the glycolytic pathway yields two molecules of pyruvate and eight molecules of ATP. Further oxidation of the two molecules of pyruvate generated by glycolytic pathway in Krebs cycle yields a further 30 molecules of ATP. So in total, oxidation of one molecule of glucose to CO2 and H2O yields 38 molecules of energy rich ATP.
In the absence of sufficient oxygen, glucose can be converted to pyruvate by the glycolytic pathway, but pyruvate cannot enter Krebs cycle. Instead it is converted to lactate (lactic acid). Accumulation of lactic acid in the blood occurs in any illness (usually critical illness) in which, for any number of reasons, oxygen delivery to tissue cells is compromised. This accumulation of lactic acid is a direct result of anaerobic glycolysis (i.e. glycolysis in tissues with relative oxygen deficiency).
Figure 3.1 Glucose has central metabolic role within cells providing energy for the chemical reactions required for cells to function.
Importance of maintaining normal blood glucose concentration
Unlike other tissues, the brain is unable to manufacture or store glucose and is dependent on a ready supply of glucose in blood for its energy requirements. The maintenance of a minimum amount of glucose in blood is essential for normal brain function. Blood glucose concentration above around 4.0 mmol/L ensures this function. It is equally important however to ensure that blood glucose concentration does not rise too high. Glucose is an osmotically active substance. This means that as the concentration of glucose in blood rises its osmotic effect tends to draw water out of surrounding cells leaving them relatively dehydrated. In order to combat this potentially lethal effect on cells, the kidneys compensate by excreting glucose in urine when blood levels rise above a certain concentration called the renal threshold (usually around 10.0–11.0 mmol/L). However, in doing this, the valuable energy resource which glucose represents, is lost from the body. For good health then, blood glucose concentration must not rise above a maximum level, or the body’s most significant energy resource will be lost in urine, but it must not fall too low either, or brain function will be threatened.
Glucose can be stored
Although all cells require glucose for energy, the demand may vary between cells and will vary at different times of the day. For example, muscle cell demand will be highest during exercise and lowest during sleep. Cellular demand for glucose does not always coincide with meals when glucose is available and there is therefore a need to store dietary glucose until it is required. Most cells in the body can store limited amounts of glucose but three sorts of tissue mainly serve this function:
- liver,
- muscle,
- fat (adipose tissue).
The cells of these organs are able to remove glucose from blood and store it when demand is low or supply is high (immediately after meals). Between meals when glucose is in short supply glucose is mobilised from these stores.
Liver and muscle cells store glucose as the polymer molecule glycogen, which is effectively many glucose molecules joined together. The enzymic process by which glycogen is formed from glucose in these cells is called glycogenesis. The reverse process called glycogenolysis allows glucose to be recovered from this store and occurs in response to a falling blood glucose concentration. Glucose can be taken up by fat cells and converted by a process called lipogenesis to triglyceride, a fat, and stored in this form. Triglyceride can be mobilised from fat stores to provide energy by a process known as lipolysis, but this will only occur after glycogen stores are depleted. In this way glycogen provides short-term storage of glucose and fat provides long-term storage of glucose.
How is blood glucose concentration maintained within the normal range?
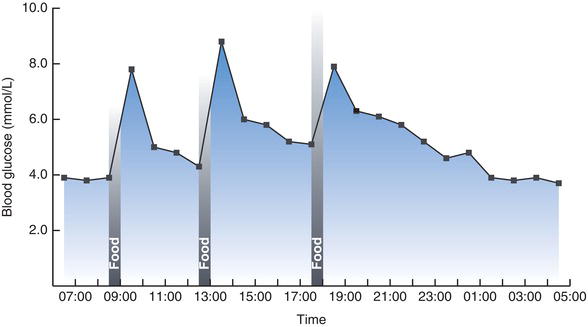
Despite the considerable variation in glucose intake and utilisation throughout the day, blood glucose concentration never usually rises above around 8.0 mmol/L or falls below around 3.5 mmol/L. Figure 3.3 describes typical normal daily fluctuation.
Immediately after a meal blood glucose concentration rises as glucose derived from food is absorbed from the gut. The cells of the body take up this glucose; some is utilised to satisfy current energy requirement and any excess is stored as glycogen in liver and muscle cells, or as fat (triglyceride) in adipose tissue. As a consequence of this movement of glucose from blood to cells, blood glucose concentration falls between meals. However in order to maintain minimum blood glucose concentration between meals, glucose is mobilised from hepatic glycogen stores. If necessary glucose may also be manufactured within cells from non-carbohydrate sources such as protein, by a process called gluconeogenesis.
Both the uptake of glucose from blood by cells and the metabolic pathways involved in blood glucose regulation (glycogenesis, glycogenolysis etc.) are under the overall control of hormones, the secretion of which are governed in turn by blood glucose concentration.
Hormonal control of blood glucose concentration
The pancreatic hormones insulin and glucagon are the most important for regulating blood glucose levels. Insulin has the effect of reducing blood glucose levels by:
- Promoting uptake of glucose by cells from blood (the uptake of glucose by cells of the liver and central nervous system is independent of insulin).
- Promoting the cellular metabolism (oxidation) of glucose to pyruvate (glycolysis).
- Increasing formation of glycogen from glucose in liver and muscle (glycogenesis).
- Increasing formation of triglyceride from glucose in adipose cells (lipogenesis).
- Inhibiting production of glucose from non-carbohydrate sources (gluconeogenesis).
Insulin is synthesised in, and secreted by the beta (β) cells of the pancreas in response to rising blood glucose concentration, and operates by binding to insulin receptors present on the surface of insulin sensitive cells. The normal hormonal response to rising blood glucose depends then on:
- adequate amount of insulin and therefore normally functioning pancreatic β cells; and
- adequate and functioning insulin receptors on the surface of insulin sensitive cells.
Without either of these, blood glucose concentration continues to rise.
Glucagon is an insulin antagonist hormone synthesised in, and secreted from, the alpha (α) cells of the pancreas in response to a falling blood glucose concentration. In direct contrast to the action of insulin, glucagon has the effect of raising blood glucose levels by:
- Increasing hepatic production of glucose from glycogen (glycogenolysis).
- Increasing production of glucose from non-carbohydrate sources (gluconeo-genesis).
To recap, rising blood glucose concentration stimulates the pancreas to secrete insulin. By its various effects, insulin reduces blood glucose concentration. Falling blood glucose levels induces glucagon secretion, which prevents further blood glucose reduction. Continuous synergy of these two opposing hormonal effects ensures that blood glucose concentration is maintained within normal limits.
Table 3.1 Hormones involved in regulating blood glucose concentration.
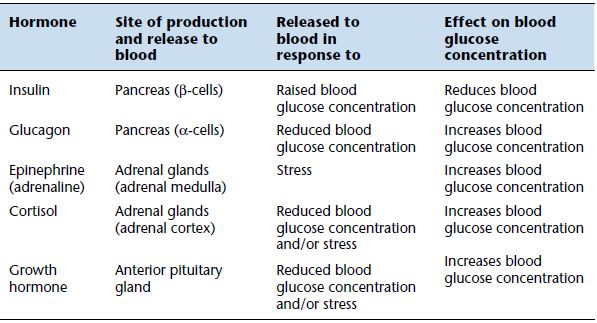
Three further hormones are secreted in response to a low blood glucose concentration and also in response to stress. They are: cortisol, synthesised by the adrenal cortex; epinephrine (formerly known as adrenalin), synthesised by the adrenal medulla; and growth hormone, secreted by the anterior pituitary. These all have the effect of increasing blood glucose concentration. There are then four hormones, glucagon, cortisol, epinephrine and growth hormone, that serve to prevent blood glucose concentration falling too low, but only insulin prevents blood glucose concentration from rising too high. This reflects the prime importance of maintaining adequate minimal level of glucose in blood for normal brain function. Table 3.1 provides a summary of the hormones involved in blood glucose regulation.
Laboratory measurement of blood or plasma glucose
Patient preparation
If the test is to determine fasting blood glucose, no food should be taken for at least 12 hours prior to blood sampling; otherwise no particular patient preparation is necessary.
Timing of sample
Blood glucose concentration varies throughout the day, highest at around 1 hour after the main meal of the day and lowest first thing in the morning before food; correct interpretation demands that the time be recorded on the specimen. Samples may be random (without reference to time of food), fasting (sample taken after an overnight 12 hour fast) or 2 hour post-prandial (sample taken 2 hours after a meal).
Sample requirement
Around 2 ml venous blood is collected into a special tube (most often grey or yellow top), containing the glucose preservative sodium fluoride and an anticoagulant, potassium oxalate. Fluoride is an enzyme poison that effectively prevents continued red cell glycolysis, and therefore preserves glucose concentration. Anticoagulant prevents the sample from clotting. The blood should be mixed with these chemicals by gentle inversion. Glucose may be measured directly on the whole blood sample, or on plasma recovered from the blood sample.
Reference range
| Fasting blood glucose | 3.5 – 5.0 mmol/L. |
| Random blood glucose | 3.5 – 8.0 mmol/L. |
| Two hour post-prandial glucose | at 2 hours after food, glucose levels should be falling toward normal fasting concentration. |
[Note: Plasma glucose results are between 10–15% higher than those derived from whole blood.]
Terms used in interpretation of results
| Normoglycaemia | normal blood or plasma glucose concentration. |
| Hyperglycaemia | raised blood or plasma glucose concentration. |
| Hypoglycaemia | low blood or plasma glucose concentration. |
Critical values
Blood glucose <2.2 mmol/L or >25.0 mmol/L. Severe hypoglycaemia, particularly among neonates, is associated with the risk of convulsions, coma and permanent brain damage. Severe hyperglycaemia may signal ketoacidosis or hyperosmolal (nonketotic) coma; these are acute life threatening complications of diabetes.
Causes of abnormal blood glucose
Abnormality of blood glucose concentration (either hyper- or hypoglycaemia) is almost always the result of too little or too much of one of the hormones required for normal regulation of blood glucose concentration. The most significant cause of hyperglycaemia by far is diabetes mellitus.
Diabetes mellitus
Diabetes mellitus – which must be distinguished from diabetes insipidus, a quite separate and much rarer disease – is the name given to a group of disorders that are characterised by hyperglycaemia, due to an absolute or relative deficiency of insulin. Glucose accumulates in blood for two main reasons. Firstly, glucose present in blood cannot enter cells (except those of the liver and brain) in the absence of an effective insulin response. Secondly, hepatic production of glucose from glycogen (glycogenolysis) is inappropriately increased by insulin deficiency.
Table 3.2 Major features that distinguish Type 1 and Type 2 diabetes.
| Type 1 diabetes | Type 2 diabetes |
| Less common (accounts for 10–15%of total diabetic population) | More common (accounts for 85–90%of total diabetic population) |
| Usually diagnosed in childhood(peak age at diagnosis 10–14 years) | Usually diagnosed in adults over theage of 40 years. Prevalence increases with age beyond 40 years. Increase in child obesity has driven the emergence of Type 2 diabetes in childhood, once a very rare occurrence |
| Little or no insulin production | Insulin production normal or may be increased |
| Genetic factors less significant | Genetic factors more significant –very often a family history |
| Patients typically not obese – maybe thin | Obesity common and a significantcausative risk factor |
| Ketoacidosis is a commonpresenting feature at diagnosis and can occur after diagnosis | Ketoacidosis – rare |
| Absolute requirement for insulin | No absolute requirement for insulinin the short term – treatment usually based on tablets (hypoglycaemic agents) that reduce blood glucose concentration. Insulin treatment may eventually become necessary |
Primary diabetes is classified on clinical and aetiological grounds to one of two main types. Type 1 diabetes, which accounts for around 10–15% of the total diabetic population, results from selective autoimmune destruction of the insulin producing β cells of the pancreas. These people have an absolute insulin deficiency and require daily injections of exogenous insulin for survival. Type 2 diabetes is much more common, accounting for around 85–90% of the diabetic population. Here the primary problem is not insulin deficiency but lack of insulin effect (sometimes called insulin resistance); the cellular response to normal physiological insulin levels is defective. Type 2 diabetes is strongly linked to obesity and this link largely accounts for the increasing prevalence of diabetes among adults and the recent emergence of Type 2 diabetes in children, once an extremely rare occurrence. Some of the distinguishing features of Type 1 and Type 2 diabetes are highlighted in Table 3.2.
Pregnancy is associated with a number of hormonal changes that predispose to diabetes. Depending on the population studied, as well as the criteria adopted for diagnosis, between 1% and 14% of women become temporarily diabetic during their pregnancy; the prevalence of this complication of pregnancy is increasing3. When diabetes is diagnosed during pregnancy it is called gestational diabetes. The diagnosis does not apply to those women with Type 1 or Type 2 diabetes who subsequently become pregnant. In most cases of gestational diabetes, the abnormality disappears at the end of the pregnancy. However women with a history of gestational diabetes have a significantly greater than normal lifelong risk of developing Type 2 diabetes; a recent follow up study found that close to 20% develop Type 2 diabetes within nine years of their pregnancy4. All women with a history of gestational diabetes should be offered lifelong regular (annual) fasting blood glucose testing to screen for Type 2 diabetes.
Table 3.3 Most common causes of secondary diabetes.
Stay updated, free articles. Join our Telegram channel

Full access? Get Clinical Tree


