Fundamentals of Epidemiology and Social Epidemiology
Fundamentals of Epidemiology and Social Epidemiology
Susan Moscou
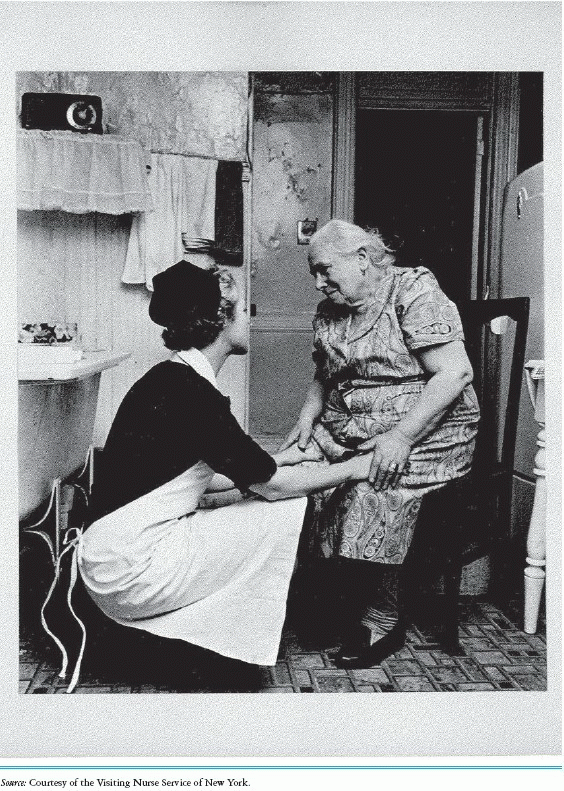
Despite my experience in a large metropolitan hospital, and the subsequent knowledge gained through a year’s residence in a reformatory and asylum for the waifs of New York, the exposure of that rear tenement in the lower East Side was a most terrible shock, a shock that was at first benumbing. A picture was presented of human creatures, moral, and, in so far as their opportunities allowed them, decent members of society, in rooms reached through a court that held open closets to be used by men and women, from some of which the doors had been torn away; up dirty steps into a sick-room where there was no window, the one opening leading into a small, crowded room where husband, children, and boarders were gathered together, impossible conditions under which to attempt to establish a home and bring up children (Wald, 1902, p. 567).
LEARNING OBJECTIVES
At the completion of this chapter, the reader will be able to
Describe epidemiology and social epidemiology.
Explain how the processes involved in epidemiology and social epidemiology are important within the context of providing for the public’s health.
Analyze the different perspectives of epidemiology and social epidemiology in the context of public health nursing.
KEY TERMS
Epidemiology Terms
Age-specific rates
Analytical epidemiology
Attack rates
Chain of infection
Crude rates
Descriptive epidemiology
Epidemiological triad
Agent
Environment
Host
Incidence rates
Prevalence rates
Rate
Social Epidemiology Terms
Developmental and life-course perspective
Life course model
Multilevel analysis
Population perspective
Social context
Social determinants of health
Discrimination
Education
Income
Income inequality
Occupation
Socioeconomic position
Socioeconomic status
This chapter discusses the concepts of epidemiology and social epidemiology and their use in public health nursing. Nursing students should use epidemiological tools when they want to understand how and why disease occurs within populations instead of individuals. Examples of populations are pregnant adolescents living in the South Bronx and college-aged students with sexually transmitted diseases. Nursing students use social epidemiological tools when they want to understand how the effects of poverty, income inequality, and discrimination contribute to how and why disease occurs within specific populations. The purpose of this chapter is to present the concepts of epidemiology and social epidemiology to the public health nurse for application in their practice.
Epidemiology
Epidemiology is the scientific discipline that studies the distribution and determinants of diseases and injuries in human populations (Tarzian, 2005). The goal of epidemiology is to limit disease, injury, and death via specific interventions designed to prevent or limit outbreaks or epidemics (U.S. Department of Health and Human Services {DHHS} & Centers for Disease Control and Prevention {CDC}, 1998, 2006). Epidemiology is concerned with the health of particular populations, whereas clinical nursing and medicine are concerned with individual health issues. The perspective of epidemiologists is to understand the source of the illness cause or exposure, ascertain who else has been exposed, if the exposure has spread beyond the initial point of contact, and to prevent additional cases or recurrences (U.S. DHHS & CDC, 1998, 2006). In comparison, the clinical perspective of medicine and nursing is to obtain information about the history of the present illness, conduct a physical, make a diagnosis, prescribe treatment— issues are considered on an individual basis and are treated as a single episode. Public health nurses are more in line with the epidemiology perspective because they are educated to integrate knowledge about the environment and the community with their understanding of health and illness as experienced by the individual, family, and population. The perspective in medicine tends to be focused on individual health, whereas the perspective in epidemiology tends to be focused on the population. Box 4-1 illustrates the various ways these clinicians, practicing within these two frameworks, would approach a situation in which a college student falls ill and is taken to the student health center.
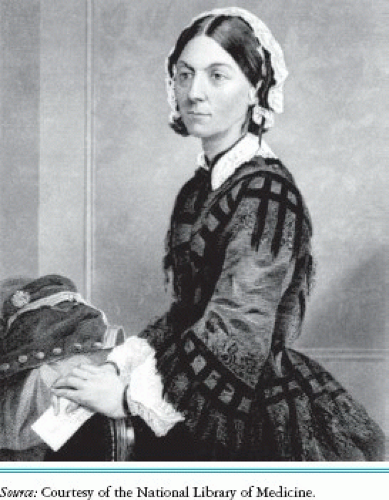
Florence Nightingale.
Box 4-1 CLINICAL vs. EPIDEMIOLOGY PERSPECTIVE
Picnic Scenario: Fifty college students attend a picnic. The food is served at noon, and the students eat turkey, cornbread, tuna salad, and ice cream. The students return to campus. One student becomes sick and is taken to the student health center.
Clinical Perspective (Single Episode)
History/physical finding of present illness
Diagnosis
Treatment
The clinician asks about the illness, diagnoses the ailment based on symptoms, and then treats.
History of present illness and observation for patterns
How many students were at the picnic?
Who else was sick?
Timing
What caused the illness?
Food
Heat
Is this an epidemic?
The epidemiologist asks about the illness but also wants to know how many students attended the picnic and how many became sick. The epidemiologist also explores with the students what could have caused the illness: Was it the heat or the food? The epidemiologist would also analyze the food and ask if there was mayonnaise in the tuna salad, or how long had the tuna salad been sitting in the heat before it was served? Most importantly, after the epidemiologist gathers the information about the illness, the epidemiologist wants to make sure this is not an epidemic and learn how to prevent this illness in the future.
Florence Nightingale applied this epidemiological framework when attending to soldiers in the Crimean War. Nightingale recognized that environmental problems such as poor nutrition, sanitation, and contaminated blankets contributed to infection and increases in mortality and morbidity. Nightingale’s empirical observations of her surroundings enabled her to examine, methodically, the factors that contributed to disease (Pfettscher, 2002). This big picture allowed Nightingale to deduce how illness occurred and what strategies reduced the spread of disease.
Table 4-1 EPIDEMIOLOGICAL HISTORY AND EVENTS
400 BCE
Hippocrates (c. 400 BCE) provided an approach to those who wanted to investigate disease.
Hippocrates’ treatise, On Airs, Waters, and Places, noted that these elements affected health.
Hippocrates believed that knowing how these elements were similar and different in specific areas would provide the basis to understand why a disease occurred and the probability of where the disease would occur.
17th Century
John Graunt (1620-1674) from London. Graunt published Observations on the Bills of Mortality, which quantified Britain’s mortality data in 1662.
Graunt noted birth and death patterns, infant mortality, occurrences of disease, differences in disease by gender, differences in disease in urban and rural areas, and variations in disease by season.
18th Century
James Lind (1716-1794), studied scurvy (vitamin C deficiency) while sailing on a Navy ship in 1747.
In 1753, Lind published A Treatise on Scurvy in Three Parts.
This publication explained why scurvy occurred and the treatment for scurvy.
19th Century
William Farr (1807-1883) was responsible for the concept of surveillance data.
John Snow (1813-1858), an anesthesiologist, conducted investigations in London during the cholera outbreak.
20th Century
Joseph Goldberger (1874-1929) discovered why the disease pellagra (niacin deficiency) occurred.
The 1964 Surgeon General Report: Smoking and Health: Report of the Advisory Committee to the Surgeon General linked tobacco to lung cancer.
The Framingham Heart Study was initiated to identify factors contributing to heart disease in the United States.
The 1986 Surgeon General’s Report: The AIDS Epidemic.
Sources: Adapted from Hippocrates (400 B.C.E.); The James Lind Library (n.d.); National Library of Medicine (n.d.a., n.d.b.); Office of History National Institute of Health (2005) ; Stephan (n.d.); UCLA Department of Epidemiology School of Public Health (n.d.).
History
Epidemiological tenets have been used to describe and explain disease and the prevalence of these diseases since 400 B.C. A brief history of epidemiological events and well-known persons who used epidemiological thinking is found in Table 4-1.
This epidemiological history can be viewed within the context of two revolutions (Table 4-2). The first epidemiological revolution focused on infectious diseases such as influenza, plague, and tuberculosis, which were largely responsible for illnesses and death in previous centuries. It was also during these times that scientists and public health practitioners discovered that the causes of infectious diseases were poverty, overcrowding, sanitation, and contaminated food and water supplies (Breslow, 2005). From 1870 to 1930, scientists and public health practitioners began to understand the cause(s) of infectious diseases. Once epidemiologists had an understanding of why infectious diseases occurred, public health interventions and some medical advances played a role in the reduction of those diseases.
Table 4-2 EPIDEMIOLOGICAL REVOLUTIONS
First Epidemiological Revolution (1870-1930)
The first epidemiological revolution was largely about infectious diseases. Scientists and public health practitioners discovered the causes of infectious diseases.
Immunizations discovered during this time period:
Smallpox
Polio
Tetanus
Antibiotics discovered:
Streptomycin: effective against tuberculosis (1947)
Penicillin
Immunizations and antibiotics accounted for only a 5% drop in mortality rates.
Greatest advances of the first epidemiological revolution:
Water purification
Pasteurization
Decrease in diarrhea
Decrease in gastroenteritis
Second Epidemiological Revolution (1950-Present)
The second epidemiological revolution focused on chronic diseases such as asthma, cancer, and heart disease and on understanding levels of prevention.
Epidemiologists had little understanding of noninfectious diseases until 1950. During the second revolution, epidemiologists began to understand that 38% of deaths were a result of:
Tobacco (lung cancer and heart disease)
Diet and inactivity (heart disease, diabetes)
Alcohol (heart disease, liver disease)
Understanding the factors that contribute to noninfectious diseases paved the way for interventions. Clinicians use the following levels of preventions with their clients:
Primary (prevent from the outset)
Immunizations
Health education
Secondary (early detection of disease)
Screening tests
PAP
Mammogram
Cholesterol
Colonoscopy
Tertiary (reducing mortality and morbidity of the disease)
Cardiac rehabilitation
Source: Adapted from Bodenheimer and Grumbach, 2008.
The rates of morbidity and mortality of infectious diseases declined in the 18th and 19th centuries because of food production increases, leading to less malnutrition; improvements in nutrition leading to healthier adults and children; and improvements of overall living conditions as a result of improved sanitation and clean water, pasteurization of milk, and less overcrowding. It is important to note that this decrease in infectious disease rates occurred because of public health interventions.
The second epidemiological revolution began in 1950, when epidemiologists started to understand the causes of noninfectious diseases (e.g., heart disease, asthma, diabetes, violence). With this understanding public health practitioners could apply epidemiological principles to shed light on health promotion, disease prevention, and the role of risk factor identification and behavioral change in the promotion of health. Noninfectious diseases are discussed later in this chapter.
To summarize, during the first epidemiological revolution (1870-1930), scientists had little understanding about the causes of infectious diseases (e.g., tuberculosis and influenza). Reductions in infectious diseases were largely the result of public health interventions, whereas medical advances (immunizations and antibiotics) contributed about a 5% reduction in mortality rates. During the second epidemiological revolution (beginning in 1950), epidemiologists began to understand causes of noninfectious diseases such as heart disease, asthma, and diabetes, which paved the way for public health and clinical interventions (Bodenheimer & Grumbach, 2008).
Uses of Epidemiology
Why is it important to understand epidemiology and how it is used? In this section the reader will come to see how epidemiology is applied in public health nursing practice. This process includes the systematic collection of data and how the analysis of these data not only leads to a better understanding of a disease process, but the reduction of disease. The reader will also come to understand how the epidemiological process informs the public health nurse’s decision making.
The collection and use of epidemiology data for decision making can be viewed in the following ways. Public health nurses engage in an assessment process that informs them about the health of the individual, family, population, and community. Chapter 3 is devoted to assessment. The process of assessment provides information so the public health nurse may engage in problem identification and/or potential problem identification, as well as information that may support program development and, at times, the development of public health policy. For example, the data collected by public health nurses may be presented to policymakers to shed light about the actual and potential problems seen in the population of their targeted home communities. Examples of this information may include data that highlight health, social, or environmental problems in a particular population in a policymaker’s constituency; data on risks within their constituency; the history of health problems within a particular population, showing trends such as the increase or decrease of a particular disease; and the services available in a community. Knowing this information helps policymakers make decisions regarding the establishment of law and resource utilization and allocation.
Epidemiology plays a role in our day-today individual decisions pertaining to healthy behaviors such as smoking cessation, exercising, weight control, and eating healthy foods. These positive decisions are made because of epidemiological studies. Epidemiology has contributed to the fount of information about associations and causal relationships (we say causal relationships because research can never prove cause and effect) between obesity and diabetes, smoking and lung cancer, and risky sexual practices, such as engaging in unprotected sex, and sexually transmitted diseases. Without epidemiology we would not know how a disease is transmitted or the strategies to reduce our risks of contracting this disease. Public health nurses use this evidence daily in their practice as they develop educational programs for individuals, families, and populations in an effort to offer information that assists others to make healthy lifestyle choices.
The work of public health practitioners involves public health nurses, epidemiologists, health department officials, clinicians, physicians, scientists, media experts, educators, sanitation officials, and researchers. These individuals all provide particular worldviews that, when joined collectively, complete the clinical picture needed to understand the disease, the progression and trajectory of that disease, and interventions. Completing the clinical picture is identifying what the infectious agent is, why/how the disease is transmitted to the host, where the disease is most prevalent in terms of the place or location, when the disease most makes itself known with regard to time, and who the individual is that is affected by the disease. These are known as the 5 W’s of descriptive epidemiology, and are discussed below (U.S. DHHS & CDC, 2006, p. 31). Part of this clinical picture is an understanding of the determinants of health. One practitioner alone is unable to be a solo artist in this endeavor because effective public health strategies require collaborative and collective efforts between and among many different professions.
Human immunodeficiency virus (HIV) is an example of how epidemiologists were able to complete the clinical picture. In the early 1980s, a strange pneumonia affected five men who identified themselves as having sex with men. Pneumocystis carinii pneumonia was a relatively rare lung disease and appeared to be clustered only within this specific population (Sepkowitz, 2001). Additionally, clinicians were seeing Kaposi’s sarcoma (KS), a relatively benign form of cancer, in their younger male patients who had sex with men. Kaposi’s sarcoma was also relatively rare in the United States; the skin lesions associated with KS were usually localized to the lower extremities and affected older people in their 70s (Hymes et al., 1981).
Because these cases appeared to be clustered within a specific population and puzzled the medical community, the cases and laboratory results were reported to the CDC for further investigation. In 1981, the CDC provided information about the first cases of P. carinii pneumonia and KS among men who have sex with men (CDC referred to this group as homosexuals) to the medical community, and in 1982 the CDC named this disease “acquired immune deficiency syndrome” (known as AIDS). It was not until 1986 that the term “human immunodeficiency virus,” or HIV, was adopted by the clinical community (Sepkowitz, 2008). Once a particular disease or health event is identified, healthcare professionals make the diagnosis in individual cases, whereas epidemiologists contribute to our understanding of the natural history of the disease. Since this time, the work pertaining to HIV has been carried on by a wide and varied group of healthcare professionals. Take a few minutes and just think. Who has contributed to the knowledge of this disease and the treatment of this disease? The list is rather overwhelming, yet at the same time it clearly presents for us the view that in order for the health of the public to be sustained there is a need for the collective wisdom of many working together. Public health nurses are a valued member of this collective group.
Finally, the search for causes is epidemiological research. This research is dedicated to the investigation of the causes and individual, societal, and environmental factors that contribute to a person’s risk for contracting a disease and/or suffering injury. This research provides evidence for interventions that health professionals can use in their clinical practice, such as counseling about smoking, protective sexual practices, seat belts, car child seats, and immunizations. Public health nurses not only apply this research as evidence in their practice but raise questions for research and conduct research.
Epidemiological Approach
When we see a particular disease in our clinical practice or if we decide to explore a particular disease, we want to know who is affected by this disease, what factors contribute to this disease (environmental, social, or personal factors), if there are other cases, when this disease became known, why some individuals are more prone to this particular disease, and what common factors do diseased individuals have in common. Epidemiologists begin with case definition as the standard criteria to guide their practice.
A case definition is that which determines if a person has a particular disease. For example, an individual is diagnosed with diabetes if his or her blood sugar levels are above the cutoff point (126 mg/dL) on two separate occasions (U.S. Preventive Services Task Force, 2008). Case definitions standardize the diagnoses of a particular disease, thus ensuring that every case is similarly diagnosed. Additionally, case definitions consist of clinical criteria, including subjective data, which are client complaints, and objective data, which are the clinician’s observations inclusive of physical, environmental, and laboratory findings.
NUMBERS AND RATES
Epidemiologists are concerned about numbers and rates because it allows them to measure, describe, and compare the morbidity and mortality of a particular disease and/or injury in populations. Rates are “measures of frequency of health events that put raw numbers into a frame of reference to the size of a population. Rates are determined by statistical adjustments to the raw data, making them useful in making comparisons or examining trends” (Stotts, 2008, p. 91).
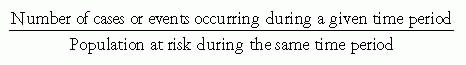
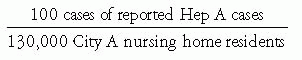
In epidemiology the numerator is the actual number of cases or events occurring during a given time period, and the denominator is the total population at risk during the same time period. The denominator is typically converted to a standard base denominator, such as 1,000, 10,000, or 100,000, so that comparisons can be made among at-risk populations, communities, and neighborhoods (Tarzian, 2005). Rates are useful to the public health nurse because they can help the nurse identify what populations in the community are at an increased risk for a particular disease and/or injury. For example, City A has a population of 130,000 nursing home residents. City A reported 100 cases of hepatitis A among nursing home residents to the Department of Health (DOH). City B has a population of 120,000 nursing home residents. City B reported 150 cases of hepatitis A among their nursing home residents to the DOH. The DOH determined that the specific rate for hepatitis A was 7.6 cases per 10,000 persons living in a nursing home in City A and was 12.5 cases per 10,000 persons in City B. The DOH specific rate calculations for these cities are found in Box 4-2. This type of data helps the public health nurse think about and develop initiatives that target nursing home residents who appear to be a high-risk population for contracting hepatitis A.
In addition to the above specific rates, there are many other rate definitions that measure morbidity (illness rates) or mortality (death rates) for populations at risk for contracting or dying from a particular disease, such as asthma, diabetes, or high blood pressure, or cause, such as a motor vehicle accident. Examples of these rates or statistical calculations are incidence rates, prevalence rates, attack rates, crude rates, and age-specific rates as listed in Table 4-3.
Box 4-2 SPECIFIC RATE CALCULATIONS FOR HEPATITIS A FOUND IN CITY A AND CITY B
Numbers and rates permit the epidemiologist to measure, describe, and compare the morbidity and mortality of particular diseases. A rate is:
In epidemiology, rates are changed to a common base such as 100,000 because it changes the result of the division into a quantity that permits a standardized comparison.
Example:
City A and City B saw an outbreak of hepatitis A in their nursing home residents. Each city reported these cases to the Department of Health. The Department of Health calculated the specific rates for each city using 10,000 as the standard base number. Hepatitis A specific rate for nursing home residents is calculated as follows:
City A specific rate:
City A specific rate: 7.6, which means that in nursing homes for City A, about seven to eight residents contracted hepatitis A.
City B specific rate:
City B specific rate = 12.5
By calculating the specific rate, the Department of Health can compare the hepatitis rates in City A and City B. Additionally, the Department of Health knows that nursing home residents are at risk for contracting hepatitis A.
Source: Adapted from U.S. DHHS & CDC, 2006.
Table 4-3 RATE DEFINITIONS
Incidence Rate
Prevalence Rate
Attack Rate
Specific Rates
Crude Rate
Age-specific Rate
Applied in the study of acute diseases, a disease outbreak, or in the diagnosis of new cases. Incidence rates are the frequency with which a new condition or event occurs in a population over a period of time.
Example We want to know the number of new cases of flu. In the second week of November the student Health Services diagnosed 3 students with the flu. The total student population is 1,600.
Applied in the study of chronic disease. Prevalence rate measures the number of people in a given population who have an already existing condition at a given point in time.
Example We want to know the number of existing cases of flu. There were 3 new cases of the flu in the second week of November and 10 old cases of the flu in the first week of November.
Important for the study of a single disease outbreak or epidemic during a short time period. The number is expressed as a percent.
Example 120 people flew from New York to Los Angeles. The meal served was meatloaf. Eighty people ate the meal and 40 people chose not to eat meatloaf. Twenty of those who ate meatloaf became ill.
Calculation 20 (ill) ÷ 80 (meatloaf pop) × 100
Attack rate is 25%.
These measure morbidity or mortality for a particular population:
Age specific
Gender specific
Income
Race/ethnicity
Infant mortality
Maternal mortality
Example Age-specific diabetes mortality in 45-to 55-year-olds
Calculation Number of diabetes deaths in 45-55-year-olds ÷ Population of individuals 45-55-year-olds × 1,000
A crude rate measures the experience of the entire population in a specific area with regard to the specific disease or condition being investigated.
The crude mortality rate looks at the entire mortality rate from all causes of death for a population in a particular area during a specific time.
Example NYC death rate
Calculation The total number of NYC deaths reported during (1985) ÷ 5 million × 100,000
These rates provide age-specific information for a particular disease.
Example Age-specific mortality rate is one limited to a particular age group. The numerator is the number of deaths in that age group and the denominator is the number of persons in that age group in the population. Examples include:
Neonatal mortality rate Infant mortality rate
Source: Adapted from U.S. DHHS & CDC, 2006.
Only gold members can continue reading. Log In or Register to continue